
Why Airbnb Market Data Matters for Investors
Granular market data serves as the primary indicator for high-stakes investment decisions in the short-term rental sector. For 2026, understanding occupancy rates and return on investment (ROI) requires moving beyond surface-level metrics to analyze underlying market capitalization and revenue trends. This analysis defines the scope for evaluating the financial health of the Airbnb ecosystem and individual property assets.
The correlation between macro-level market performance and micro-level property success is direct. A decline in overall market capitalization often precedes shifts in occupancy rates, affecting cash flow projections for investors. Relying on static or outdated data introduces significant risk, as market conditions can shift rapidly in response to regulatory changes and economic fluctuations.
To mitigate risk, investors must prioritize official and primary sources for market indicators. Data from established financial platforms provides a more reliable foundation for forecasting than anecdotal evidence or unverified reports. This approach ensures that investment strategies are grounded in verified financial realities rather than speculative assumptions.
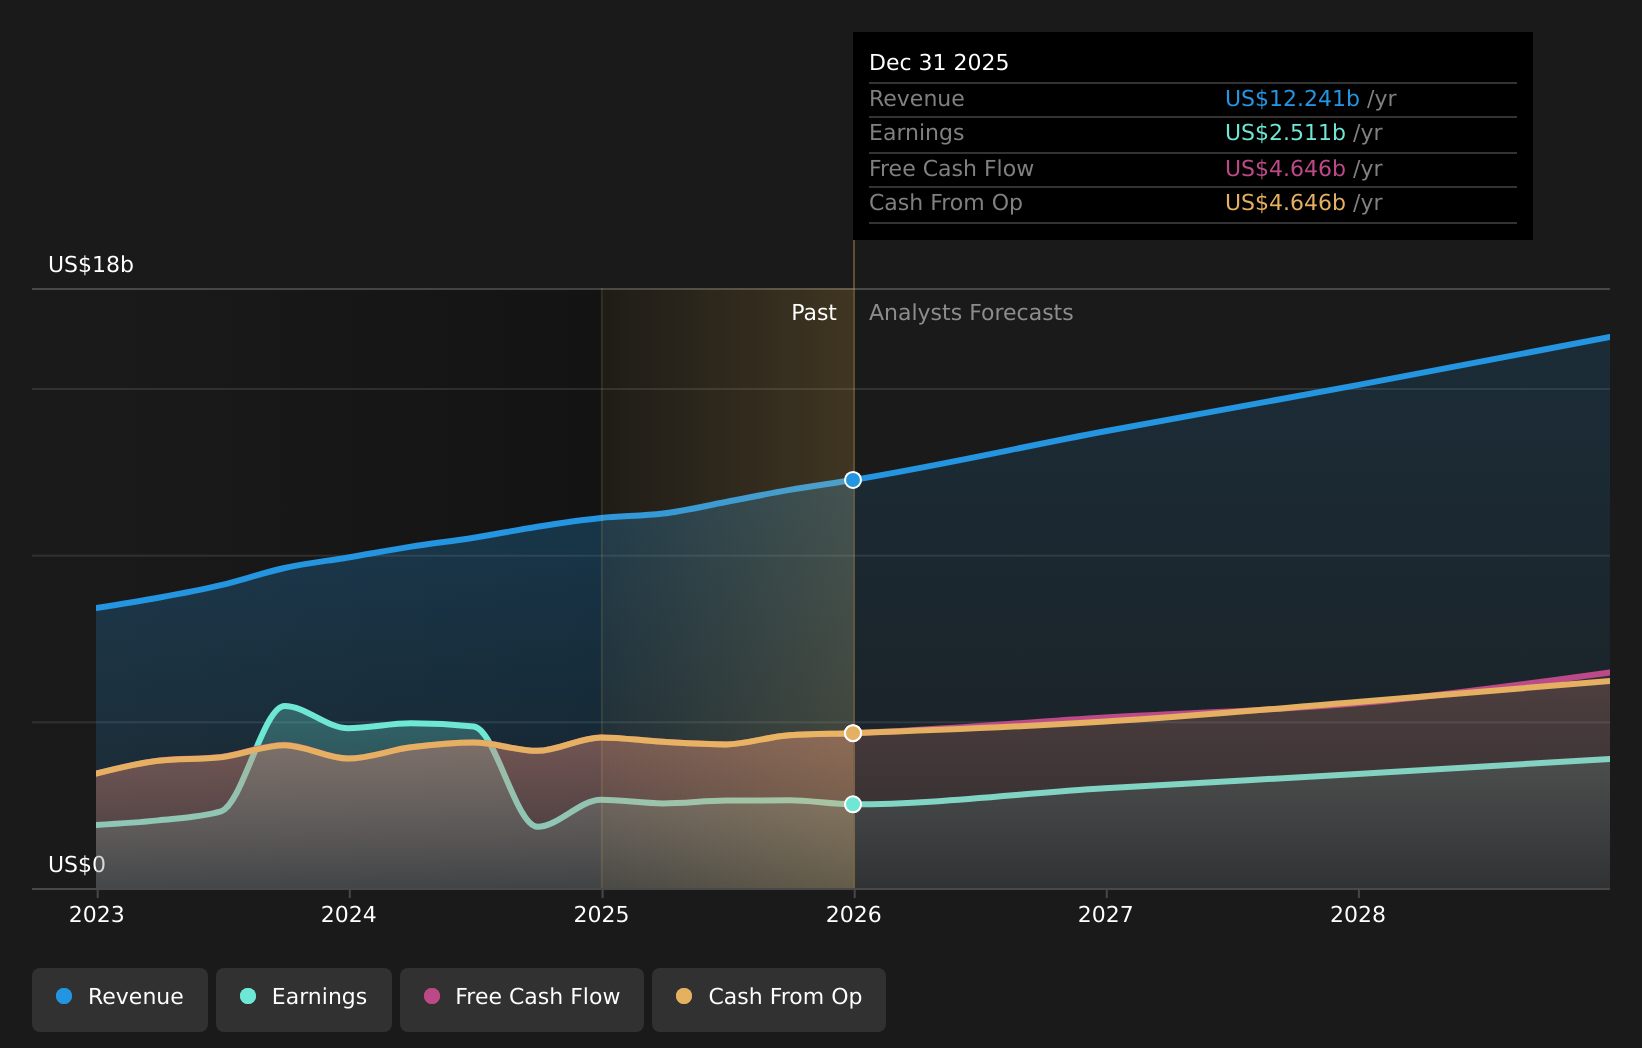
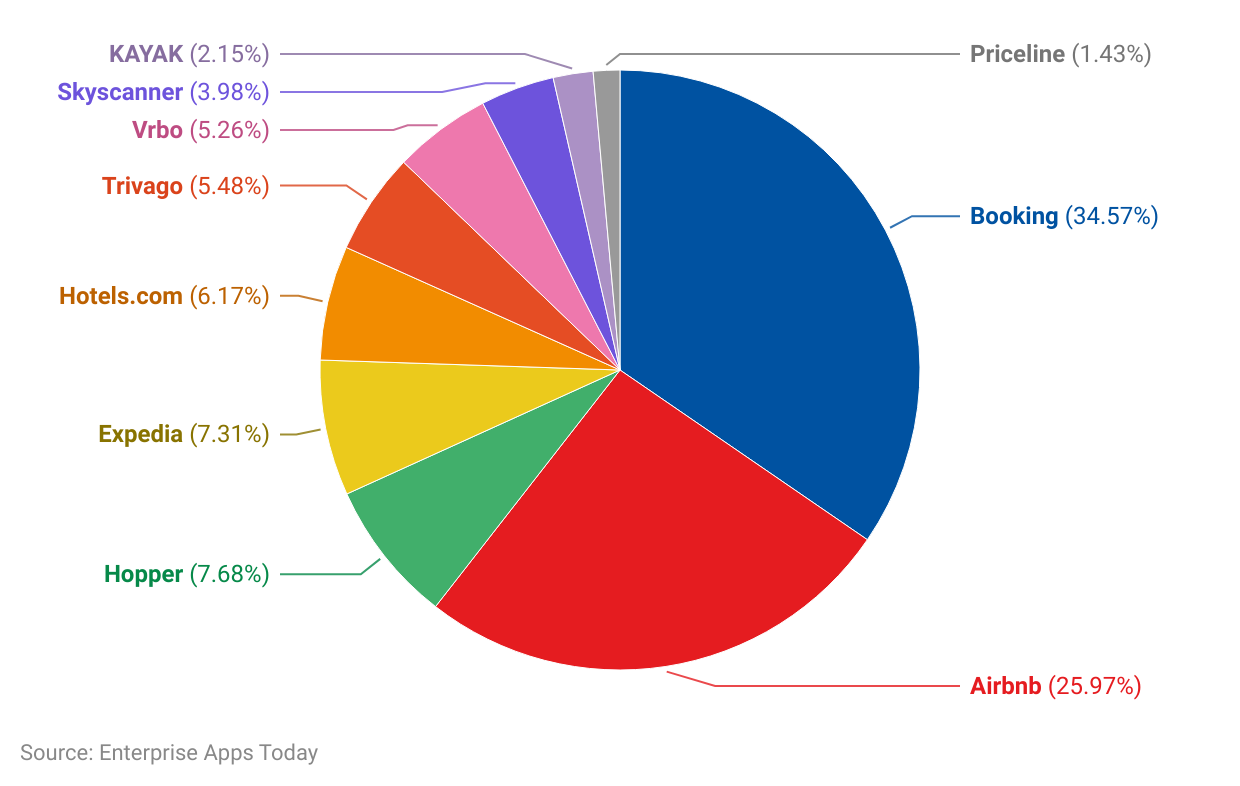
The following chart illustrates the historical trajectory of Airbnb's market capitalization, offering a visual reference for market scale and volatility over recent years. This data point is essential for contextualizing current occupancy trends against broader financial health metrics.
Tracking Occupancy Rates Across Key Markets
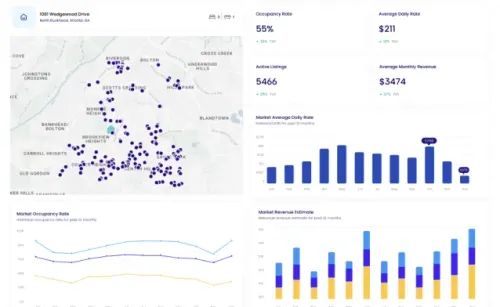
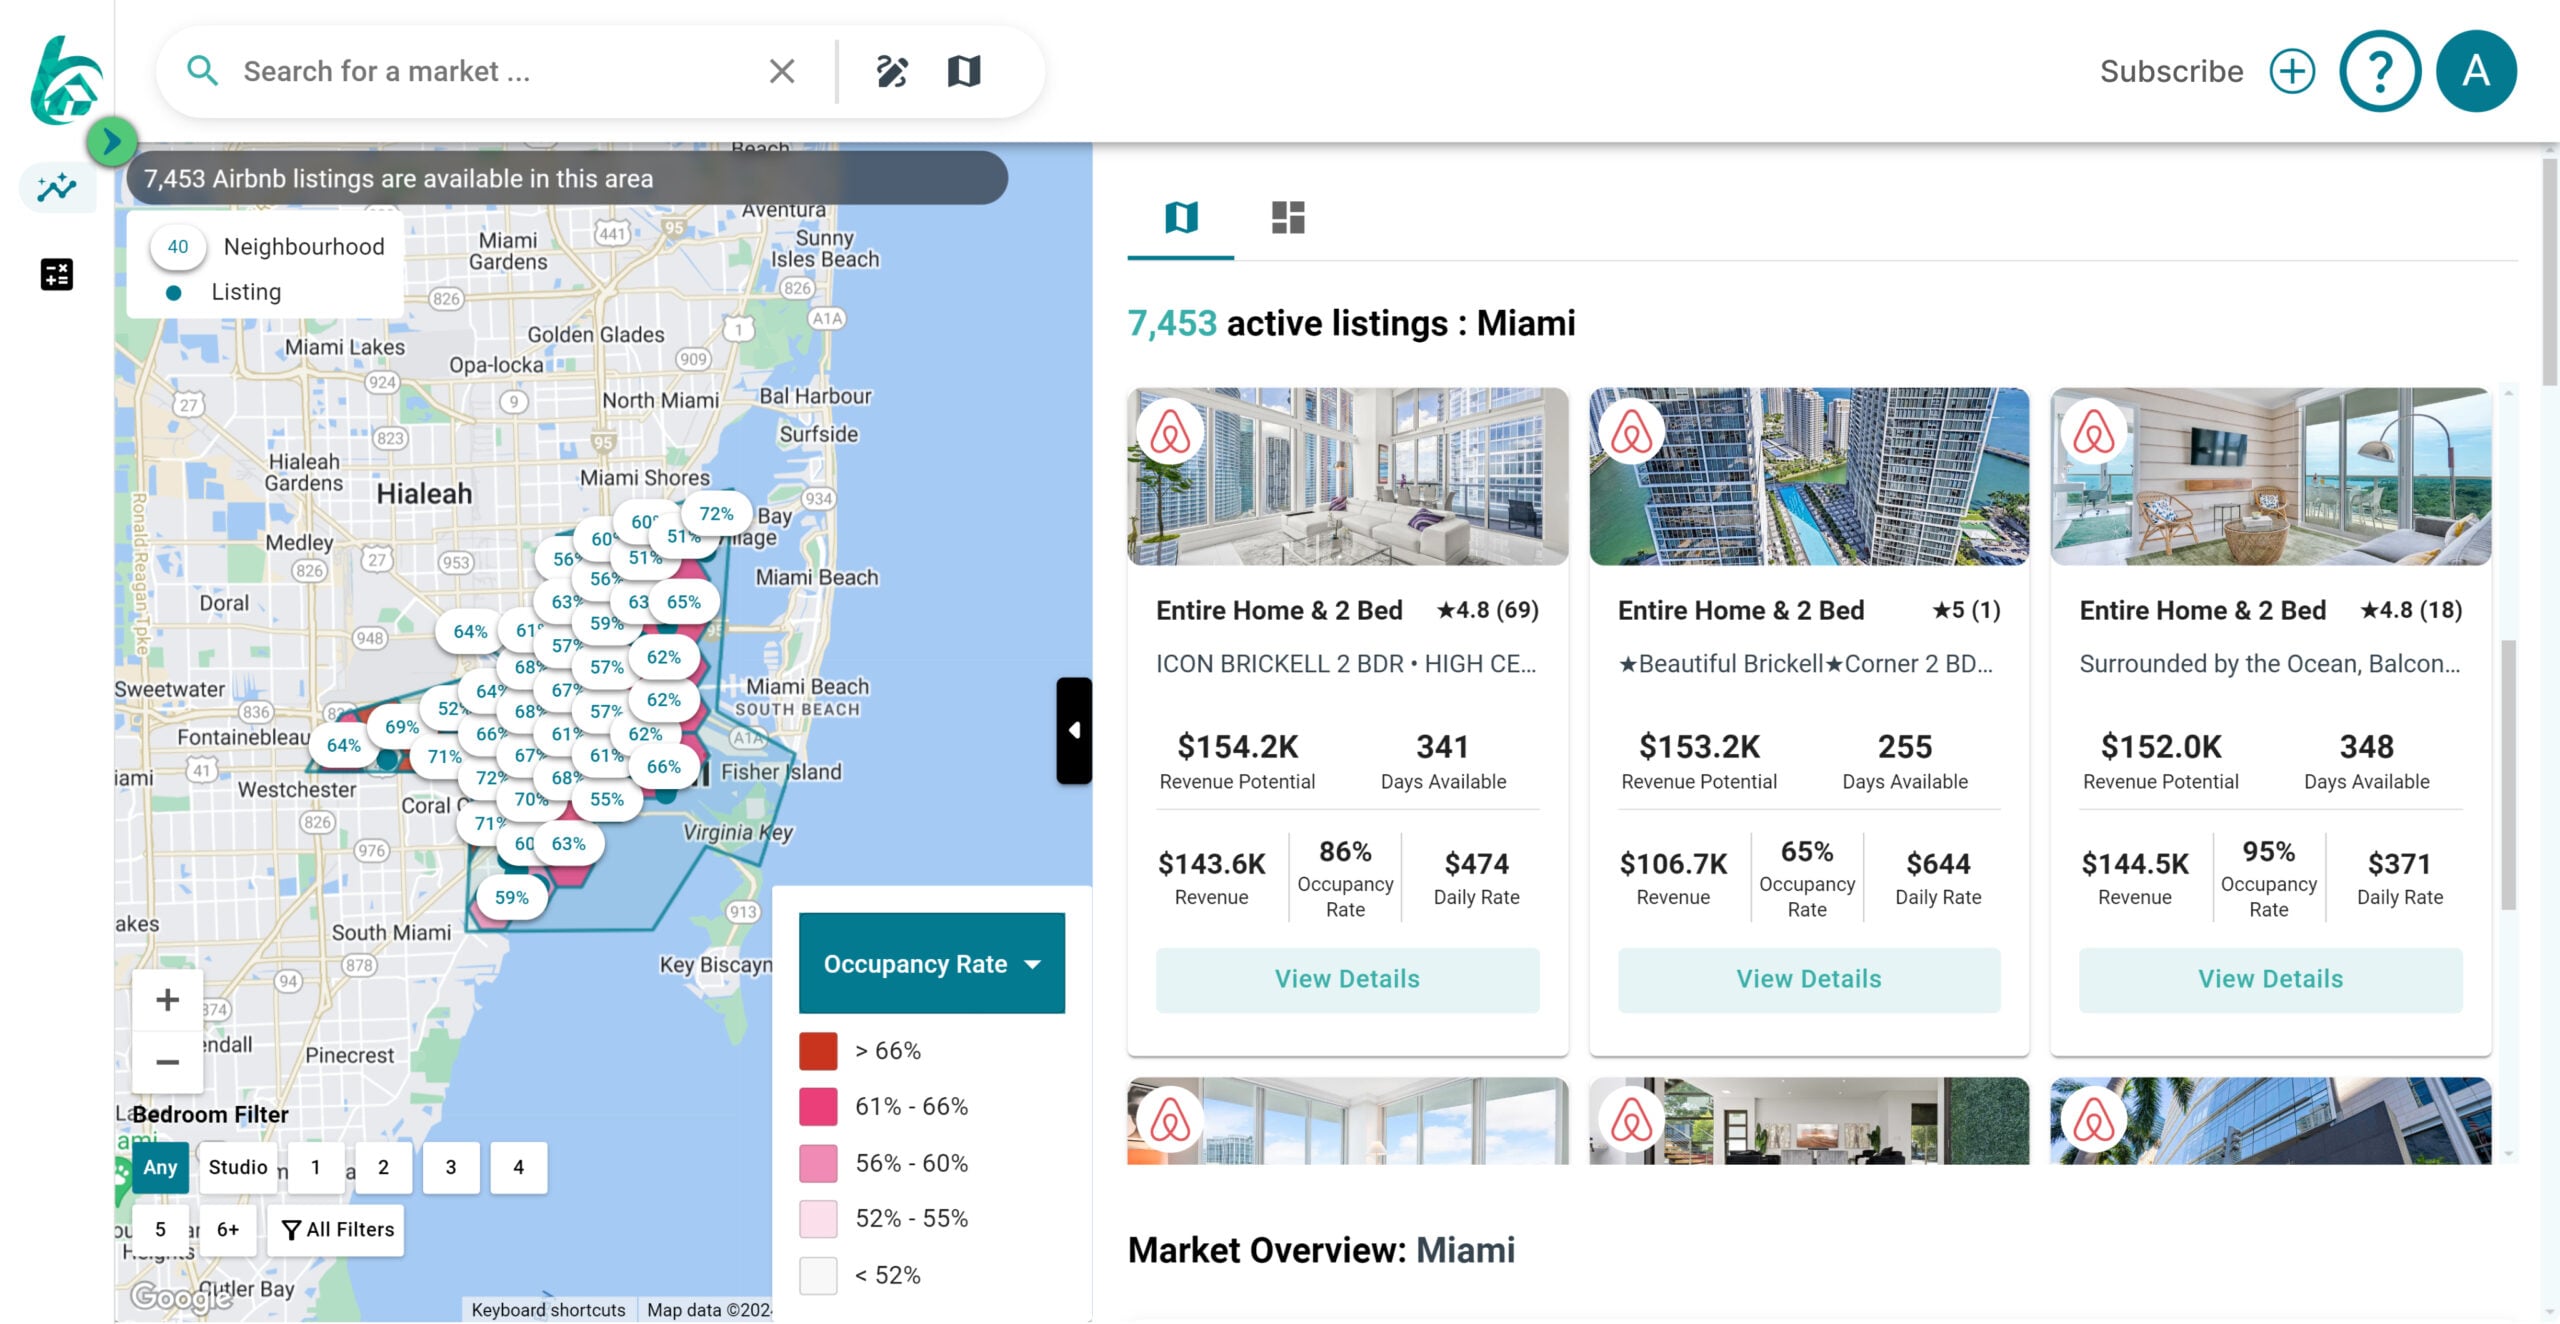
Occupancy rate is the primary indicator of demand health in specific neighborhoods, serving as a more reliable metric than gross revenue for gauging market stability. While Average Daily Rate (ADR) reflects pricing power, occupancy reveals whether a property can consistently fill its calendar. A high ADR with low occupancy often signals pricing misalignment or seasonal fragility, whereas stable occupancy provides the predictable cash flow necessary to cover fixed costs and mortgage obligations.
Interpreting these fluctuations requires context. Short-term rental markets are highly localized; a city-wide average often masks significant variance between neighborhoods. For investors, understanding the baseline occupancy for a specific asset class—such as a studio in a business district versus a three-bedroom home in a leisure zone—is essential for accurate ROI modeling. Data from platforms like AirDNA and Airbtics, which track millions of listings, show that occupancy trends can diverge sharply even within the same metropolitan area based on local regulations and event calendars.
The table below compares occupancy performance and pricing across three distinct market types to illustrate these variances. These figures represent normalized annual averages derived from recent STR data analytics, highlighting how different market dynamics affect daily performance.
| Market Type | Avg. Occupancy | Avg. Daily Rate | RevPAR |
|---|---|---|---|
| Urban Business (NYC) | 68% | $215 | $146 |
| Leisure Resort (Orlando) | 74% | $185 | $137 |
| Midwest Hub (Austin) | 71% | $160 | $114 |
Calculating Short-Term Rental Investment ROI
Gross revenue is a vanity metric. A realistic ROI model for 2026 requires dissecting net cash flow, accounting for the aggressive cost structures that define modern short-term rentals. The difference between a profitable asset and a liability often lies in the precision of the expense projections. Use the following methodology to build a model that reflects actual market conditions.
Begin with conservative occupancy estimates based on 12-month trailing data. Do not use peak-season rates for annual projections. Average the daily rate (ADR) across all 12 months, then apply a realistic occupancy percentage (typically 55-75% for secondary markets) to determine the annual gross revenue. This figure must be static enough to withstand seasonal dips.
Subtract all variable costs directly tied to the booking. Airbnb’s host service fee (typically 3%) and credit card processing fees (2-3%) are mandatory. If you use a property management company, add their percentage (15-25%). These fees erode margins quickly; failing to include them results in an artificially inflated ROI that does not reflect the cash actually received.

Fixed costs are the silent killers of STR profitability. Include property taxes, insurance (specifically STR-compliant policies), HOA fees, and utilities. For 2026, assume utility costs will remain volatile; budget 5-10% above current averages. If the property is unfurnished, include furniture depreciation as a line item, as replacement costs are a real operational burden.
Maintenance is not optional; it is a cost of doing business. Budget 1-2% of the property value annually for repairs. Add cleaning fees per turnover (typically $100-$150) multiplied by the estimated number of stays. High turnover rates increase these costs significantly. Use a tool like AirROI to benchmark these local operational costs against similar properties in your target market.
Subtract total expenses from gross revenue to find the Net Operating Income (NOI). To calculate ROI, divide the NOI by the total cash invested (down payment, closing costs, renovations, and furnishing). This percentage represents the true annual return on your capital. Compare this against risk-free rates (like Treasury yields) to determine if the STR investment justifies the operational risk.
Evaluating Vacation Rental Analytics Tools
Selecting the right data provider requires matching your analytical needs with the platform’s data depth, API accessibility, and historical accuracy. For 2026 market analysis, relying on a single source introduces significant risk; cross-referencing data from AirDNA, Airbtics, and Rabbu ensures your ROI projections are grounded in verified metrics rather than algorithmic estimates.
AirDNA remains the industry standard for broad market coverage, tracking over 10 million listings across 120,000 markets. Its extensive user base of 1.3 million provides a robust feedback loop for data accuracy, making it ideal for macro-level trend analysis. Airbtics distinguishes itself with a three-year historical dataset updated daily, offering granular insights into seasonal fluctuations that newer platforms often lack. Rabbu serves as a cost-effective alternative for U.S.-specific markets, providing real-time occupancy rates and revenue projections without the premium price tag of enterprise-grade tools.
When integrating data into your financial models, API access is a critical differentiator. Automated data feeds reduce manual entry errors and allow for dynamic scenario planning. The table below outlines the core capabilities of these primary providers to help you evaluate their fit for your specific operational scale.
| Provider | Market Coverage | Historical Depth | API Access |
|---|---|---|---|
| AirDNA | Global (120K+ markets) | Long-term trends | Enterprise tier |
| Airbtics | Global | 3 years (daily updates) | Available |
| Rabbu | U.S. markets | Real-time | Limited/Basic |
Using data to mitigate investment risk
Airbnb market data analysis transforms speculation into a quantifiable process. By relying on official sources like Inside Airbnb, investors can verify supply levels and occupancy trends before committing capital. This approach prevents overpaying in saturated markets and highlights undervalued locations with genuine growth potential.
Download quarterly data from Inside Airbnb to calculate the ratio of active listings to housing units. High saturation correlates with lower nightly rates and increased competition. Identify neighborhoods where supply growth outpaces demand to avoid overbought areas.
Review historical occupancy rates rather than relying on projected averages. Look for consistent performance across seasons, not just peak summer months. Properties with stable year-round demand offer more predictable cash flow and lower risk during economic downturns.
Subtract all operating costs from gross revenue to determine net operating income. Include property management fees, cleaning, maintenance, and platform commissions. Use conservative occupancy estimates to stress-test your investment against market fluctuations.
Research local short-term rental regulations before purchasing. Cities like New York and Barcelona have strict bans or caps on Airbnb listings. Ensure the target property is legally compliant to avoid fines or forced removal from the platform.
-
Verify listing density via Inside Airbnb data
-
Confirm local STR regulations and permit requirements
-
Calculate net ROI using conservative occupancy rates
-
Assess seasonal demand stability over 12 months
Data-driven due diligence reduces the likelihood of financial loss. By systematically analyzing supply, occupancy, and regulations, investors can identify high-potential markets with confidence.
No comments yet. Be the first to share your thoughts!