
Enter property details and location
An Airbnb revenue calculator is only as good as the data you feed it. Most tools use the address to pull comparable rental data, so precision here matters more than anywhere else. If the location is even slightly off, the algorithm pulls from the wrong neighborhood, and your projections become guesswork.
Start by entering the exact street address. This anchors the tool to real short-term rental (STR) comps in that specific micro-market. Next, define the physical footprint of the unit. Be specific about the number of bedrooms and bathrooms. A two-bedroom unit with a shared half-bath is a different product—and commands a different price—than one with a private ensuite.
Don't skip the amenities section. While basic essentials like Wi-Fi and kitchen access are assumed, unique features drive higher average daily rates (ADR). Enter details like a hot tub, dedicated workspace, or pet-friendly policy. These inputs allow tools like AirDNA or Rabbu to match your property against the most relevant competitors, ensuring the occupancy and revenue estimates reflect actual market demand for your specific setup.
Type the full street address into the calculator’s primary field. This allows the software to identify the immediate neighborhood and pull historical performance data from nearby listings. Avoid using general zip codes or city names, as rental dynamics can vary significantly block by block.

Select the exact count of sleeping spaces and bathroom facilities. If you have a studio or loft, select "0 bedrooms" or "studio" rather than forcing a "1 bedroom" classification, as guests often filter searches by exact bed counts. Accurate room counts ensure the tool compares your unit to properties of similar size and appeal.
Check off features that differentiate your property, such as a hot tub, pool, dedicated workspace, or pet-friendly policy. These amenities directly influence the Average Daily Rate (ADR). Including them helps the calculator adjust revenue projections upward if those features are in high demand in your specific market.
Adjust occupancy and pricing assumptions
Most Airbnb revenue calculators default to optimistic market averages. These generic figures often overestimate income by ignoring seasonal dips and local competition. To get an accurate ROI, you must replace these defaults with hyper-local data.
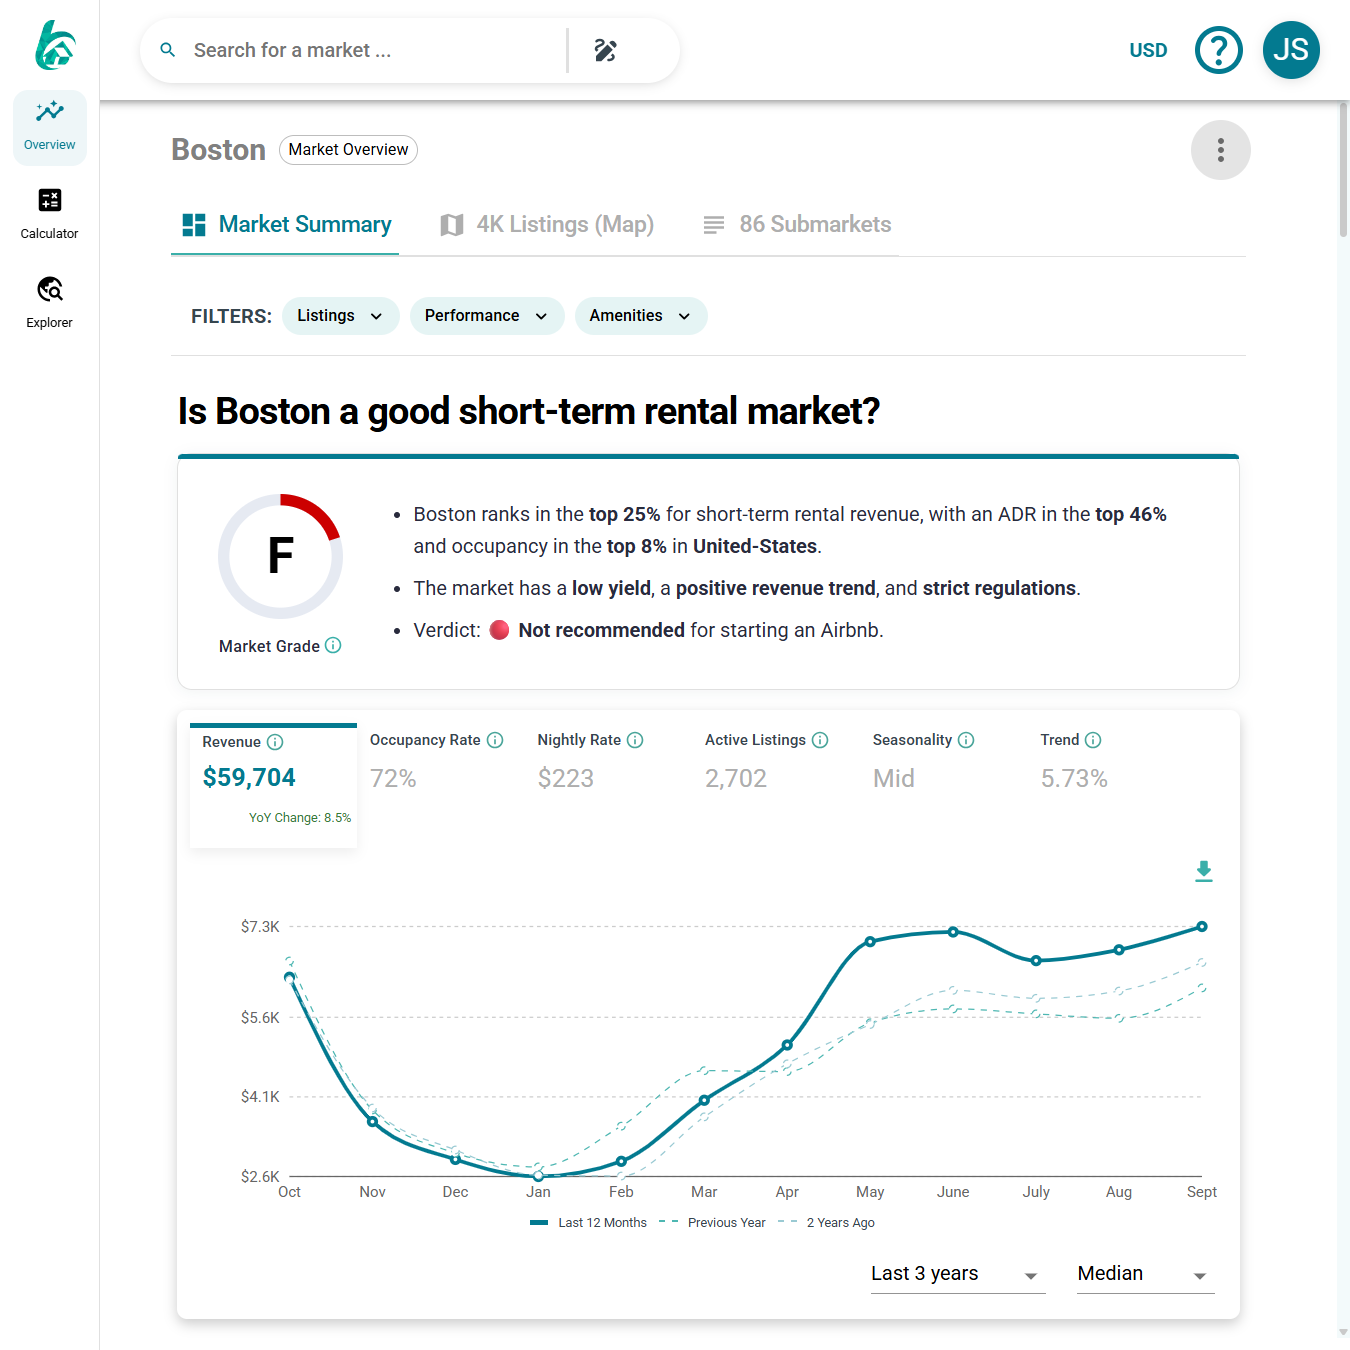
Start by pulling the Average Daily Rate (ADR) and occupancy rate for your specific neighborhood. Tools like AirDNA or Airbnb’s own search filters provide this data. If you are using a free calculator, look for fields labeled "Average Daily Rate" and "Occupancy Percentage."
Set conservative occupancy
Default occupancy rates often sit between 70-80%. This is rarely realistic for a new listing. Start with a conservative estimate, such as 50-60%, especially if you are in a seasonal market or a newly saturated area.
Adjust the average daily rate
Check comparable listings in your immediate vicinity. If your competitors are priced lower, your ADR assumption should reflect that. Do not assume you can command a premium immediately without established reviews.
Compare scenarios side-by-side
Use the table below to see how small changes in occupancy drastically impact your annual revenue. This comparison highlights why conservative assumptions are safer for financial planning.
| Scenario | Occupancy | ADR ($) | Annual Revenue |
|---|---|---|---|
| Conservative | 50% | 150 | $27,375 |
| Moderate | 65% | 150 | $35,588 |
| Aggressive | 75% | 150 | $40,950 |
Update your calculator inputs
Enter these adjusted figures into your Airbnb revenue calculator. Most platforms allow you to override the default values manually. Ensure you are entering the nightly rate, not the monthly rent, and the percentage, not the number of booked nights.
Recalculate your ROI
After updating the inputs, hit calculate again. Compare the new net operating income against your initial investment. If the ROI still looks strong under conservative assumptions, your investment is likely safer than one based on aggressive, ideal-world scenarios.
Use platforms like AirDNA or Airbnb search to find the average daily rate and occupancy for comparable listings in your target neighborhood. Avoid using city-wide averages.

Reduce the default occupancy rate to 50-60%. This accounts for seasonal fluctuations and the time it takes to build reviews. Use this lower figure as your baseline for safety.
Enter your local ADR and conservative occupancy into the calculator. Review the updated annual revenue and compare it to your actual investment costs to determine true ROI.
Input operating expenses and fees
Listing a property on Airbnb is not a passive income stream; it is an active business with recurring costs. To calculate true net profit, you must subtract every expense from your gross revenue. Ignoring these costs leads to inflated ROI figures that rarely match reality.
Start by entering platform commissions. Airbnb and Vrbo charge service fees to both guests and hosts. Host fees typically range from 3% to 5% of the booking total, depending on your payout structure. These fees are non-negotiable and directly reduce your take-home pay.
Next, account for turnover and cleaning. If you hire a cleaning service, this is a fixed cost per stay. If you clean the unit yourself, still assign a market rate to your time. Include laundry supplies, toiletries, and restocking costs. These small line items add up quickly over multiple bookings.
Don’t forget utilities and maintenance. Short-term rentals consume significantly more water, electricity, and internet than long-term leases. Budget 10% to 15% of gross revenue for these operational costs. Also set aside 5% to 10% for maintenance, including repairs, furniture replacement, and professional photography updates.
Review net operating income and cap rate
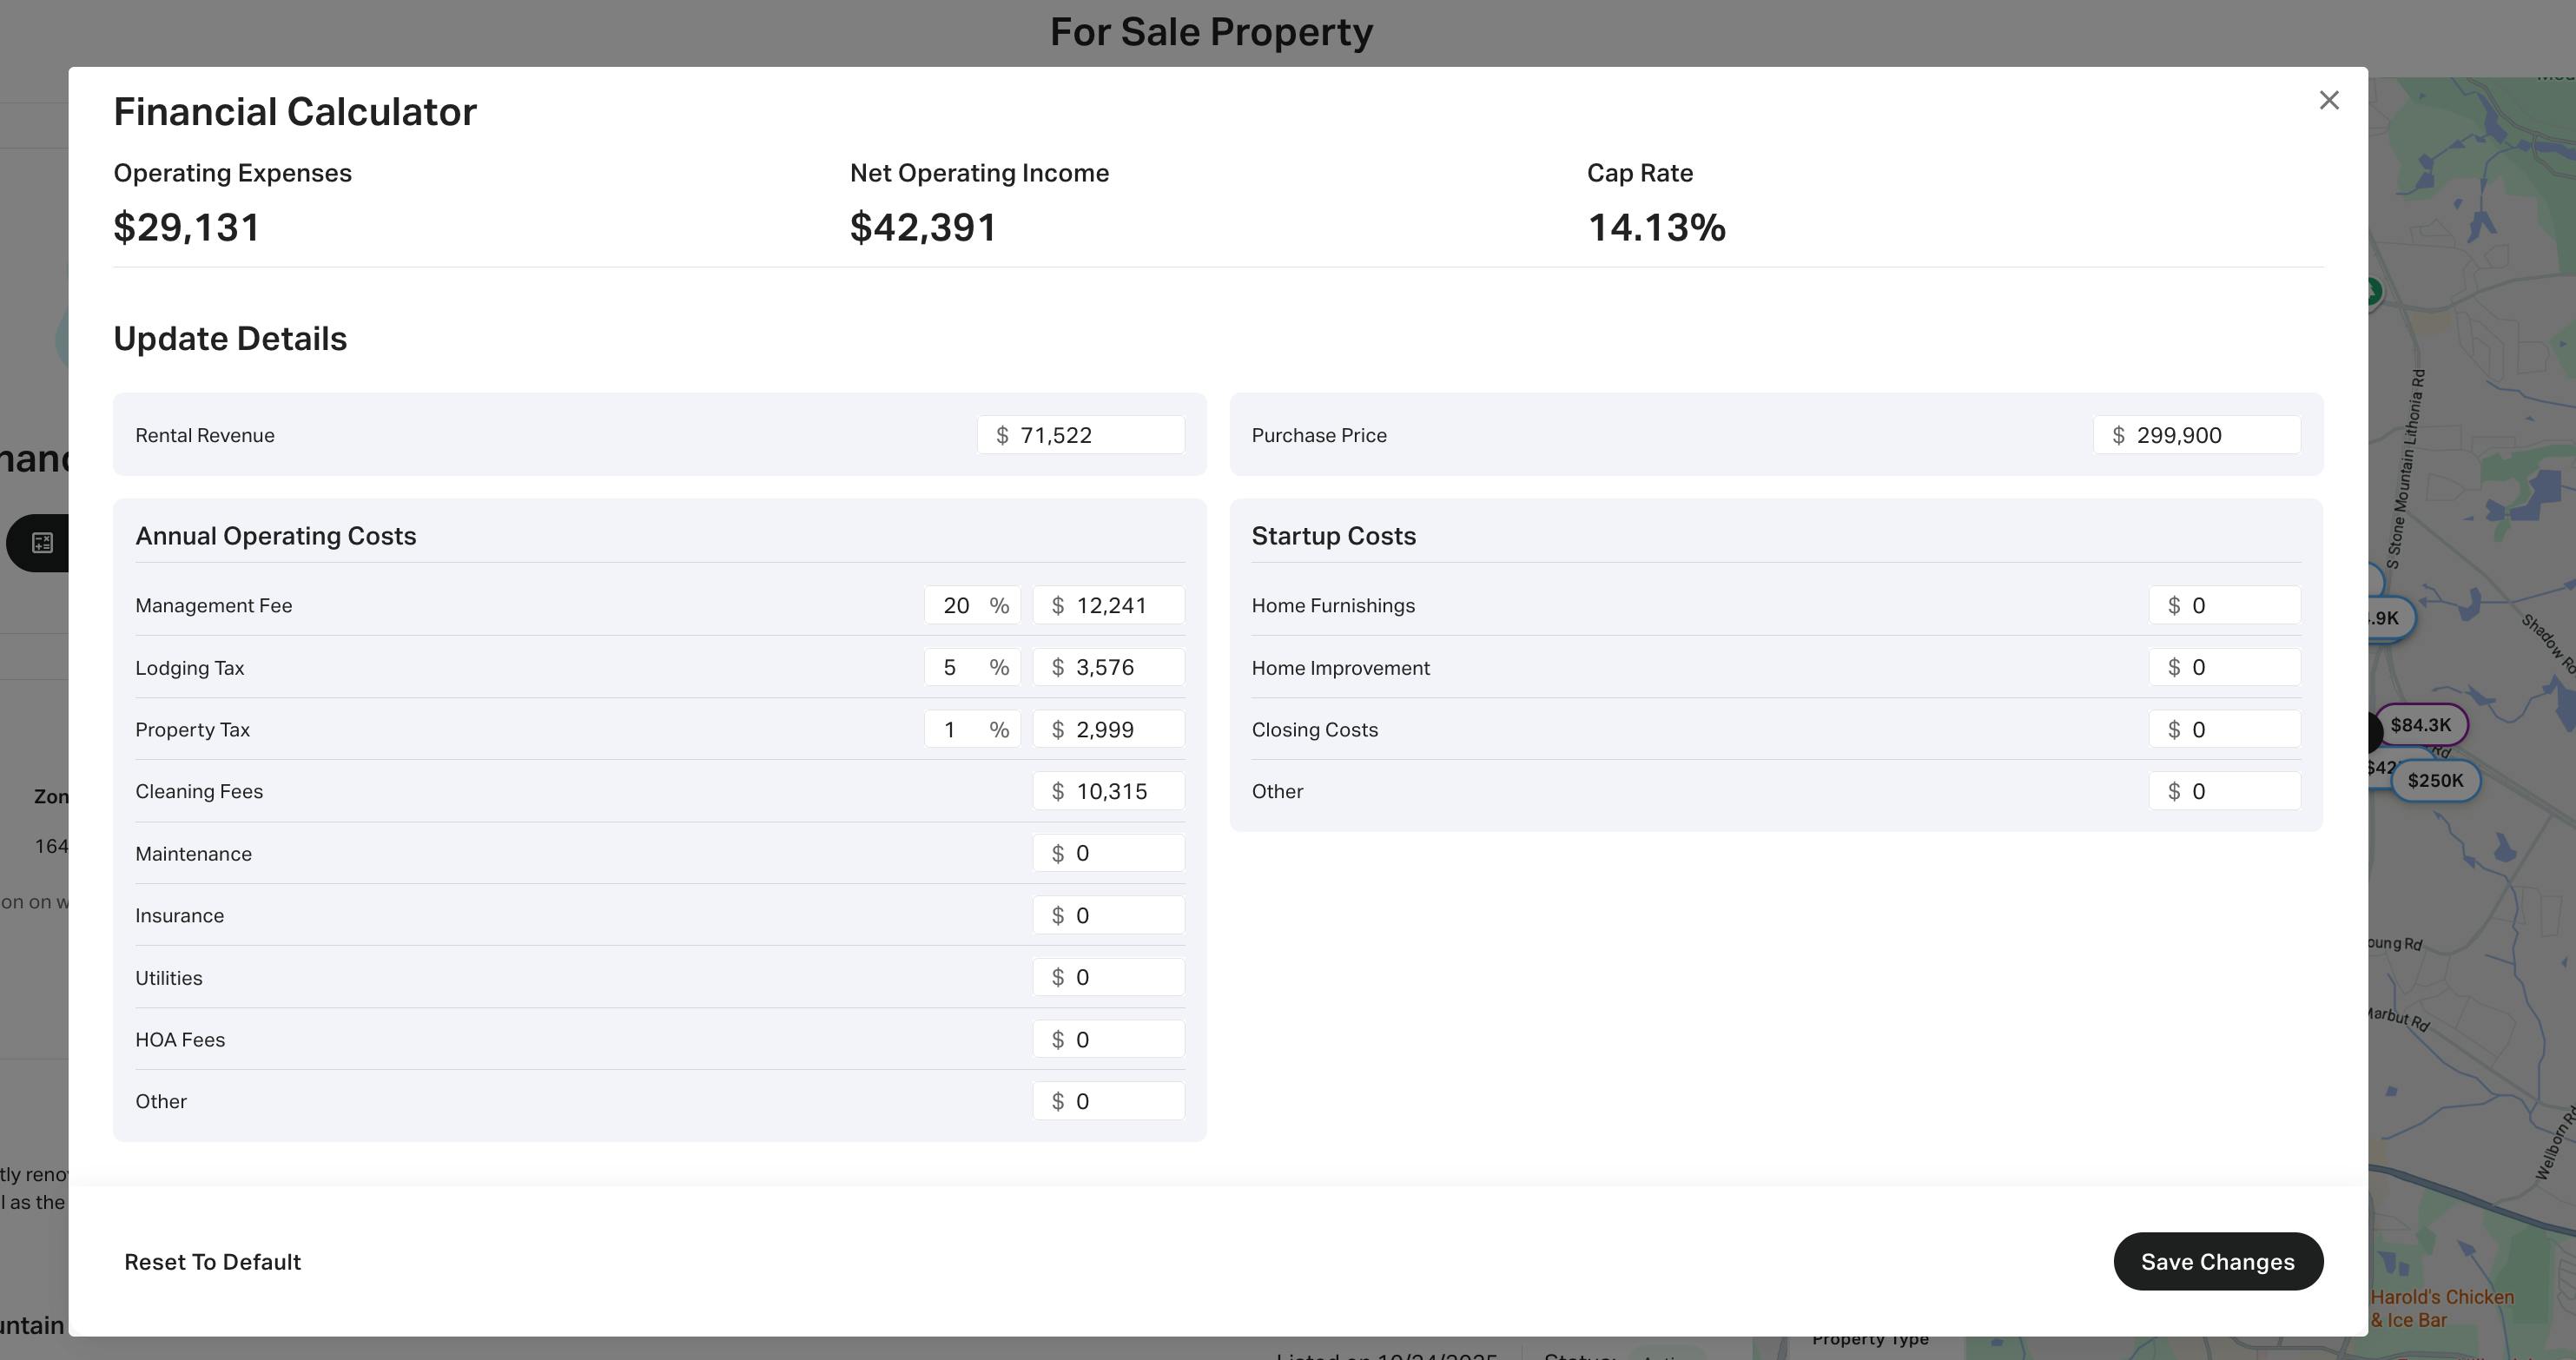
The calculator output gives you two distinct numbers: Net Operating Income (NOI) and the Capitalization Rate (Cap Rate). Treat these as your primary filters for deciding whether to proceed. One tells you the raw cash flow potential, while the other measures the efficiency of your investment relative to the property price.
Calculate your Net Operating Income
NOI is the money left over after you subtract all annual operating expenses from your gross rental income. It excludes mortgage payments, taxes, and insurance, focusing strictly on the property’s performance. A positive NOI indicates the property generates more revenue than it costs to run, which is the baseline requirement for any profitable short-term rental.
When reviewing this figure, compare it against your personal cash-on-cash return expectations. If the projected NOI doesn’t cover your desired monthly profit or reserve fund contributions, the deal likely fails your financial threshold, regardless of how high the revenue appears.
Interpret the Capitalization Rate
The Cap Rate is a snapshot of the property’s unleveraged return, calculated by dividing the NOI by the purchase price. It allows you to compare this Airbnb opportunity against other investment vehicles, such as multi-family apartments or REITs. A higher Cap Rate generally signals higher potential return, though often with higher risk or lower appreciation potential.
Most markets have a standard Cap Rate range. If the calculator returns a rate significantly below the local average, the property may be overpriced or underperforming. Use this metric to benchmark the deal against comparable short-term rental properties in the same area to ensure you aren’t overpaying for the revenue stream.
Common Airbnb Revenue Calculator Errors to Avoid
Even the most sophisticated Airbnb revenue calculator can produce misleading projections if the input data is flawed. Small oversights in how you adjust variables often lead to significant gaps between projected and actual cash flow. To protect your ROI, you must audit your inputs against local realities rather than relying on default settings.
Ignoring Local Seasonality
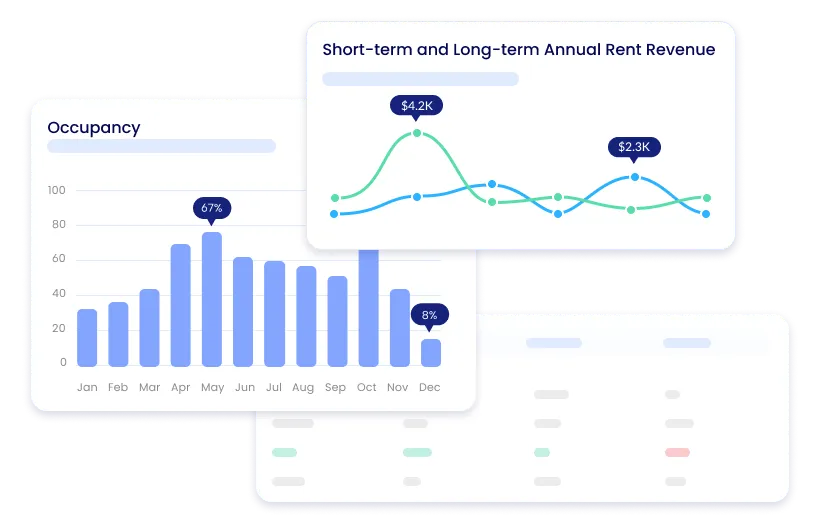
Most basic calculators apply a flat occupancy rate across all twelve months, but short-term rental demand fluctuates dramatically by season. A property in a ski town will see winter peaks that a beach house misses, while coastal markets often suffer in shoulder seasons. If your calculator allows it, use the monthly breakdown feature to reflect these shifts. Relying on a single annual average masks the volatility that will impact your month-to-month liquidity.
Underestimating Vacancy and Turnover
Vacancy rates are not just about unbooked nights; they include the days required for cleaning, maintenance, and repainting between guests. Many hosts forget to account for "buffer days" where the unit is unavailable due to repairs. Additionally, turnover costs—cleaning fees, laundry, and restocking supplies—eat directly into net income. Ensure your model includes a realistic vacancy percentage that accounts for both gaps between bookings and operational downtime.
Overlooking Regulatory and Platform Fees
Projected profit often collapses when local compliance costs are ignored. Many cities impose short-term rental taxes, licensing fees, or mandatory registration costs that vary by zip code. Also, platform fees charged by Airbnb and cleaning service markups can range from 15% to 25% of total revenue. If your calculator defaults to national averages, it likely misses these hyper-local deductions. Always verify your local occupancy and fee structures before finalizing your investment thesis.
Frequently asked questions about Airbnb calculators
How accurate are Airbnb revenue calculator estimates?
Calculators provide projections, not guarantees. Platforms like Airbnb and PriceLabs build these estimates using historical booking data from your specific area, property type, and space configuration (src-serp-4, src-serp-7). Treat these numbers as a baseline for potential income, adjusted for seasonality and local demand fluctuations.
Why do different calculators give different numbers?
Tools vary in their data sources and algorithms. Some rely heavily on broad market trends, while others use granular, property-specific booking history. To get the most reliable ROI estimate, compare results from at least two reputable sources and look for the range rather than a single fixed figure.
How can I validate a calculator’s projection against real performance?
Track your actual occupancy and revenue for the first few months after listing. Compare this real-world data against the calculator’s initial estimate. If the variance is high, adjust your inputs—such as nightly rates or minimum stay requirements—to reflect your property’s true market position.
No comments yet. Be the first to share your thoughts!