
Get airbnb market data right
Before you analyze revenue potential, you must ensure your data sources are accurate and comprehensive. Airbnb market data is only as useful as the inputs feeding your models. Relying on incomplete datasets or unverified third-party estimates leads to flawed occupancy forecasts and missed revenue opportunities.
Start by selecting a dedicated short-term rental analytics platform. Tools like AirDNA or AirROI aggregate data from millions of listings across thousands of markets. These platforms provide the granular metrics you need, including average daily rates (ADR), occupancy percentages, and revenue benchmarks. Verify that the platform covers your specific target location and includes recent data trends.
Cross-reference your primary source with official or local regulatory data where available. Many cities publish short-term rental permit numbers or tax collection data that can validate platform estimates. This step helps you identify if the market is saturated or if regulatory constraints might limit your supply. Combining commercial analytics with public records gives you a realistic view of the competitive landscape.
Finally, define your specific metrics before diving into the numbers. Are you looking for seasonal trends, competitor performance, or amenity value? Setting these parameters early prevents analysis paralysis. Focus on the key performance indicators that directly impact your pricing strategy and occupancy goals, rather than getting lost in irrelevant global statistics.
How to use Airbnb market data to maximize ROI
Vacation rental analytics turn guesswork into a predictable operating system. By tracking occupancy rates, daily rates, and competitor performance in your specific zip code, you can adjust pricing, amenities, and marketing to maximize revenue. The following steps walk you through the practical process of gathering, analyzing, and applying this data.
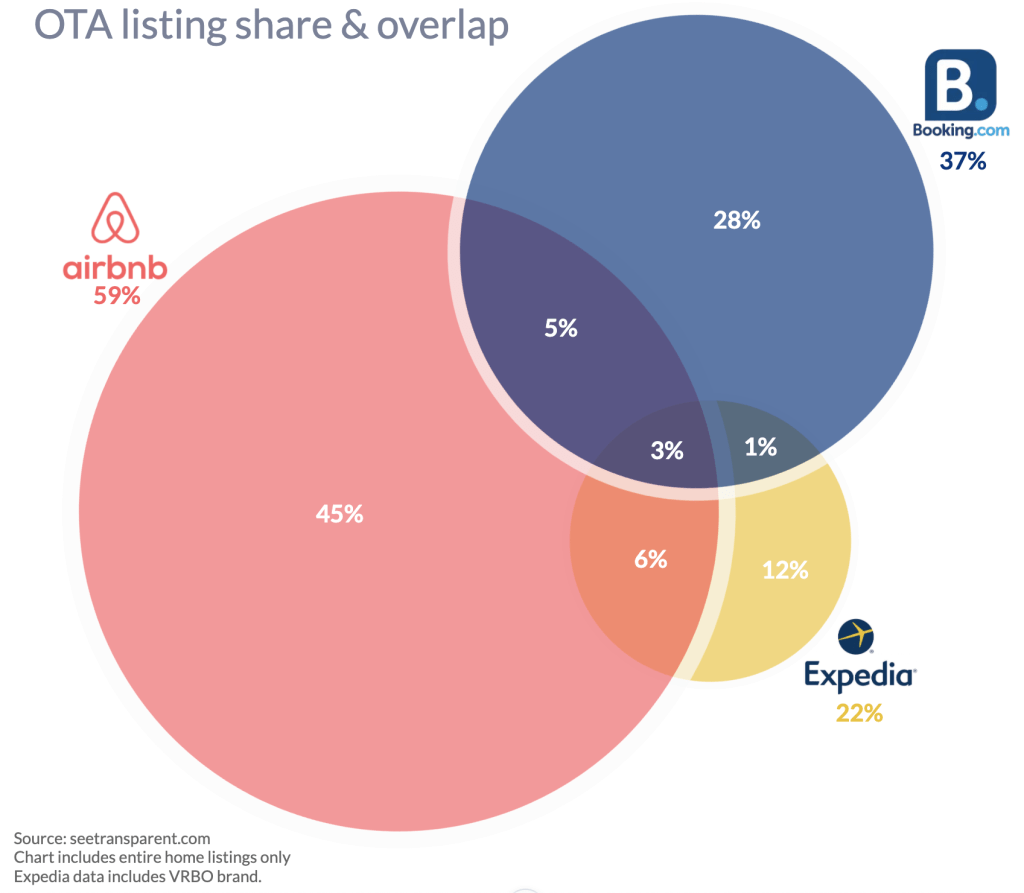
Start by subscribing to a dedicated short-term rental analytics tool. Platforms like AirDNA and AirROI track millions of listings across 120,000+ markets, providing the depth of data needed for serious ROI analysis. Free tools often lack historical depth or granular neighborhood data. Choose a platform that offers both Airbnb and Vrbo data, as guest behavior and pricing strategies often differ between the two major booking sites.
Narrow your focus to a specific neighborhood, zip code, or even a street. Broad city-level data can mask significant local variations in demand. Enter your specific location into the platform to generate a market overview. Look for the "Market Overview" or "Neighborhood Insights" tab to see how your target area compares to the broader city or region. This baseline is essential for identifying whether your market is oversaturated or underperforming.
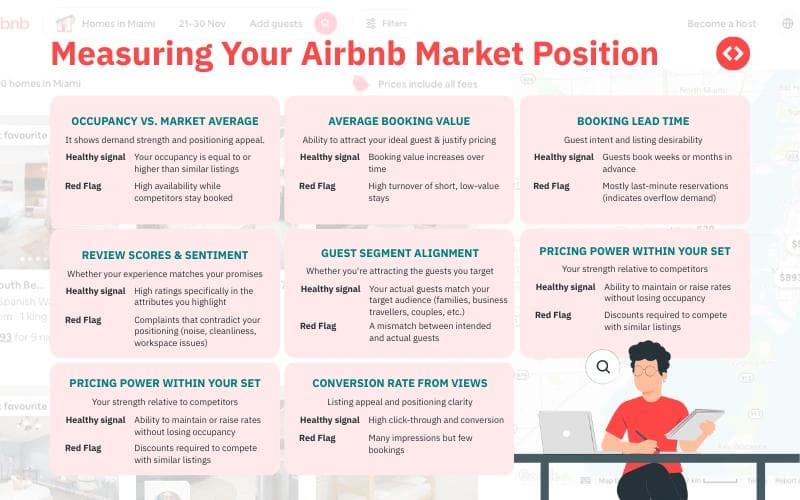
Identify your top five to ten direct competitors—properties with similar bedroom counts, amenities, and location quality. Analyze their average daily rate (ADR), occupancy rates, and revenue per available room (RevPAR). Note how they adjust prices for weekends, holidays, and local events. This comparison reveals the price ceiling and floor for your area, helping you position your property competitively without leaving money on the table.
Use the platform’s "Amenity Value" or "Feature Impact" tools to see which features drive higher bookings and rates in your market. Common high-value amenities include high-speed Wi-Fi, dedicated workspaces, parking, and pet-friendly policies. If your competitors offer a hot tub or smart lock and you do not, calculate the potential revenue increase against the installation cost. Addressing these gaps often yields a faster ROI than minor cosmetic updates.
Translate your data insights into actionable pricing rules. Most analytics platforms integrate with dynamic pricing tools that automatically adjust your nightly rates based on real-time demand, local events, and competitor pricing. Set your minimum stay requirements and booking windows based on historical occupancy patterns. For example, if data shows a 20% drop in demand during mid-week, consider offering a discount to attract remote workers or extend your minimum stay requirement to reduce turnover costs.
Fix common mistakes in vacation rental analytics
Even with reliable data from platforms like AirDNA or AirROI, misinterpreting market signals can drain your profitability. Most hosts fall into predictable traps that ignore local realities or overcommit to amenities that don’t drive bookings.
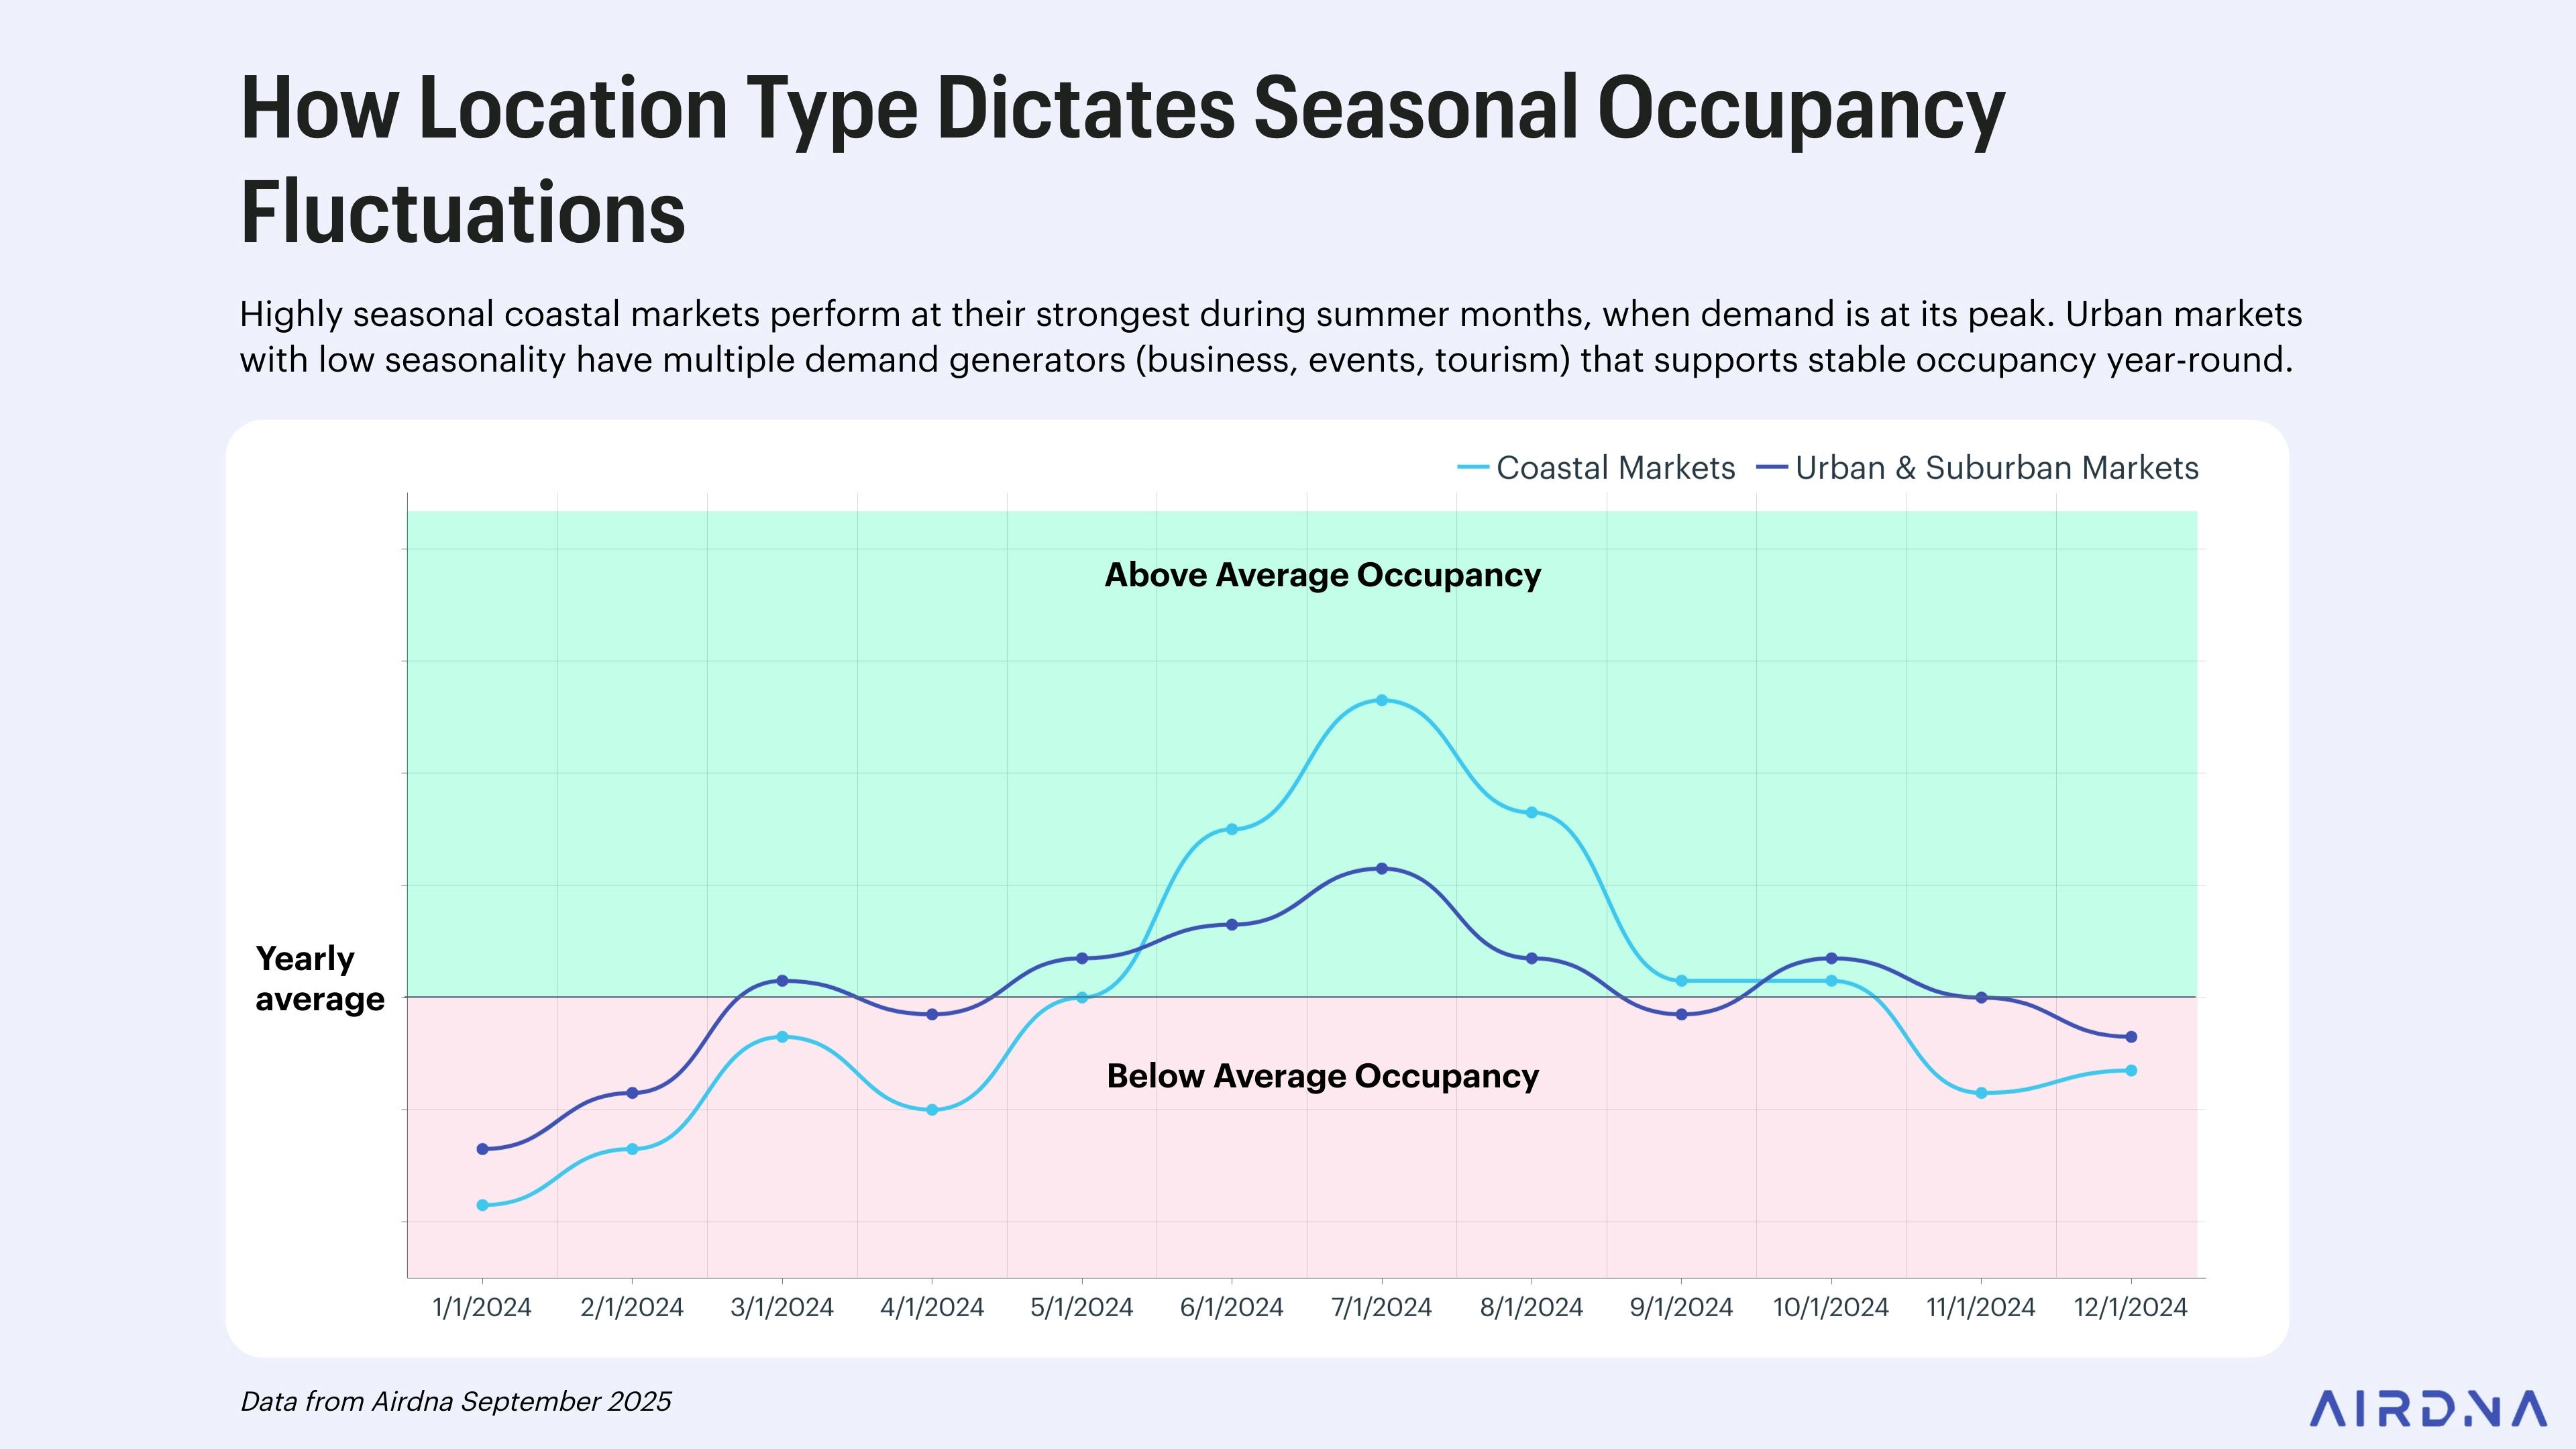
Ignoring local seasonality and events
Data from broad markets often masks hyper-local spikes. A city’s average occupancy might look stable, but your neighborhood could be empty during non-event weeks. Always filter analytics by specific zip codes or neighborhoods. Cross-reference this with local event calendars to identify true high-demand periods. Relying on city-wide averages leads to underpricing during local festivals and overpricing during quiet weeks.
Overestimating the value of niche amenities
Adding a hot tub or game room is expensive. Many hosts assume these features automatically boost revenue, but data often shows diminishing returns unless the market specifically demands them. Check the "value of amenities" reports in your analytics tool. If only 5% of top-performing listings in your area have a pool, investing $20,000 in one is likely a bad ROI. Focus on amenities that appear in the top 20% of your competitors’ listings.
Neglecting competitor supply changes
Market data is a snapshot, not a forecast. If five new luxury condos open in your building next month, your current occupancy projections will fail. You must monitor new supply listings regularly. If new inventory is entering the market, you may need to adjust your pricing strategy or improve your listing quality to maintain share. Static data becomes obsolete the moment a new competitor lists.
No comments yet. Be the first to share your thoughts!