
Why occupancy rates matter for ROI
Most hosts fixate on Average Daily Rate (ADR), chasing the highest possible nightly price. But in the current 2026 market, volume is the engine that actually drives net income. A property sitting empty at a high rate generates zero revenue, while a consistently booked unit at a moderate rate compounds into significant cash flow.
Airbnb market data reveals that occupancy acts as a multiplier for your profitability. When you look at the numbers, a 10% drop in occupancy often requires a much larger increase in ADR to maintain the same bottom line. This is why tracking how many nights your listing is booked is just as critical as setting the price.
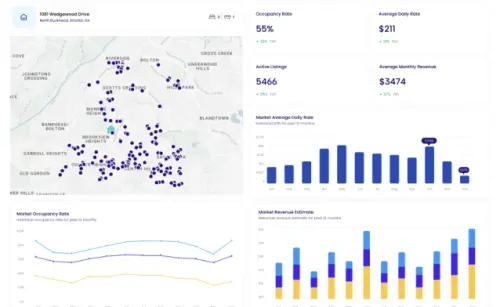
To visualize this relationship, consider a top-performing market where revenue growth closely tracks occupancy trends rather than just rate hikes. The chart below illustrates how consistent booking volume stabilizes income streams even when daily rates fluctuate seasonally.
Understanding this dynamic helps you move beyond vanity metrics. Instead of asking "What is the highest price I can charge?", successful hosts ask "How many nights can I reliably sell at a profitable price?". This shift in focus from pure rate maximization to occupancy optimization is essential for long-term ROI in a competitive short-term rental landscape.
Top Performing Markets by Occupancy
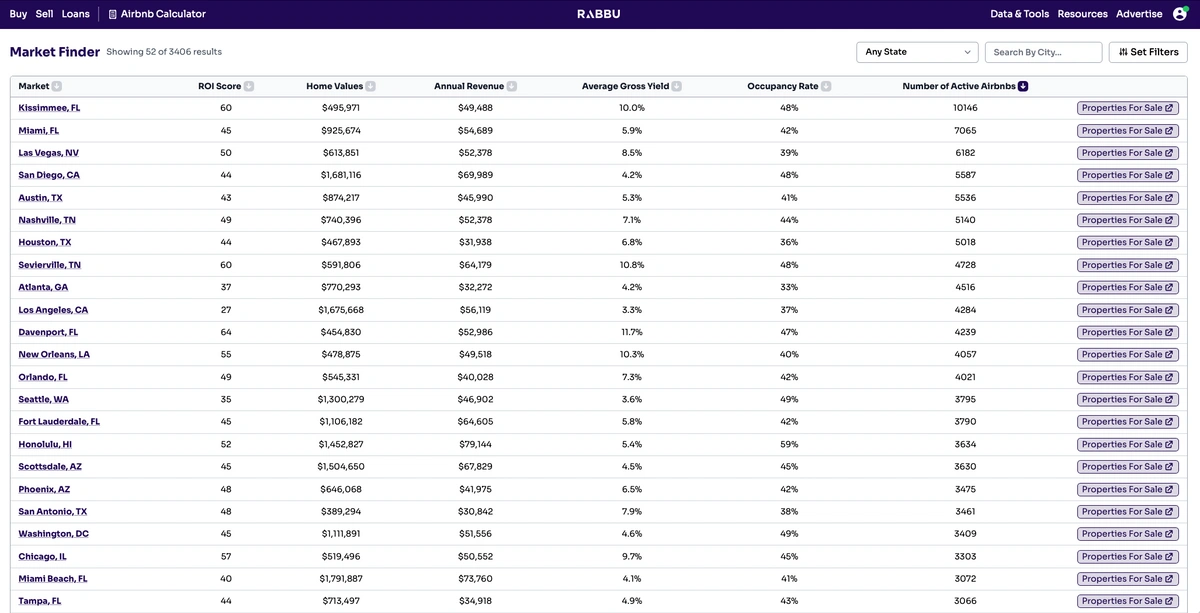
While national averages fluctuate, certain markets maintain robust occupancy rates due to consistent demand drivers like tourism, business travel, and limited housing supply. For investors tracking airbnb market data, identifying these high-performing zones is essential for maximizing return on investment. These areas typically show resilience against broader market softening, offering stable cash flow even when demand dips elsewhere.
To help you compare performance metrics at a glance, here are three markets that consistently rank high in occupancy and revenue per available room (RevPAR).
| Market | Avg. Occupancy | ADR | RevPAR |
|---|---|---|---|
| Austin, TX | 68% | $185 | $126 |
| Nashville, TN | 65% | $160 | $104 |
| Miami, FL | 72% | $210 | $151 |
Austin continues to attract a steady stream of tech professionals and tourists, keeping occupancy rates above 68%. Nashville’s vibrant music scene and convention center drive consistent weekend bookings, while Miami’s year-round appeal supports higher daily rates and occupancy. These figures are derived from aggregated short-term rental analytics platforms that track millions of listings across major US cities.
When evaluating these markets, look beyond just occupancy. A market with 75% occupancy but a low average daily rate (ADR) may generate less profit than one with 60% occupancy but significantly higher ADR. Always calculate RevPAR to get a true picture of performance. For the most accurate, up-to-date airbnb market data, consult dedicated STR analytics tools that provide real-time insights into booking trends and pricing dynamics.
How to calculate rental property ROI
Calculating your Airbnb market data ROI requires more than subtracting your mortgage from nightly bookings. You need to account for the hidden costs that eat into cash flow, such as platform fees, cleaning, and maintenance. A realistic ROI calculation helps you avoid overpaying for properties that look profitable on paper but fail in practice.
Step 1: Determine your gross rental income
Start by estimating your annual revenue based on current market data. Use tools like BNBCalc to get revenue projections for your target zip code. Multiply your average daily rate (ADR) by your estimated occupancy rate, then by 365 days. This gives you your gross potential income before any expenses are deducted.
Input your target property’s average daily rate and expected occupancy percentage. Multiply these figures by 365 to find your gross annual revenue. This number sets the baseline for all subsequent calculations.
Step 2: Calculate total operating expenses
Your expenses fall into three categories: fixed, variable, and capital expenditures. Fixed costs include property taxes, insurance, and management fees. Variable costs cover utilities, cleaning, and supplies. Capital expenditures (CapEx) are for big-ticket items like roof repairs or appliance replacements. Industry standards suggest setting aside 10-15% of gross income for CapEx.
List every recurring cost, from software subscriptions to weekly cleaning services. Don’t forget to factor in Airbnb’s service fees, which can take up to 15% of your booking total. Sum these up to get your total annual operating expenses.
Step 3: Factor in financing and taxes
If you’re using a mortgage, your debt service is your largest expense. Include principal, interest, and any PMI. If you’re paying cash, use the opportunity cost of that capital as your financing expense. Subtract your total expenses (including debt service) from your gross income to get your Net Operating Income (NOI).
Deduct your annual mortgage payments and property taxes from your NOI. This gives you your pre-tax cash flow. Remember, this number is before you pay federal and state income taxes, which will further reduce your actual take-home profit.
Step 4: Compute your ROI and Cap Rate
Finally, compare your annual cash flow to your total cash invested. Your total cash invested includes the down payment, closing costs, and initial renovation budget. Divide your annual cash flow by this total to get your Cash-on-Cash ROI. For a broader market comparison, divide your NOI by the property’s purchase price to get the Cap Rate.
Divide your annual pre-tax cash flow by your total cash invested. This percentage tells you how efficiently your money is working. A higher Cash-on-Cash ROI indicates a stronger investment relative to the cash you put in.
Choosing the right platform for your research
Finding the right tool depends on whether you need deep historical trends or quick feasibility checks. The market for airbnb market data has consolidated around a few reliable platforms that track occupancy, revenue, and daily rates across millions of listings.
AirDNA remains the industry standard for comprehensive market analysis. It tracks over 10 million rentals across 120,000 markets, offering the most granular data for investors comparing specific zip codes or neighborhoods. Its depth makes it ideal for detailed feasibility studies, though it requires a subscription for full access. You can explore their free insights here: AirDNA.
For investors looking at international markets or those who need an API for automation, AirROI covers 20 million properties in 190 countries. It provides 15 years of historical data and includes dynamic pricing tools, making it a strong alternative for global portfolios. Check their platform: AirROI.
If your focus is strictly on U.S. properties and you want a quick, free estimate, BNBCalc offers instant revenue projections based on an address. It’s less comprehensive than AirDNA but useful for rapid screening of potential deals. See how it works: BNBCalc. Airbtics is another option for worldwide data with a 3-year historical dataset, though its user base is smaller.
Checklist for evaluating new markets
Before committing capital, you need to verify that the local airbnb market data supports your financial projections. This isn't just about finding a pretty house; it's about ensuring the property can legally operate and actually generate cash flow. Use this step-by-step due diligence list to filter out high-risk markets early.
Check city and county zoning laws first. Many municipalities require short-term rental licenses, cap the number of nights, or ban rentals in certain zones. Operating without proper permits can lead to heavy fines or shutdowns, wiping out your ROI instantly.
Look beyond the average daily rate. Focus on historical occupancy rates and seasonal fluctuations in the airbnb market data. A high daily rate means nothing if the property sits empty for half the year. Ensure the projected net operating income covers your mortgage and expenses comfortably.
Identify how many active listings already exist in your target neighborhood. High saturation often drives down daily rates and occupancy. Look for areas with growing demand but limited supply, rather than entering a market that is already crowded with similar properties.
Estimate all expenses, including property management fees, cleaning, maintenance, insurance, and local taxes. Many new investors underestimate these costs. A realistic expense ratio is typically 30-50% of gross revenue. If your margins are thin after these deductions, the risk may outweigh the reward.
Frequently asked questions about STR data
How do I get accurate Airbnb market data?
Accessing reliable Airbnb market data starts by entering the specific ZIP code or city you are researching. Platforms like Awning provide free insights into occupancy rates, daily rates, and the value of amenities, allowing you to benchmark against top-performing listings in that exact area.
What is a good occupancy rate for an Airbnb?
A healthy occupancy rate typically falls between 60% and 75% for most markets, though this varies significantly by season and local regulations. High-demand tourist destinations may sustain higher rates, while secondary markets often see lower averages. Always compare your actual performance against the local median provided in your market report.
How is ROI calculated for short-term rentals?
Return on investment (ROI) is calculated by dividing your annual net operating income by your total cash investment. Net operating income is your gross rental revenue minus annual expenses like cleaning, maintenance, and platform fees. For 2026, factor in potential regulatory costs or tax changes specific to your jurisdiction to ensure your projections remain realistic.
No comments yet. Be the first to share your thoughts!