
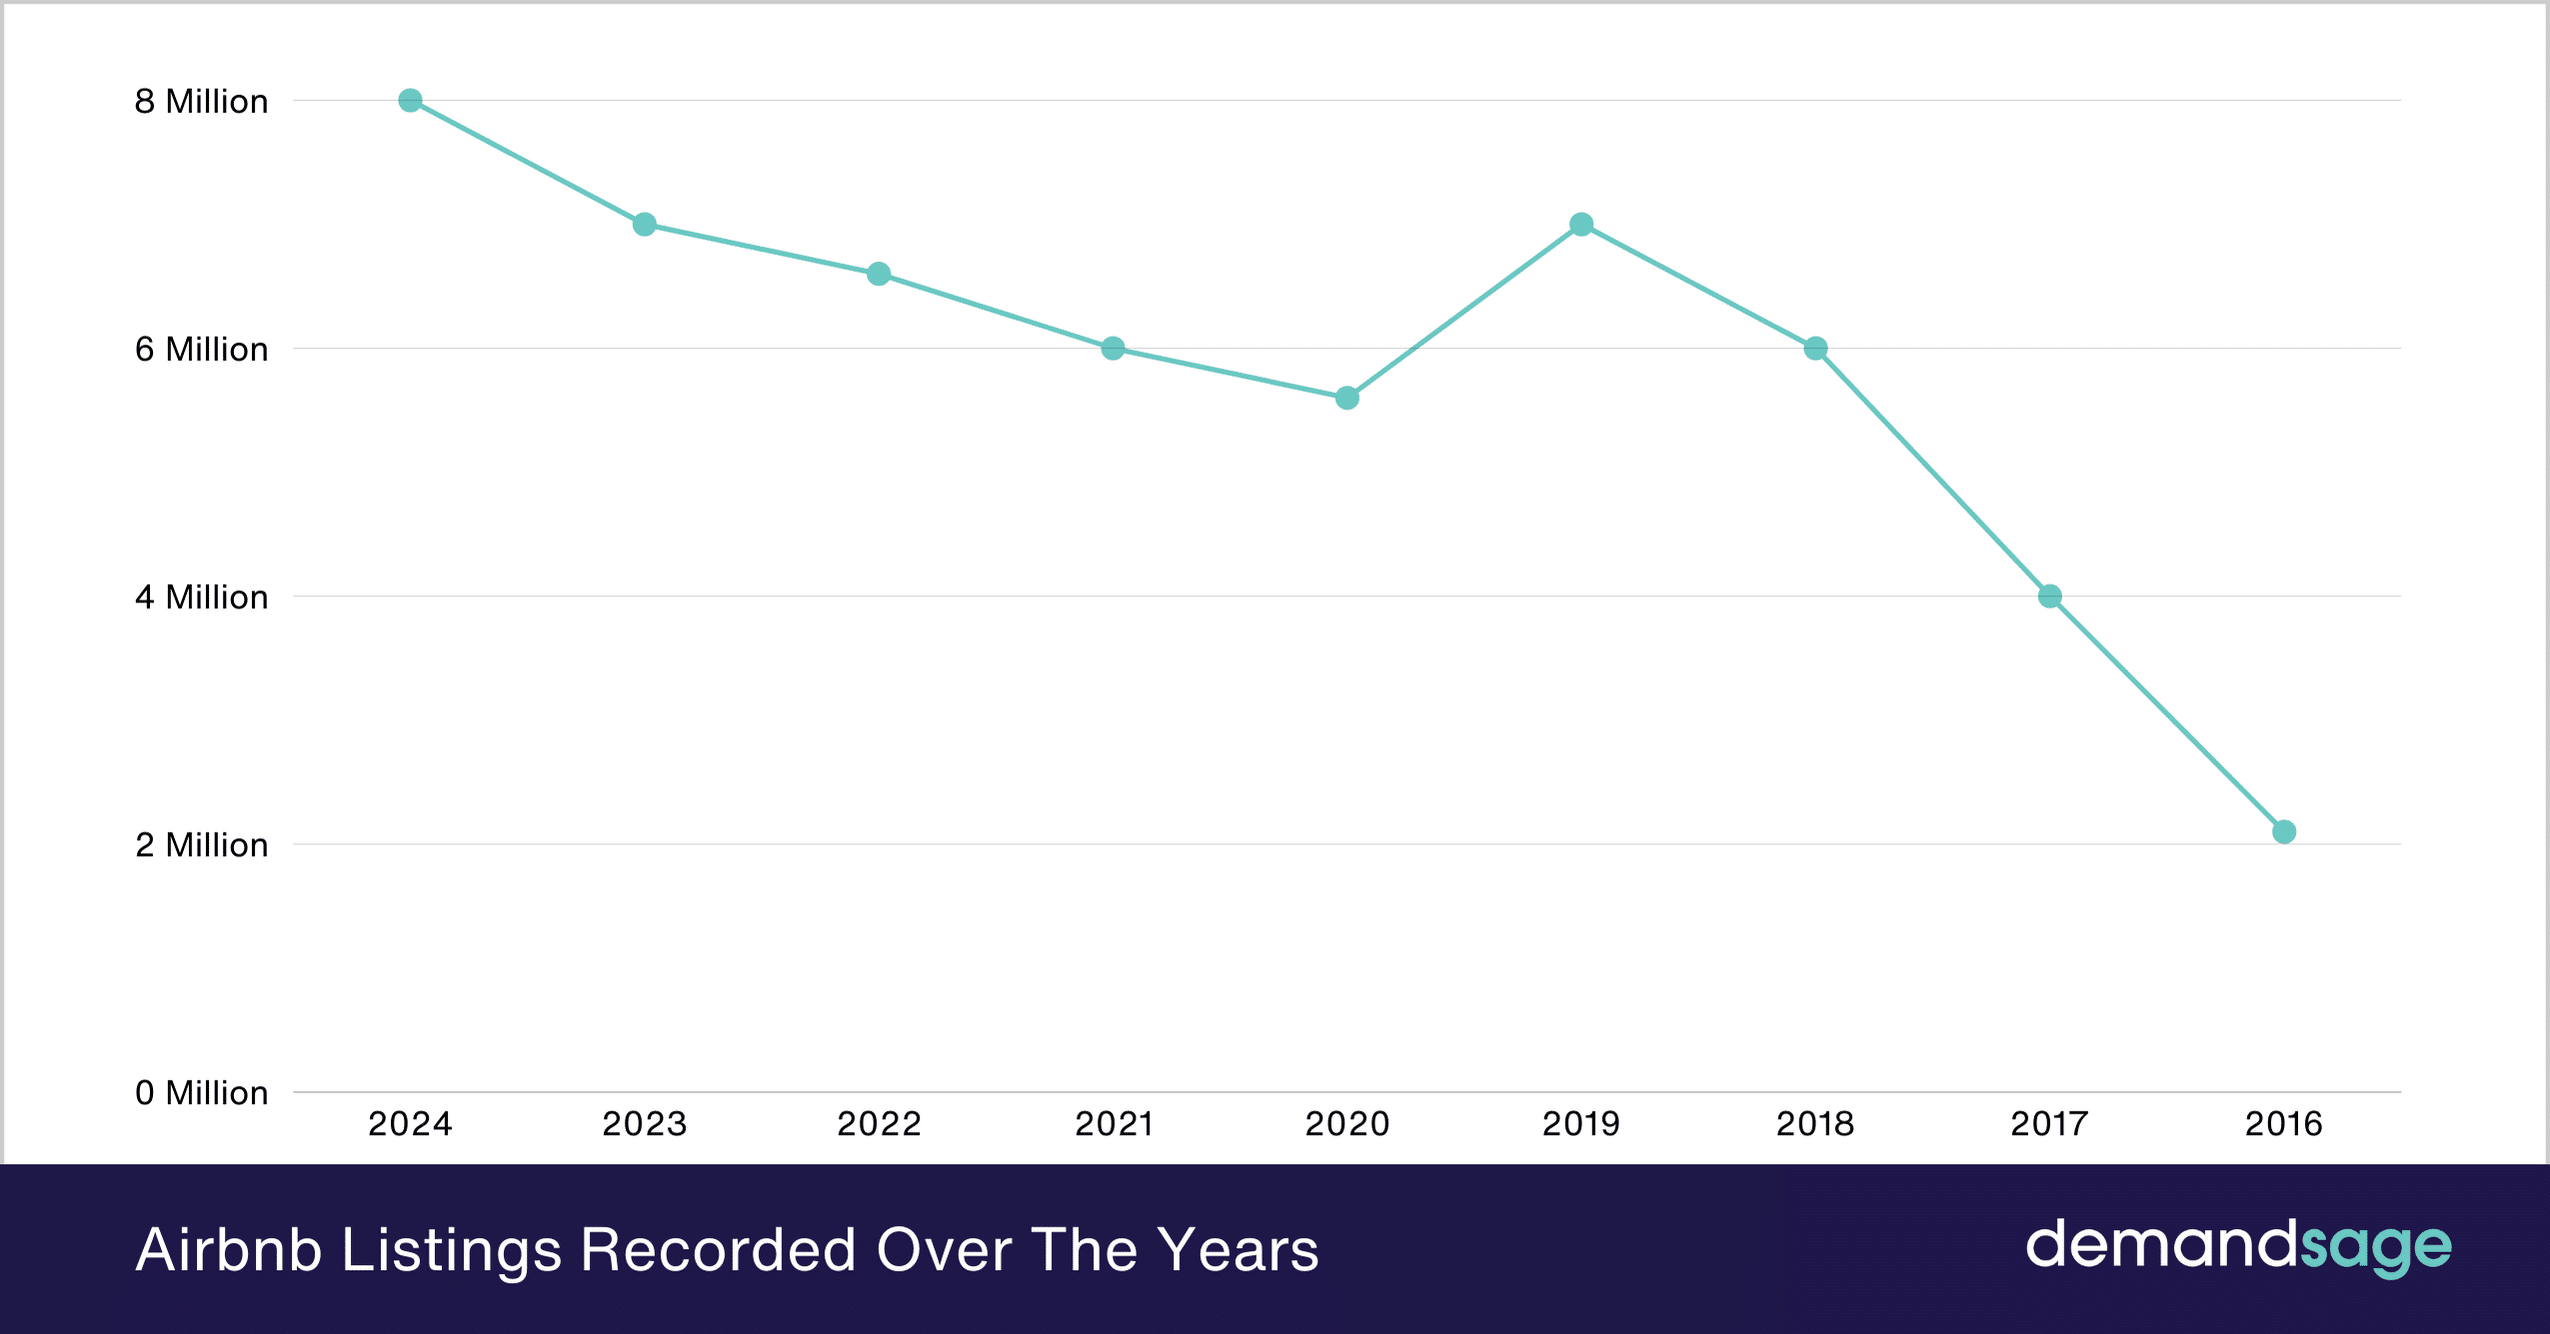
Record occupancy in Q2 2026
Airbnb occupancy rates hit a new peak in Q2 2026. AirDNA data shows a 15.7% increase over last year and a 22.3% jump from 2024. We are well past the pandemic recovery phase; these are the highest numbers the industry has seen.
The surge isn't uniform across the board. Coastal destinations like Miami and Charleston are leading the charge, with occupancy exceeding 90% in many areas. However, inland markets like Nashville and Denver are also experiencing substantial gains, though at a slightly slower pace. This broader geographical spread suggests a diversification of travel preferences.
Several factors are contributing to this record occupancy. Pent-up travel demand continues to play a role, as individuals prioritize experiences after prolonged restrictions. The rise of remote work allows for more flexible travel schedules, and in some areas, limited hotel capacity is directing demand toward Airbnb. These factors combine to create a favorable environment for short-term rental owners.
These figures are averages. Your actual bookings depend on your specific street and how well you manage the listing. The hosts making the most money right now are the ones adjusting their strategy weekly.
Who is booking right now
The composition of Airbnb guests is evolving. Airbtics data indicates a growing proportion of family travelers and groups, seeking larger properties with amenities like kitchens and private outdoor spaces. This contrasts with pre-pandemic trends, where solo travelers and couples were more dominant.
There's a clear shift in traveler preferences toward unique experiences. Properties offering distinctive designs, local character, or access to specific activities are performing particularly well. Standard, cookie-cutter rentals are facing increased competition. Guests are willing to pay a premium for something memorable.
The impact of remote work is undeniable. More people are able to work from anywhere, leading to longer stays and a willingness to explore destinations previously considered off-limits. This has fueled the growth of "bleisure’ travel – combining business trips with leisure activities. We"re seeing a noticeable increase in mid-week bookings.
While precise figures are difficult to obtain, anecdotal evidence suggests a rise in digital nomads utilizing Airbnb as a long-term accommodation solution. This segment often seeks properties with reliable internet access and dedicated workspaces.
- Families and large groups are looking for kitchens and yards.
- Groups
- Digital Nomads
- Bleisure Travelers
Dominant Traveler Groups - Q2 2026
- Families with Young Children (Ages 25-45) - Seeking spacious accommodations with kid-friendly amenities. Average trip duration: 5-7 nights.
- Digital Nomads (Ages 28-40) - Prioritizing reliable Wi-Fi and workspace setups for extended stays. Average trip duration: 28+ nights.
- Solo Female Travelers (Ages 30-55) - Focusing on safety, central locations, and positive reviews. Average trip duration: 3-5 nights.
- Couples/Romantic Getaways (Ages 25-60) - Looking for unique stays with appealing aesthetics and privacy. Average trip duration: 2-4 nights.
- Bleisure Travelers (Ages 35-50) - Combining business trips with leisure activities, requiring convenient locations and comfortable amenities. Average trip duration: 4-6 nights.
- Group Travelers (Ages 22-35) - Often students or young professionals seeking affordable options for group adventures. Average trip duration: 3-5 nights.
The hottest regional markets
Beyond the established markets of New York City and Los Angeles, several emerging destinations are experiencing explosive growth in Airbnb occupancy. Savannah, Georgia, is seeing a surge in demand, driven by its historic charm and growing culinary scene. Boise, Idaho, is attracting outdoor enthusiasts and remote workers.
Smaller cities with access to national parks are also performing exceptionally well. Moab, Utah, near Arches and Canyonlands National Parks, has seen occupancy rates climb dramatically. Similarly, Asheville, North Carolina, benefits from its proximity to the Blue Ridge Mountains.
What’s driving demand in these areas often comes down to a combination of factors: increased awareness through social media, affordability compared to larger cities, and a desire for outdoor recreation. A local festival or event can also provide a significant boost.
It's crucial to remember that high occupancy doesn't automatically translate to high revenue. Average Daily Rate (ADR) is a critical component. Some markets are achieving high occupancy by lowering prices, while others are able to maintain or even increase rates.
ADR & RevPAR: Beyond Occupancy
Occupancy rate is just one piece of the puzzle; understanding Average Daily Rate (ADR) and Revenue Per Available Room (RevPAR) is essential for a complete picture of performance. In markets like Miami and Austin, ADR has increased by 18% and 15% respectively, year-over-year, demonstrating significant pricing power.
However, in other areas, competition is keeping ADR in check. Phoenix, Arizona, for example, has seen strong occupancy growth, but ADR has only increased by 8%. This suggests that hosts are prioritizing volume over maximizing revenue per night.
RevPAR, which combines occupancy and ADR, provides a holistic view of revenue performance. Markets with both high occupancy and strong ADR growth, such as Nashville, are experiencing the most substantial gains in RevPAR. This is where the real opportunities lie.
We're observing a divergence in strategies. Some hosts are successfully leveraging high demand to increase prices, while others are relying on high occupancy to compensate for lower rates. The optimal approach depends on the specific market and property type.
- Miami: ADR +18%
- Austin: ADR +15%
- Phoenix: ADR +8%
Top 10 Airbnb Markets - Q2 2026 Performance
| Market | Occupancy Rate (%) | Average Daily Rate (ADR) ($) | Revenue Per Available Room (RevPAR) ($) | Year-over-Year Occupancy Change (%) |
|---|---|---|---|---|
| Orlando, FL | 88.2% | $215 | $168 | 12.5% |
| Miami, FL | 85.7% | $285 | $210 | 9.8% |
| Nashville, TN | 84.3% | $190 | $145 | 7.1% |
| New York, NY | 82.9% | $250 | $185 | 5.3% |
| Los Angeles, CA | 81.5% | $230 | $170 | 6.2% |
| Phoenix, AZ | 80.1% | $175 | $125 | 10.4% |
| Las Vegas, NV | 79.8% | $150 | $110 | 8.7% |
| Savannah, GA | 78.5% | $180 | $130 | 15.9% |
Illustrative comparison based on the article research brief. Verify current pricing, limits, and product details in the official docs before relying on it.
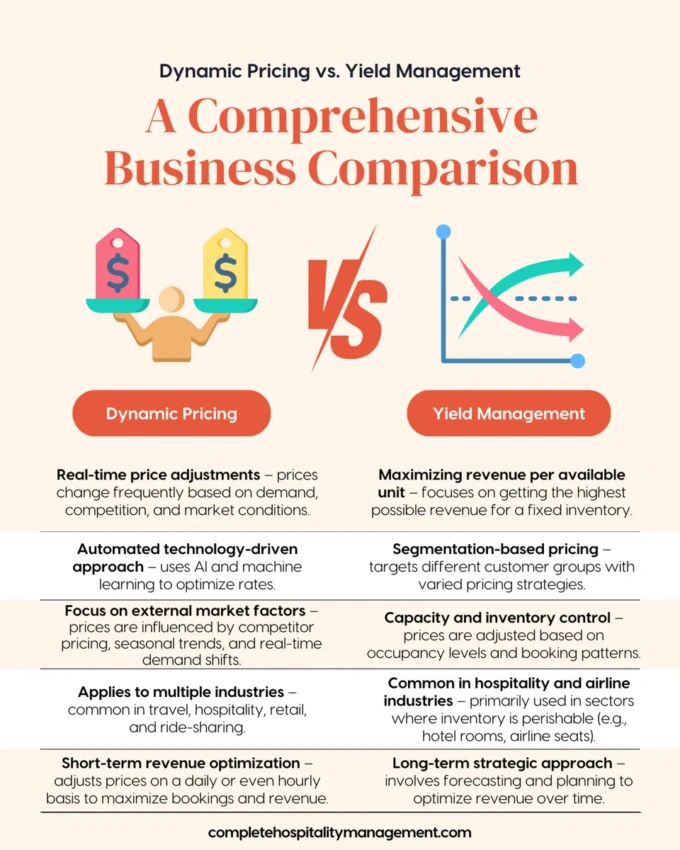
Pricing for a crowded market
In a market with record occupancy, a proactive pricing strategy is paramount. Dynamic pricing – adjusting rates based on real-time demand, seasonality, and competitor pricing – is no longer optional; it’s a necessity. This means moving beyond static rates and embracing data-driven adjustments.
Consider implementing a system that automatically adjusts prices based on events, holidays, and local demand spikes. For example, increase rates during popular festivals or concerts. Tools like PriceLabs or Beyond Pricing can automate this process, but they require careful configuration and monitoring.
Regularly monitor competitor rates. What are similar properties in your area charging? Are you priced competitively? Don’t be afraid to experiment with different price points to find the sweet spot. Underpricing leaves money on the table, while overpricing can lead to vacancies.
Flexibility is key. Be prepared to quickly adjust prices in response to changing market conditions. A sudden influx of demand or a competitor’s price drop can necessitate a swift response. Avoid rigid pricing rules that prevent you from capitalizing on opportunities. Consider offering discounts for longer stays or last-minute bookings.
Seasonality's Shifting Impact
Traditionally, Airbnb pricing has been heavily influenced by seasonality – peak summer months, holiday periods, and shoulder seasons. However, the sustained high demand is blurring those lines. The increased flexibility afforded by remote work means that travel is less concentrated around traditional vacation times.
Shoulder seasons – the periods immediately before and after peak season – are becoming increasingly valuable. Hosts are able to maintain higher rates during these periods than in the past, as demand remains strong. This is particularly true in destinations with mild climates.
Data suggests that the gap between peak and off-peak rates is narrowing in some markets. While peak season still commands a premium, the difference is less pronounced than it was in previous years. This is a positive development for hosts, as it provides a more consistent revenue stream.
Whether this shift is permanent remains to be seen. If remote work habits stick, we'll likely see this even distribution of demand continue through the decade.
Average Daily Rates & Seasonal Trends (2024-2026)
Data: AI-generated estimate for illustration
Long-Term vs. Short-Term: A Reassessment
With Airbnb occupancy rates at record highs, it’s a good time to reassess the long-term vs. short-term rental debate. For investors considering purchasing properties, the potential for high returns from short-term rentals is particularly appealing.
However, it’s important to factor in the increasing cost of properties in popular markets. Prices have risen significantly in recent years, potentially eroding ROI. A thorough financial analysis is essential before making any investment decisions.
Consider the operating costs associated with short-term rentals: cleaning, maintenance, utilities, and property management fees. These costs can eat into your profits, so it’s important to accurately estimate them. Also, be aware of potential risks, such as property damage and guest issues.
Finally, be mindful of local regulations and ordinances. Some cities are imposing restrictions on short-term rentals, such as limits on the number of days a property can be rented out or requiring permits and licenses. Staying compliant with local laws is crucial.
- Q: Is now a good time to invest in short-term rentals?
- A: It depends on the market and your financial situation. Conduct thorough research and analysis.
- Q: What are the biggest risks of short-term rentals?
- A: Property damage, guest issues, and changing regulations.
- Q: How can I maximize my ROI?
- A: Implement a dynamic pricing strategy, provide excellent guest service, and stay compliant with local laws.

No comments yet. Be the first to share your thoughts!