
For years, a simple occupancy rate felt like the north star for Airbnb hosts. Get those nights booked, right? But the game is changing, and frankly, relying on occupancy alone in 2026 is a recipe for leaving money on the table. The market is getting saturated, especially in popular destinations, and travelers are becoming more savvy. They expect value, and they're willing to shop around.
What worked in 2024 – or even 2025 – just won’t cut it. We’re seeing a shift towards more dynamic pricing, where rates fluctuate based on demand, seasonality, and even hyper-local events. That means a static approach to pricing is a missed opportunity. It’s no longer about if you’re booked, but how much you’re earning per occupied night.
The problem is, predicting that 'how much' accurately is complex. It requires a deep understanding of market data, competitor pricing, and a whole lot of factors beyond just location. That's where a robust Airbnb revenue calculator comes in. It’s not about replacing your intuition, but augmenting it with data-driven insights. It's about moving beyond guessing and towards informed financial projections.
We've entered an era where maximizing profits isn’t about filling every night, it’s about filling the right nights at the right price. The shift demands a new level of sophistication in how we analyze and approach short-term rental investment.

Accurate revenue projections aren’t pulled from thin air. They’re built on data, and two major players dominate the Airbnb data landscape: AirDNA and Rabbu. Both companies collect and analyze massive amounts of data from Airbnb and other short-term rental platforms, providing insights into occupancy rates, average daily rates (ADR), seasonality, and more.
AirDNA, for example, focuses heavily on providing a comprehensive view of the market, allowing you to research markets and compare your listing’s performance against competitors. Rabbu, on the other hand, often leans towards a more user-friendly interface and offers tools for analyzing specific properties. They both provide valuable location data, helping you understand demand in specific neighborhoods.
However, it’s important to be realistic. Neither AirDNA nor Rabbu is perfect. Data accuracy can vary depending on the market, and they rely on publicly available information, which may not always capture the full picture. Relying solely on one source can lead to skewed results. They’re powerful tools, but they should be used as part of a broader analytical process – not treated as gospel.
- AirDNA: Strong market research capabilities, comprehensive data sets.
- Rabbu: User-friendly interface, focus on property-level analysis.
- Both: Provide occupancy, ADR, seasonality, and location data.
AirDNA vs. Rabbu: A Comparative Overview (2026)
| Data Coverage | Price Range | Ease of Use | Focus | Unique Features |
|---|---|---|---|---|
| AirDNA | Medium to High 💰 | Moderate | Investment Analysis | Offers a 'Rentalizer' to predict potential revenue. Provides market research and for-sale property identification. |
| Rabbu | Medium | $ - $$ | Property Management | Focuses on streamlining property management tasks alongside data insights. |
| AirDNA | Medium to High 🌍 | Moderate | Market Research | Strong emphasis on comprehensive market data and identifying investment opportunities. |
| Rabbu | Medium | Easy | Revenue Management | Aims to simplify revenue optimization and automate pricing strategies. |
| AirDNA | High (in popular markets) | $$ - $$$ | Moderate | Competitive Analysis |
| Rabbu | Medium | Moderate | Guest Communication | Includes tools for managing guest communication and automating responses. |
Illustrative comparison based on the article research brief. Verify current pricing, limits, and product details in the official docs before relying on it.
Location is often touted as the most important factor in Airbnb revenue, and it certainly matters. But it’s far from the whole story. In 2026, a prime location alone won’t guarantee success. You need to understand the complex interplay of factors that actually drive revenue.
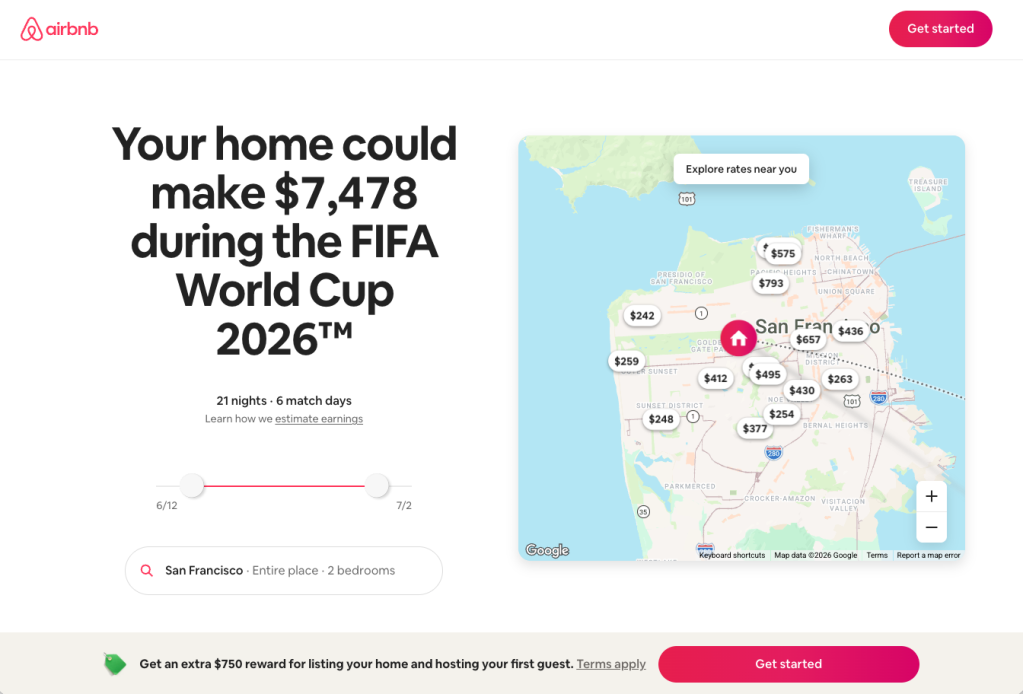
Seasonality is huge. Demand fluctuates dramatically depending on the time of year. Coastal properties will peak in the summer, ski resorts in the winter, and cities might see spikes during major conferences or events. Day-of-week pricing also plays a role – weekends typically command higher rates than weekdays. Then there are local events. A music festival, a sporting event, or even a large convention can send demand soaring.
But it doesn’t stop there. Property amenities are critical. A hot tub, a pool, high-speed internet, and a well-equipped kitchen can all justify higher rates. And critically, the quality of your listing matters. Professional photos, a detailed and accurate description, and positive reviews build trust and attract bookings. Competitor analysis is essential too – what are similar properties in your area charging? What amenities do they offer? What are their occupancy rates?
These factors aren't isolated; they interact with each other. A well-appointed property in a desirable location during a peak season with glowing reviews will command a premium price. Understanding these dynamics is essential for maximizing your rental income. It's about thinking like a traveler and anticipating what they're willing to pay for.
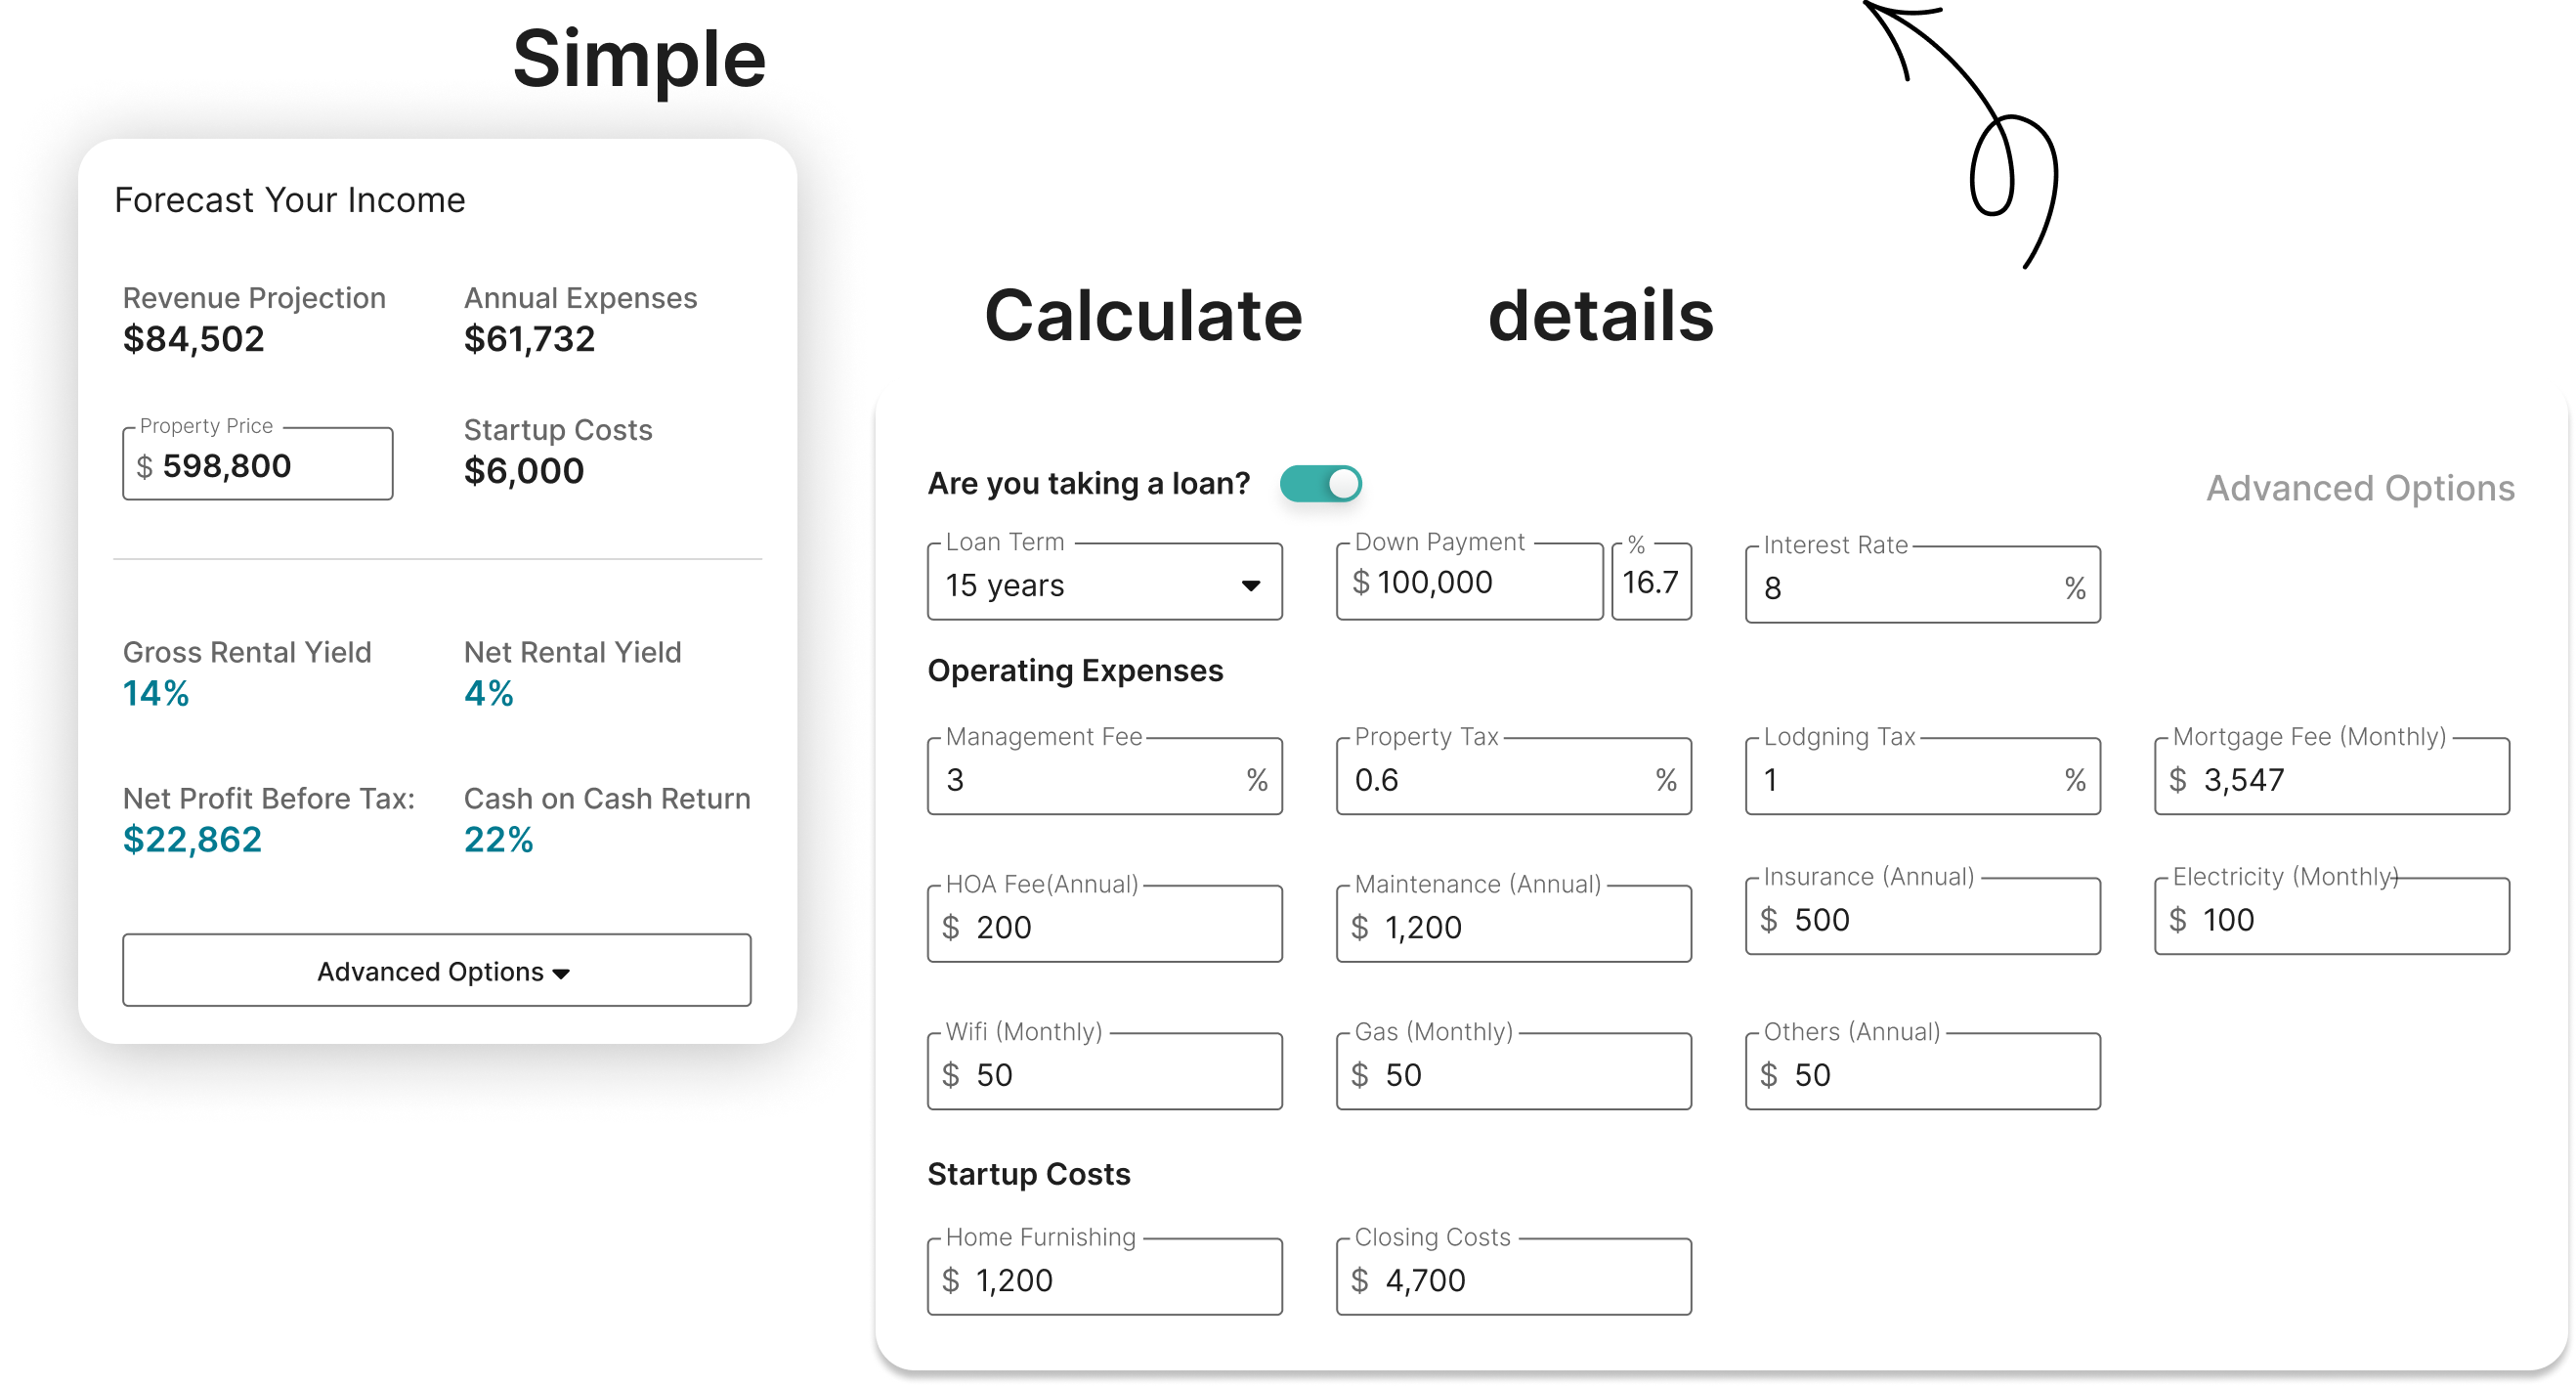
A good Airbnb revenue calculator isn't just a black box. It requires specific inputs to generate a realistic projection. The more accurate your inputs, the more reliable the estimate. Start with the basics: property details like size (square footage), number of bedrooms and bathrooms, and type of property (house, condo, apartment).
Location is, of course, crucial. The calculator needs to know the exact address to access relevant market data. Amenities are also key – be sure to list everything your property offers, from Wi-Fi and air conditioning to a fully equipped kitchen and a backyard. Your base nightly rate is a starting point, but remember, this will be adjusted based on demand and seasonality.
Don’t forget about fees! Include cleaning fees, security deposits, and any other charges you impose on guests. Finally, and this is often overlooked, estimate your operating expenses. This includes utilities, internet, property management fees (if applicable), insurance, property taxes, and maintenance costs. Underestimating expenses is a common mistake.
Each input impacts the final revenue projection. A larger property with more bedrooms will generally command a higher rate, but it also comes with higher expenses. A prime location will boost demand, but you’ll also likely face more competition. Accurate inputs are the foundation of a reliable estimate.
- Property size (square footage)
- Number of bedrooms/bathrooms
- Property type (house, condo, etc.)
- Exact property address
- List of amenities
- Base nightly rate
- Cleaning fee
- Estimated operating expenses
Setting a fixed nightly rate and hoping for the best is a strategy that will quickly become obsolete. Dynamic pricing is the future of Airbnb revenue management. It involves adjusting your rates in real-time based on a variety of factors, including demand, seasonality, competitor pricing, and local events.
Algorithms analyze these factors and automatically adjust your rates to maximize occupancy and revenue. When demand is high, rates go up. When demand is low, rates go down. This ensures you’re capturing the maximum possible revenue during peak periods and remaining competitive during slower times.
Several tools can automate dynamic pricing, but it’s important to understand the risks. Setting prices too high can deter potential guests, while setting them too low can leave money on the table. It’s a balancing act, and it requires careful monitoring and adjustment. A good revenue calculator will often incorporate dynamic pricing scenarios into its projections.
Many new Airbnb hosts are surprised by the sheer number of expenses involved. It’s not just about cleaning fees and property management. You need to account for utilities (electricity, water, gas), internet access, property insurance (which is often higher for short-term rentals), and property taxes.
Don’t forget about ongoing maintenance – things will break, and repairs will be needed. You’ll also need to factor in potential vacancy periods, when your property is unoccupied. A realistic estimate of vacancy rates is crucial for accurate revenue projections. And consider the cost of replacing linens, towels, and other consumables.
Creating a detailed expense spreadsheet is essential. Track every expense, no matter how small. This will give you a clear picture of your true costs and help you calculate your net profit accurately. Failing to account for all expenses is a common mistake that can lead to inaccurate financial projections and ultimately, lost profits.
- Utilities (electricity, water, gas)
- Internet access
- Property insurance
- Property taxes
- Maintenance and repairs
- Vacancy costs
- Consumables (linens, towels, toiletries)
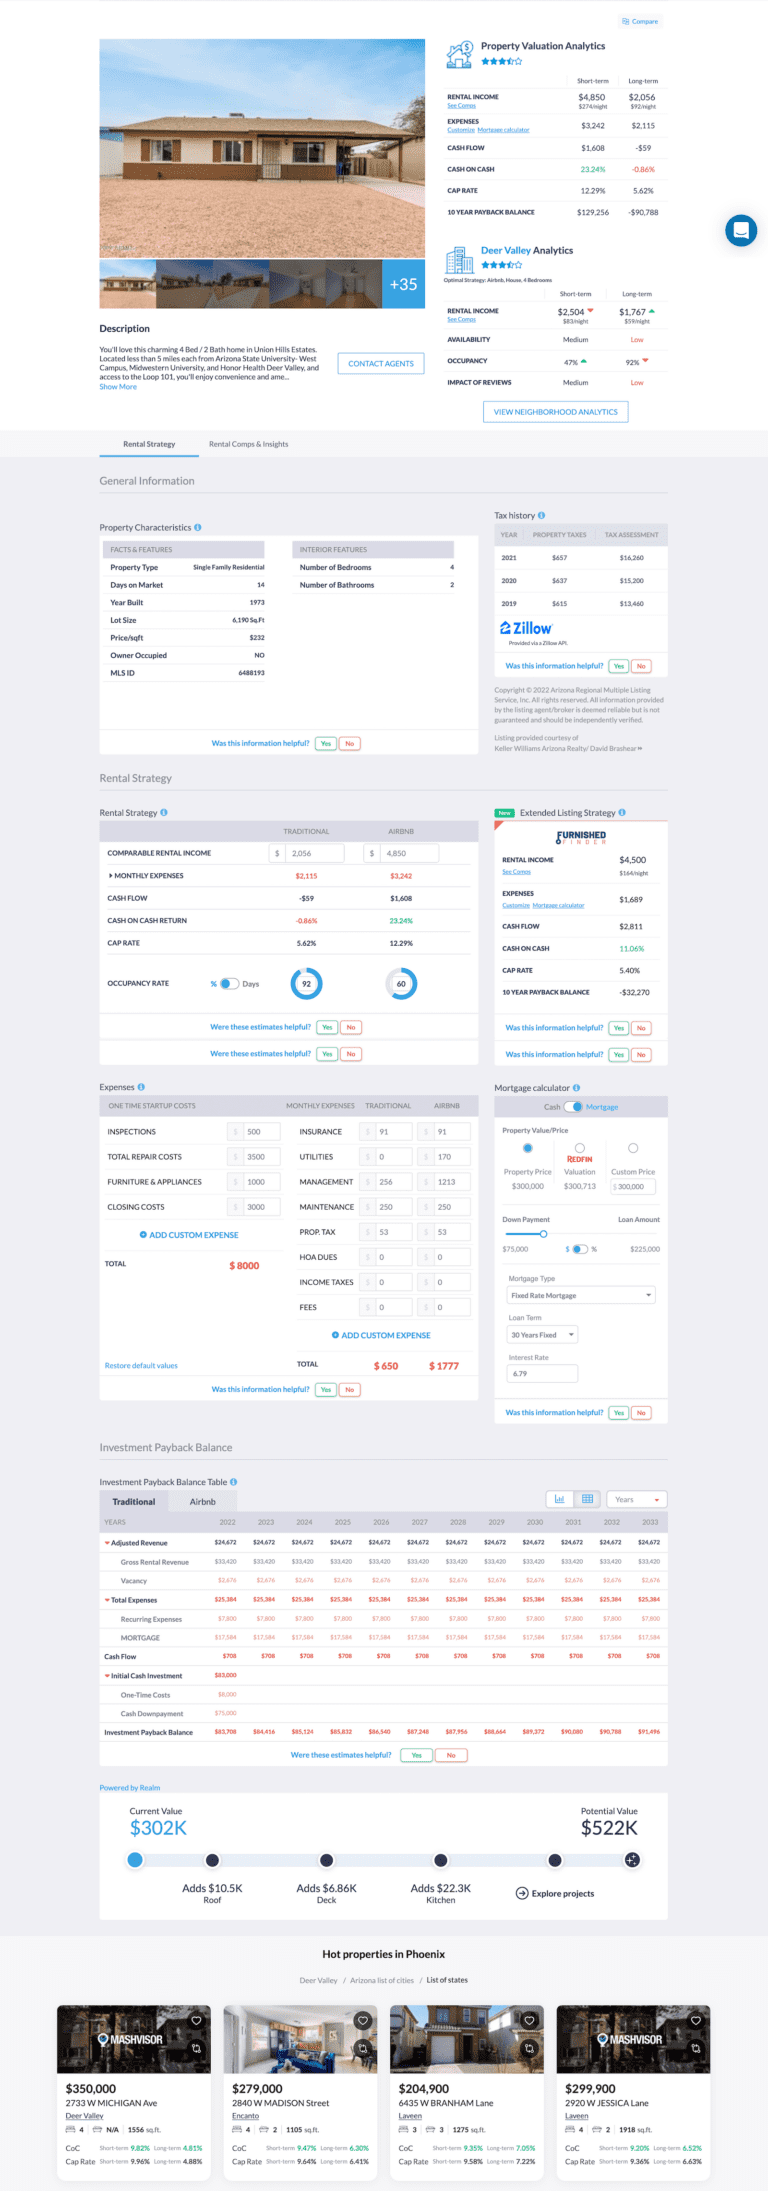
An airbnb revenue calculator spits out a lot of numbers – but what do they actually mean? Focus on key metrics like Return on Investment (ROI), capitalization rate (cap rate), and break-even occupancy rate. ROI measures the profitability of your investment as a percentage of your initial investment. A higher ROI is generally better.
Cap rate is another important metric, representing the potential rate of return on an investment property. It’s calculated by dividing the net operating income (NOI) by the property’s value. Finally, break-even occupancy rate tells you the percentage of nights you need to book to cover all your expenses. Knowing this number is crucial for assessing the viability of your investment.
Use these metrics to evaluate the profitability of a potential investment. If the ROI is too low, or the break-even occupancy rate is too high, the investment might not be worth it. A revenue calculator isn’t just about predicting income; it’s about empowering you to make informed financial decisions.
Looking ahead to 2026, several trends could significantly impact Airbnb revenue. We're likely to see continued shifts in travel patterns, with a growing demand for unique and experiential stays. The rise of 'bleisure' travel – combining business and leisure – could also create new opportunities.
Local regulations are becoming increasingly strict in many popular destinations. Hosts need to stay informed about these regulations and ensure they’re compliant. The growing popularity of alternative accommodation options, such as glamping and tiny homes, could also impact demand for traditional Airbnb rentals.
Technology will continue to play a major role. AI-powered pricing tools will become more sophisticated, and virtual tours will become increasingly common. The metaverse and augmented reality could even offer new ways for guests to experience properties remotely. Adapting to these changes will be crucial for maximizing your Airbnb revenue in 2026.
Average Daily Rate (Airbnb Short-Term Rentals) Price Prediction 2026
Bull / Base / Bear scenario analysis for popular markets
| Timeframe | Bull Case | Base Case | Bear Case | Key Driver |
|---|---|---|---|---|
| 1 Month | $185 | $175 | $160 | Peak winter season demand and holiday bookings |
| 3 Months | $195 | $180 | $165 | Spring break surge and early summer booking momentum |
| 6 Months | $210 | $190 | $170 | Summer peak season performance and supply constraints |
| 1 Year | $225 | $200 | $175 | Market maturation and regulatory environment stabilization |
Price Prediction Summary
ADR growth is expected to moderate from historic highs but remain positive, driven by continued travel demand recovery and supply-demand imbalances in popular markets. Base case projects 14% annual growth, though regulatory headwinds and economic uncertainty could limit upside.
Key Factors Affecting Average Daily Rate (Airbnb Short-Term Rentals) Stock Price
- Travel demand recovery and consumer spending patterns
- Local regulatory changes and zoning restrictions
- New supply additions and market saturation levels
- Seasonal tourism patterns and event-driven demand
Disclaimer: Predictions are speculative and not financial advice. Stock price predictions are based on current market analysis and may vary significantly due to market volatility, economic conditions, and other unpredictable factors. Always do your own research before making investment decisions.
No comments yet. Be the first to share your thoughts!