
Airbnb Market Growth and Booking Volume
The Airbnb platform continues to expand its scale in 2026, driven by sustained demand for short-term rentals despite a more competitive operating environment. According to official financial data, Airbnb reported gross bookings of $92.6 billion in 2025, marking a 13.2% increase over the previous year. This growth trajectory confirms that the market is not shrinking, even as profit margins tighten for individual hosts.
Understanding the baseline volume of these bookings is essential for evaluating market health. The gross bookings value represents the total money flowing through the platform before any fees or expenses are deducted. This metric serves as the primary indicator of consumer demand and platform liquidity. For investors and analysts, tracking this growth provides a clear view of the addressable market size.
To visualize this historical trend, the chart below displays the progression of Airbnb's gross bookings value. The upward trajectory underscores the platform's resilience and its ability to generate increasing transaction volumes year over year.
Setting realistic occupancy benchmarks
The 2026 short-term rental market demands precision. After the pandemic-era boom, margins have tightened, and relying on optimistic projections is a fast track to negative cash flow. To filter viable properties from risky ones, investors should anchor their due diligence in the 75-55 rule.
This informal but widely accepted benchmark suggests a property is viable only if it achieves 75% occupancy at a rate no less than 55% of the local market average. If a neighborhood averages $200 per night, your property should realistically command at least $110 while filling 75% of available nights. This creates a baseline for revenue that accounts for the reality that no property is booked 365 days a year.
This rule acts as a stress test. It forces you to look at actual market data rather than listing photos. Investors who chase 90% occupancy often overpay for properties that are too small or poorly located. Conversely, those who ignore the 55% rate floor may find themselves pricing out of a competitive market, leading to the vacancy they feared.
Once you establish this occupancy floor, you can calculate net revenue. After accounting for the service charge (roughly 3%), cleaning, supplies, insurance, and a maintenance reserve, a well-run listing typically nets 50–65% of gross revenue. Understanding this ratio ensures that your occupancy targets translate into actual profit, not just busy calendars.
Revenue optimization and net margins
Gross revenue tells only half the story. After the service charge (typically 3 percent), cleaning costs, supplies, insurance, and a maintenance reserve, a well-run listing typically nets 50–65 percent of gross revenue. This margin is where profitability is actually determined, and it is highly sensitive to how you manage variable expenses and pricing strategy.
Dynamic pricing is the primary lever for protecting that bottom line. Static nightly rates leave money on the table during demand spikes and leave vacancies during dips. By adjusting rates based on real-time market data, occupancy, and local events, you can maximize revenue per available night (RevPAR). Tools like Airbnb’s built-in Smart Pricing or third-party platforms such as Airbtics and Mashvisor help automate these adjustments, ensuring your rates stay competitive without requiring manual daily overrides.
Expense management is the other side of the net margin equation. Many hosts underestimate the cost of turnover. If cleaning fees are too low, you sacrifice quality; if they are too high, you deter bookings. A common benchmark is to keep cleaning and supply costs under 10–15 percent of gross revenue. Additionally, setting aside 5–10 percent of revenue for maintenance and repairs prevents unexpected costs from eroding your net profit. Tracking these expenses in a dedicated spreadsheet or property management software allows you to identify leaks early.
The "75-55 rule" offers a quick pre-purchase viability check: aim for at least 75 percent occupancy at a rate no less than 55 percent of the market average nightly rate. While this is an informal benchmark, it highlights the importance of balancing volume with rate. A property that sits at 90 percent occupancy with a low rate may net less than one at 70 percent occupancy with a premium rate, depending on your expense structure.
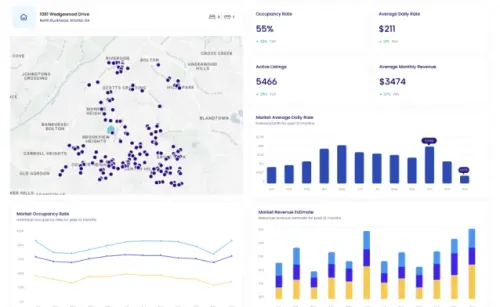
To visualize current market conditions and potential revenue streams, you can check live average daily rate (ADR) estimates for your target market below. This data helps contextualize your own property's performance against current benchmarks.
Comparing top data analytics platforms
Choosing the right software for due diligence requires aligning tool capabilities with your specific investment strategy. While AirDNA remains the industry standard for broad market data, AirROI and BNBCalc offer distinct advantages for API integration and rapid U.S. property modeling, respectively.
The table below outlines the core differences in data granularity, pricing structures, and primary use cases to help you select the appropriate tool for your portfolio.
| Platform | Primary Focus | Pricing Model | Best For |
|---|---|---|---|
| AirDNA | Market-wide trends & competitor analysis | Freemium (Pro starts ~$99/mo) | Deep market research & long-term strategy |
| AirROI | Revenue estimation & dynamic pricing API | Free market data; API usage-based | Developers & automated portfolio management |
| BNBCalc | Individual property revenue projections | Free basic calculator; Pro subscription | Quick U.S. property feasibility checks |
AirDNA provides the most comprehensive historical data, tracking over 10 million rentals across 120,000 markets. Its strength lies in identifying macro trends, making it essential for investors evaluating new markets or conducting deep competitor analysis. However, the cost can add up for those managing multiple properties.
AirROI distinguishes itself with a robust API and free market analytics access. It is particularly valuable for investors who want to integrate real-time revenue estimates directly into their own dashboards or automation workflows. The platform’s dynamic pricing tools also help maximize nightly rates based on local demand fluctuations.
BNBCalc is designed for speed and simplicity, especially for U.S.-based investors. By entering a specific address, you receive instant revenue projections and average daily rate estimates. It is less suited for broad market research but serves as an excellent initial filter for screening individual properties before committing to deeper analysis.
Due diligence checklist for investors
Before committing capital, verify market data and financial projections against primary sources. Airbnb's internal metrics are the most accurate reflection of local supply and demand dynamics. Relying on third-party estimates without cross-referencing official data can lead to inflated revenue expectations.
Log into the Airbnb host dashboard for comparable properties or use the Airbnb Insights tool if you have access. Look for the "Occupancy & rates" section to see actual conversion metrics. Do not rely on static spreadsheets; demand fluctuates weekly and seasonally. Compare the target property's performance against the neighborhood average to identify outliers.

Use the 75-55 rule as a baseline benchmark for evaluating profit potential. This informal standard suggests a short-term rental must achieve at least 75% occupancy at a rate no less than 55% of the market average nightly rate. If the property fails this threshold, the risk of negative cash flow increases significantly in a tightened market.
Gross revenue is not profit. After the service charge (approximately 3%), subtract cleaning costs, supplies, insurance, and a maintenance reserve. A well-run listing typically nets 50–65% of gross revenue. Ensure your pro forma accounts for these variable expenses to avoid overestimating cash flow.
Frequently Asked Questions About Airbnb Market Data
What is the 75-55 rule for Airbnb?
The 75-55 rule is an informal benchmark investors use to evaluate a property's profit potential before purchasing. It suggests that a short-term rental should achieve at least 75% occupancy at a rate no less than 55% of the market average nightly rate to be considered viable.
Are Airbnbs still profitable in 2026?
Yes, Airbnb hosting remains profitable in 2026, though margins have tightened from the pandemic-era boom. After accounting for the service charge, cleaning, supplies, insurance, and maintenance reserves, a well-run listing typically nets 50–65% of gross revenue.
Is Airbnb growing or shrinking?
Airbnb is expanding. The platform reported a gross bookings value of $92.6 billion in 2025, marking a 13.2% increase from the previous year. This growth indicates sustained demand for short-term rentals despite evolving regulatory landscapes.
How do I access Airbnb statistics?
Hosts can view performance metrics directly through the Airbnb Insights dashboard. This section provides data on conversion rates, occupancy levels, nightly rates, and quality scores to help optimize listing performance.
No comments yet. Be the first to share your thoughts!