
Calculate your baseline occupancy
To assess your return on investment accurately, you must first establish a realistic baseline for your property's performance. Airbnb defines average occupancy rate as the number of nights booked divided by the total nights available to be booked across all relevant listings.
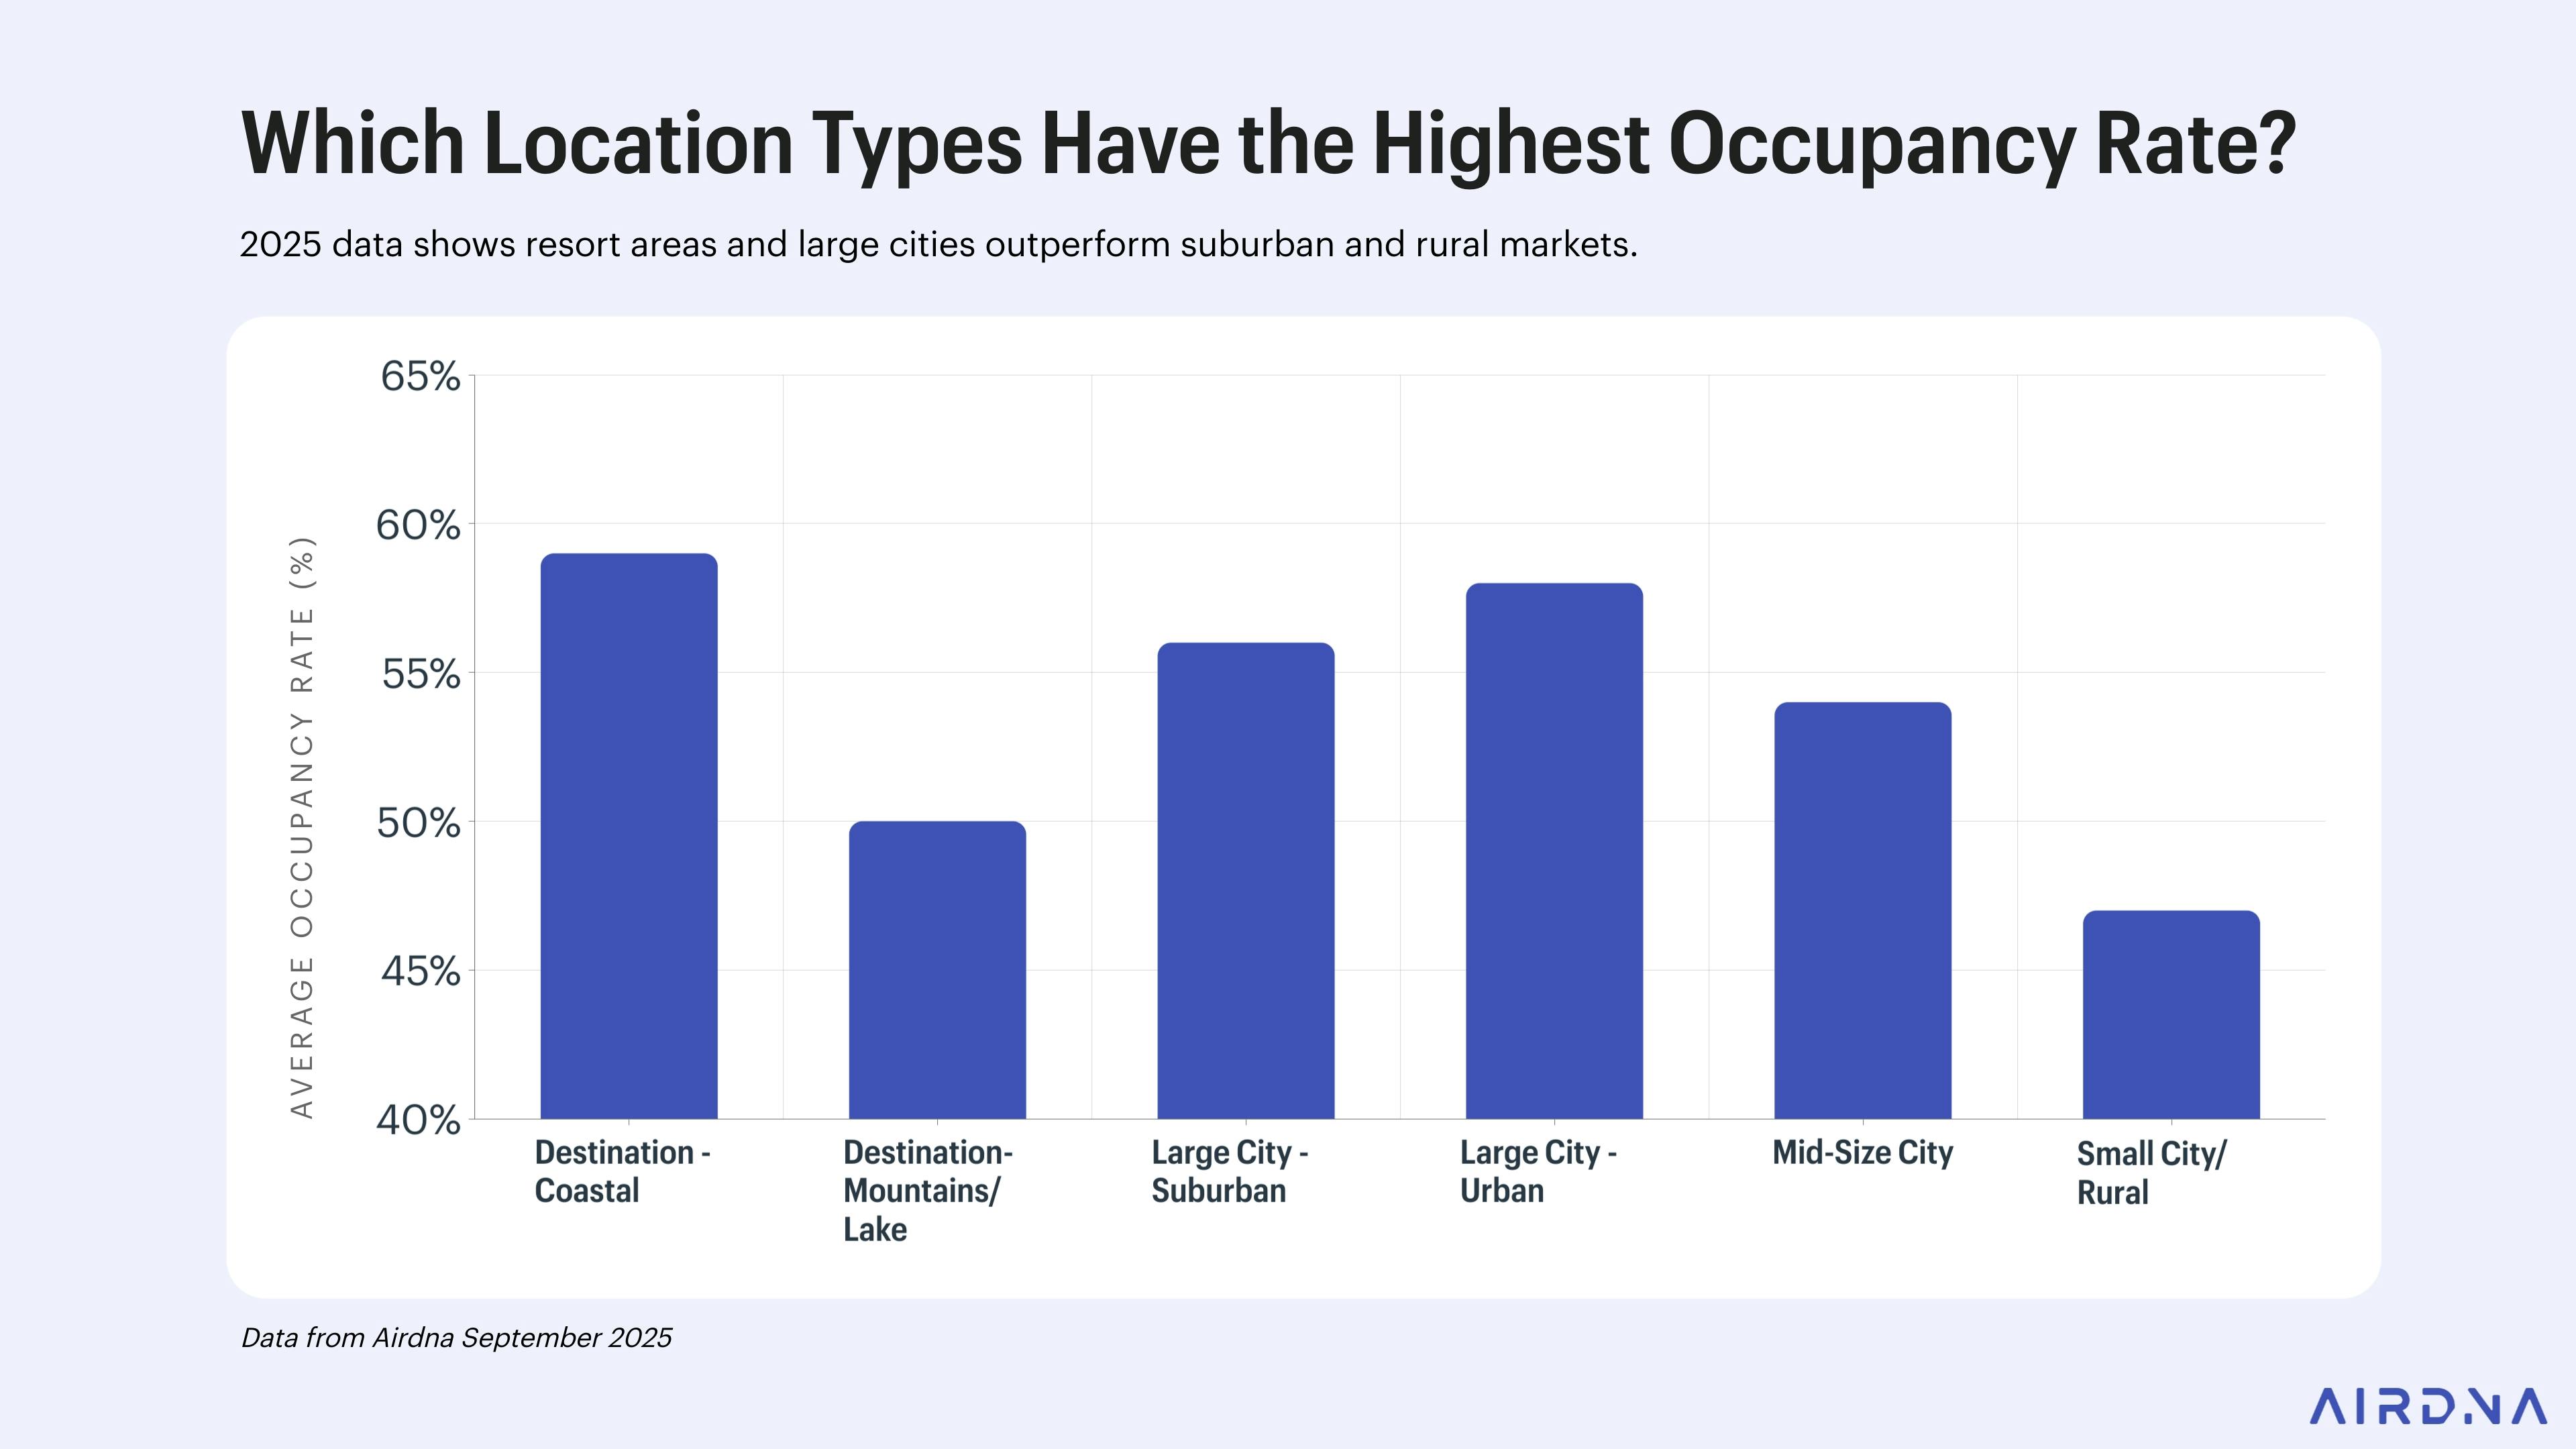
The current US average sits between 50% and 54% in 2026, a decline from 57% in 2024. Use this range to ground your expectations before projecting revenue.
- Calculate: Divide your total booked nights by the total available nights in the same period.
- Compare: Benchmark your result against the 50-54% national average.
- Adjust: Modify pricing or minimum stay requirements to close gaps.
- Validate: Track changes monthly to confirm upward trends.
Compare local market benchmarks
National averages obscure local reality. A 60% occupancy rate might signal strong performance in a saturated market like Orlando, yet indicate underperformance in a high-demand destination like Hanalei, Hawaii, where rates can exceed 65%. To contextualize your property’s ROI, you must benchmark against specific city or neighborhood data rather than broad national statistics.
Start by calculating your property’s current monthly occupancy percentage. Compare this figure against the median occupancy rates for your specific zip code or city. Use official data sources or primary industry reports, such as those from Airbnb Statistics by City or Mashvisor, to identify the local baseline. If your rate falls below the local median, investigate pricing gaps or seasonal volatility before adjusting your strategy.
The following table compares typical occupancy ranges for major US markets against the national average. Use this data to set realistic targets for your specific location.
| Market Type | Avg. Occupancy | Good Threshold | Context |
|---|---|---|---|
| National US | 45-50% | > 55% | Broad average; less actionable |
| High-Demand (e.g., Hawaii) | 60-68% | > 65% | Premium pricing offsets lower volume |
| Saturated Urban (e.g., Orlando) | 50-60% | > 55% | High volume, competitive pricing |
| Emerging Markets | 40-50% | > 50% | Growth potential; lower baseline |
Adjust your pricing and marketing based on these local benchmarks. If your occupancy is below the local threshold, consider dynamic pricing tools or targeted promotions during off-peak months. Validate your results monthly by tracking changes in occupancy relative to the local median, ensuring your adjustments are moving the needle toward your ROI goals.
Adjust pricing for seasonal gaps
When occupancy rates dip below the 60–70% benchmark, your pricing model must shift from growth to retention. The goal is not to maximize nightly revenue per stay, but to maximize total revenue by filling empty nights. Empty nights represent a total loss of fixed costs; a discounted night still contributes to covering those overheads.
Follow this sequence to adjust rates dynamically during low-demand periods.
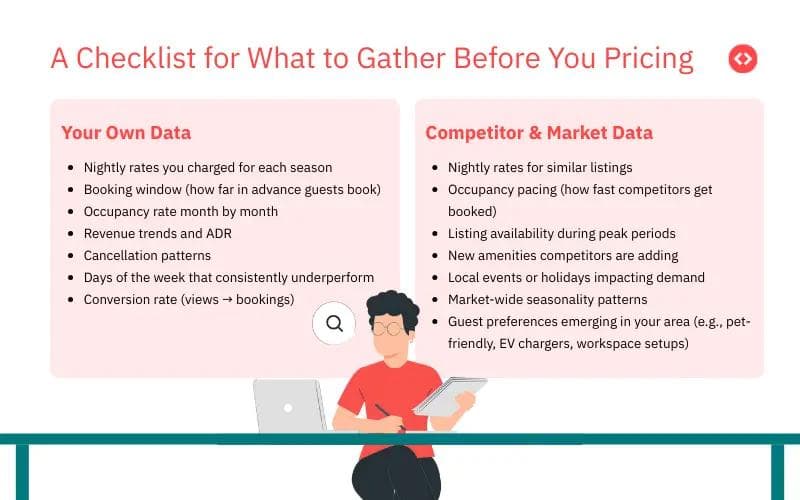
Pull your annual occupancy report. Identify months where your booking rate falls below 60%. These are your "gap months" where demand is structurally weak, regardless of events or holidays. Use tools like AirDNA to compare your local market's seasonal baseline.
Reduce your nightly rate by 15–25% below your standard peak pricing. Do not slash prices below your break-even point (rent + utilities + cleaning + platform fees). The objective is to attract price-sensitive travelers who would otherwise stay in hotels or not travel at all.
Instead of dropping the price further, bundle value. Offer free late checkout, a discounted local experience, or a welcome basket. This preserves your nightly rate integrity while increasing perceived value. Guests often prefer added perks over a slightly lower price that feels "cheap."
Monitor your booking velocity (how fast nights are being reserved) for 14 days. If bookings remain slow, increase the discount incrementally by 5%. If bookings accelerate, hold the price. Avoid constant tweaking; let the market signal its response before making further adjustments.
By following this workflow, you turn seasonal gaps into steady income streams rather than losses. Consistency in your pricing adjustments builds trust with both guests and the algorithm, which favors listings with consistent booking history.
Fix common data misinterpretations
Hosts often mistake high occupancy for high profitability. A listing booked 90% of the year at a low nightly rate can generate less revenue than one booked 60% of the year at a premium. To read Airbnb occupancy rates for better ROI, you must look beyond the percentage and examine the underlying revenue metrics.
Calculate RevPAR, not just occupancy
Occupancy rate alone ignores price. Revenue Per Available Room (RevPAR) combines occupancy with average daily rate (ADR) to show true performance. Use the formula:
RevPAR = Average Daily Rate × Occupancy Rate
For example, a property with a $150 ADR and 60% occupancy yields $90 in RevPAR. A competitor with a $120 ADR and 80% occupancy yields only $96. The difference seems small, but over a year, it compounds significantly. Tracking RevPAR allows you to compare properties and strategies on an equal financial footing.
Compare against market benchmarks
Raw percentages are misleading without context. The average US Airbnb occupancy rate sits between 50% and 54% in 2026, down from 57% in 2024 [[src-serp-3]]. If your property achieves 70% occupancy in a saturated market, it may still be underperforming relative to premium competitors. Always benchmark your metrics against local market data rather than national averages.
High occupancy with low nightly rates often yields lower ROI than moderate occupancy with premium pricing.
Adjust pricing to maximize yield
Do not lower prices simply to fill dates. Instead, use dynamic pricing tools to adjust rates based on demand elasticity. If occupancy drops below 60%, test a price reduction only if the projected increase in volume outweighs the lower rate. Conversely, if occupancy exceeds 80%, raise prices to capture more value from the remaining availability. The goal is to balance volume with rate, not to maximize one at the expense of the other.
Validate data with cancellation rates
Occupancy statistics often count reservations, not actual stays. High cancellation rates can inflate reported occupancy while leaving you with empty nights and lost revenue. Monitor your net occupancy rate by subtracting cancellations from total bookings. A listing with 90% gross occupancy but 20% cancellation rate effectively operates at 72% net occupancy. Adjust your pricing and policies to mitigate these gaps.
Validate with real-world examples
Consider two hosts in the same neighborhood. Host A charges $100/night with 90% occupancy, generating $2,700/month. Host B charges $150/night with 60% occupancy, generating $2,700/month. However, Host B likely incurs lower cleaning costs and maintenance wear per booking. When factoring in operational costs, Host B often achieves higher net profit despite lower occupancy. This illustrates why reading occupancy rates requires a holistic view of revenue and expenses.
Validate projections with an ROI calculator
Raw occupancy data is only useful if it translates into net income. Use an ROI calculator to input your adjusted assumptions and verify financial viability before committing capital. This step separates theoretical yield from actual cash flow.
Run the numbers
Enter your projected nightly rate and adjusted occupancy percentage into the calculator. The tool should subtract fixed costs (taxes, insurance, management fees) and variable expenses (cleaning, supplies) to reveal the net operating income. If the resulting cash-on-cash return does not meet your hurdle rate, the property is not viable at these numbers.
-
Verify data source is current and location-specific
-
Check seasonality adjustments in your occupancy model
-
Account for vacancy days beyond standard market averages
Compare and adjust
Run three scenarios: conservative, moderate, and aggressive. The conservative model should use the lower bound of your occupancy estimate. If the property fails the conservative test, the risk is too high. Adjust your entry price or operating expenses until all three scenarios yield positive returns. This stress-testing ensures you are protected against market downturns.
No comments yet. Be the first to share your thoughts!