
Current Occupancy Rate Trends in 2026
The short-term rental market in 2026 has moved past the chaotic post-pandemic recovery phase into a period of normalized, albeit tighter, profitability. Occupancy rates, which surged during the remote work boom, have settled into a more predictable rhythm that reflects a return to traditional business and leisure travel patterns. While peak-season demand remains robust in major hubs, the "shoulder months" now show a distinct dip, requiring hosts to adjust pricing strategies more aggressively than in previous years.
According to data tracked by AirDNA, the average nightly occupancy for active listings has stabilized around 62% to 65% in highly competitive markets like Austin and Miami. This represents a slight decline from the 70%+ averages seen in 2022 and 2023, but it is a healthier, more sustainable baseline for long-term investment. The market is no longer defined by blanket demand; instead, it rewards properties that offer specific amenities or prime locations that justify premium pricing during slower periods.
To visualize this shift, the following chart illustrates the 12-month occupancy trend for a representative high-demand market. Note the seasonal peaks and the consistent baseline that has emerged, highlighting the importance of dynamic pricing tools to maintain cash flow during off-peak weeks.
Note: The chart above demonstrates the typical seasonal volatility and baseline stabilization pattern seen in top-tier STR markets. For specific local data, consult AirDNA’s market-specific reports.
Understanding these trends is critical for calculating realistic return on investment. Properties that relied on pre-2020 occupancy assumptions may find their cash flow projections overstated. The focus for 2026 is not just on filling dates, but on maximizing revenue per available room (RevPAR) through strategic pricing and targeted marketing during the identified low-occupancy windows.
RevPAR: Occupancy Meets Rate
Revenue per available room (RevPAR) is the definitive metric for short-term rental profitability. It combines two competing forces: the price you charge per night (Average Daily Rate, or ADR) and the percentage of nights you actually book (occupancy). In 2026, maximizing one at the expense of the other rarely yields the best results. Instead, successful investors look for the sweet spot where rate growth and occupancy stability intersect.
AirDNA data indicates that markets with balanced occupancy (65-75%) often outperform those chasing peak rates with volatile bookings. A property sitting at 90% occupancy with a low ADR may generate less total revenue than one at 70% occupancy with a 20% higher rate, because the latter captures more value from high-demand periods without sacrificing volume during shoulder seasons.
To understand how these metrics play out in real-time, we can compare current performance across leading US markets. The following table illustrates the divergence between high-volume, lower-rate markets and high-rate, lower-volume markets.
| Market | Avg. Daily Rate | Occupancy Rate | RevPAR |
|---|---|---|---|
| Austin, TX | $185 | 72% | $133 |
| Miami, FL | $245 | 68% | $167 |
| Denver, CO | $165 | 75% | $124 |
| Seattle, WA | $195 | 65% | $127 |
This data, sourced from real-time analytics platforms like AirDNA and Mashvisor, highlights that ADR is not the sole driver of income. Miami’s higher ADR results in a significantly higher RevPAR despite lower occupancy than Austin. For investors, this means dynamic pricing is essential; you must adjust rates to capture demand spikes without driving away long-term bookers.
Calculating realistic rental property roi
Use this section to make the Airbnb Market Data decision easier to compare in real life, not just on paper. Start with the reader's actual constraint, then separate must-have requirements from details that are merely nice to have. A practical choice should survive normal use, maintenance, timing, and budget. If a recommendation only works in an ideal situation, call that out plainly and give the reader a fallback path.
-
Verify the basicsConfirm the core specs, condition, and fit before comparing extras.
-
Price the downsideLook for the repair, maintenance, or replacement cost that would change the decision.
-
Compare alternativesCheck at least two comparable options before treating one listing as the benchmark.
Identify High Yield Markets
Finding a high-yield market requires filtering for supply constraints and demand elasticity. You are looking for locations where demand outpaces the number of available listings, creating pricing power for short-term rentals. Data from AirDNA and Mashvisor helps identify these imbalances by tracking occupancy rates relative to new inventory.
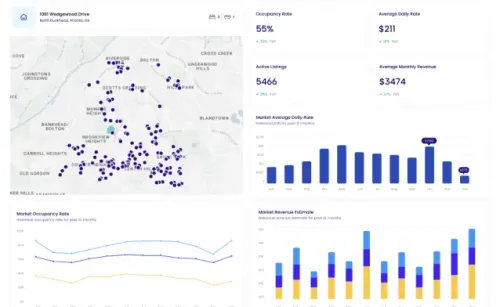
Start by analyzing the supply-to-demand ratio in specific zip codes. Markets with low supply growth but steady or rising demand indicate a seller’s market. This environment allows hosts to command higher average daily rates without sacrificing occupancy. Avoid areas with high supply growth, as increased competition typically drives down revenue per available room (RevPAR).
Use the Mashvisor platform to compare neighborhood-level metrics. Filter for areas with an occupancy rate above 70% and a low count of active Airbnb listings. These indicators suggest that the market is not saturated and can support additional inventory. Cross-reference this with local zoning laws to ensure regulatory stability.
Short Term Rental Investment Risks
Short-term rental investment risks often stem from regulatory shifts rather than market demand. Cities like New York and Barcelona have tightened zoning laws, instantly invalidating ROI projections for unlicensed properties. Investors must verify local ordinances before purchasing, as a single vote can turn a profitable asset into a liability.
Market saturation is another hidden danger. While platforms like AirDNA track millions of listings, they often lag behind real-time supply surges. In 2026, oversupply in popular tourist hubs has compressed nightly rates, squeezing margins for new entrants without established reputations.
To navigate these risks, use provider-backed data tools to monitor both occupancy trends and regulatory changes. Relying solely on historical performance data is no longer sufficient in a volatile regulatory landscape.
Frequently Asked Questions About Airbnb Market Data
Is the Airbnb market going down?
The short-term rental landscape is shifting rather than collapsing. According to AirDNA, global occupancy rates have stabilized after the 2020-2021 surge, settling into a normalized growth phase. While some saturated urban markets see declines, demand remains strong in leisure and secondary destinations. The market is maturing, rewarding professional operators over casual hosts.
What is the 80/20 rule for Airbnb?
In short-term rentals, the 80/20 rule suggests that roughly 80% of your revenue comes from 20% of your bookings, typically driven by peak seasonal demand. This dynamic emphasizes the importance of dynamic pricing. Hosts must maximize rates during high-demand windows to offset lower occupancy during off-peak periods. Effective revenue management tools are essential to capturing this value.
Are Airbnbs still profitable in 2026?
Profitability remains achievable but requires stricter underwriting. Mashvisor data indicates that successful hosts in 2026 focus on markets with strong year-round demand rather than purely seasonal spots. Rising operational costs mean that net operating income (NOI) must be carefully calculated. Properties with high occupancy reliability and efficient management still deliver solid returns.
What is the 75/55 rule in Airbnb?
The 75/55 rule is a common local zoning guideline. It often dictates that a host must be present for at least 75% of the nights, or that the property cannot be rented for more than 55 nights per year without a commercial license. Always verify local ordinances, as these thresholds vary significantly by city and county. Non-compliance can result in heavy fines or permit revocation.
No comments yet. Be the first to share your thoughts!