
How the Airbnb Revenue Calculator Works
An Airbnb revenue calculator estimates your potential rental income by combining local market data with your specific property details. Instead of guessing, these tools use real short-term rental comparables to project occupancy rates and average daily rates (ADR) for your address.
The core formula is straightforward: multiply your projected occupancy rate by your average daily rate, then subtract operating expenses. This gives you a realistic view of net profit rather than just gross revenue. Tools like AirDNA and Rabbu update their data weekly to reflect current market shifts.
Why Simple Math Fails Without Market Data
You might think calculating revenue is just multiplying a nightly rate by 365 days. That approach ignores seasonality, local regulations, and competition. A calculator fills this gap by analyzing how similar properties actually perform in your neighborhood.
Without accurate local comps, your projections will be off. Rising occupancy rates in 2026 mean that static assumptions from previous years are no longer reliable. Using a dedicated calculator ensures you account for the specific demand drivers affecting your market.
Key Metrics to Watch
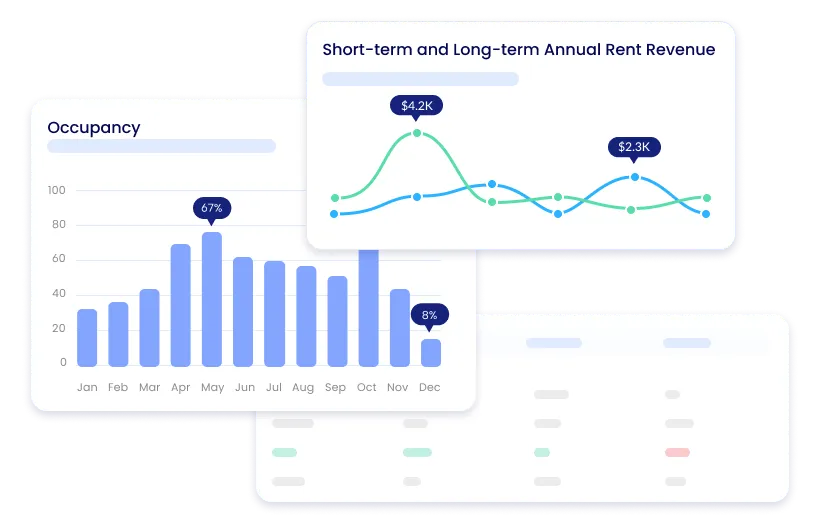
When reviewing calculator results, focus on three main metrics:
- Occupancy Rate: The percentage of nights booked. This is often the biggest variable.
- Average Daily Rate (ADR): The average price per night after discounts.
- Net Profit: Revenue minus cleaning fees, platform fees, taxes, and maintenance.
Choosing the Right Tool
Different calculators offer varying levels of detail. AirDNA provides comprehensive market data, while Rabbu focuses on U.S. market specifics. Both are free to start, allowing you to test different scenarios before committing to a listing strategy.
Airbnb revenue choices that change the plan
No single Airbnb revenue calculator is perfect. Each tool uses different data sources and assumptions, which can lead to significantly different projections for the same property. Understanding these tradeoffs helps you choose the right calculator for your specific market and property type.
The main differences lie in data freshness, geographic coverage, and the complexity of the revenue models. Some tools rely heavily on AirDNA’s aggregated data, while others use direct booking data or proprietary algorithms. Accuracy varies by market, with tools performing better in high-density urban areas than in rural or emerging markets.
| Feature | AirDNA Rentalizer | Rabbu | BNBCalc | Airbnb Tool |
|---|---|---|---|---|
| Data Source | AirDNA Aggregated | Weekly Updated | BNBCalc Proprietary | Airbnb Booking Data |
| Geographic Scope | Global | U.S. Focus | U.S. Focus | Global |
| Cost | Free to Start | Free | Free | Free |
| Revenue Model | ADR & Occupancy | ADR & Occupancy | ADR & Occupancy | Direct Booking Data |
| Complexity | High | Medium | Medium | Low |
Start with a broad overview using Airbnb’s official interactive tool, which pulls directly from booking data. Then, cross-reference with a specialized calculator like AirDNA or Rabbu for deeper market insights. Compare the outputs to identify the range of potential revenue, rather than relying on a single number.
| Feature | AirDNA | Rabbu | BNBCalc | Airbnb Tool |
|---|---|---|---|---|
| Data Source | AirDNA Aggregated | Weekly Updated | BNBCalc Proprietary | Airbnb Booking Data |
| Geographic Scope | Global | U.S. Focus | U.S. Focus | Global |
| Cost | Free to Start | Free | Free | Free |
| Revenue Model | ADR & Occupancy | ADR & Occupancy | ADR & Occupancy | Direct Booking Data |
| Complexity | High | Medium | Medium | Low |
How to choose the right Airbnb revenue calculator
Selecting the right tool depends on whether you need quick estimates or deep market intelligence. The best calculators bridge the gap between theoretical occupancy rates and the actual bookings you can expect in your specific neighborhood.
AirDNA: Best for comprehensive market data
AirDNA is the industry standard for short-term rental analytics. It provides the most robust data on occupancy trends and average daily rates (ADR) by using real booking data from thousands of listings. This depth makes it ideal for investors analyzing new markets or refining pricing strategies for existing properties.
Rabbu: Best for quick U.S. income estimates
Rabbu offers a streamlined approach focused on U.S. markets. It updates data weekly to reflect current seasonal shifts and provides clear projections for revenue and profit potential. Its interface is simpler than AirDNA’s, making it a practical choice for hosts who need fast, actionable insights without navigating complex dashboards.
Airbtics: Best for detailed financial breakdowns
Airbtics focuses on the financial side of short-term rentals. It helps you calculate net operating income by accounting for expenses like cleaning, utilities, and platform fees. This level of detail is essential for understanding your true profitability and making informed decisions about property management costs.
PriceLabs: Best for dynamic pricing integration
While primarily a dynamic pricing tool, PriceLabs includes a robust revenue calculator that integrates directly with your listing. It uses machine learning to adjust prices based on demand, providing real-time revenue forecasts. This is ideal for hosts who want to optimize income automatically while tracking performance.
Renter: Best for multi-property portfolios
Renter is designed for hosts managing multiple properties. It consolidates data from various platforms and provides a unified view of your portfolio’s performance. This centralization saves time and helps identify which properties are driving the most profit, allowing for better resource allocation.
Avoiding Misleading Revenue Estimates
Many online calculators inflate potential earnings by ignoring real-world friction. A common mistake is assuming 100% occupancy or using average daily rates (ADR) without adjusting for seasonal dips. When rising occupancy rates reshape the market, these small errors compound into significant ROI overestimations.
The Occupancy Rate Trap
Most basic tools default to historical averages that don’t reflect current market saturation. If you’re projecting a 75% occupancy rate based on last year’s data, you’re likely missing the impact of new supply. Always use tools that pull real-time, location-specific comp data rather than static industry averages.
Hidden Costs and Net Profit
Revenue isn’t profit. A misleading calculator might show a high gross income but exclude cleaning fees, platform service charges, property management costs, and maintenance reserves. To get an accurate ROI, you need a calculator that deducts these operational expenses from your gross revenue to show true net profit.
Static vs. Dynamic Data
Avoid tools that rely on outdated snapshots. The best Airbnb revenue calculators update their data weekly to reflect changes in demand, local regulations, and competitor pricing. Dynamic data ensures your projections remain relevant as the market shifts, preventing costly surprises when you launch your rental.
Airbnb revenue: what to check next
How do you calculate how much you can make on Airbnb?
The most direct way to estimate your Airbnb revenue is by multiplying your year-round occupancy rate by your average daily rate (ADR). To get accurate numbers, pull data from at least 10 comparable listings in your immediate area rather than relying on broad city averages. Tools like AirDNA or BNBCalc automate this by analyzing recent booking data for similar properties.
Do Airbnb calculators give exact income predictions?
No calculator can guarantee exact earnings because they rely on historical data and projected market trends. Actual income fluctuates based on seasonal demand, local regulations, and your specific marketing efforts. Treat these projections as a baseline for feasibility rather than a fixed promise of cash flow.
Which Airbnb calculator is best for ROI analysis?
For detailed return on investment (ROI) metrics, AirDNA and AirbnbROI are strong choices. AirDNA offers the most comprehensive market comparables, while AirbnbROI specifically calculates Cap Rate and DSCR (Debt Service Coverage Ratio). These tools help you understand not just gross revenue, but how the property performs against your mortgage and operating costs.
How accurate are free Airbnb income estimates?
Free calculators are generally accurate for gross revenue projections if you input realistic occupancy and ADR figures. However, they often exclude hidden expenses like cleaning fees, platform commissions, and maintenance. Always subtract at least 25-30% from the gross estimate to account for these operational costs and determine your true net profit.
No comments yet. Be the first to share your thoughts!