
The national occupancy snapshot
National Airbnb occupancy is hovering around 62% right now. That is down from the 68% peak we saw in summer 2023, but it is not a crisis. The market is just cooling off after the post-pandemic travel frenzy.
Several factors are impacting current rates. Persistent inflation continues to influence consumer spending, causing some travelers to opt for more budget-friendly accommodations or curtail travel plans altogether. However, this is partially offset by a sustained demand for unique travel experiences and the continued growth of remote work, which allows for longer stays and increased flexibility in travel destinations.
Interestingly, we’re seeing a divergence in performance based on property type. Entire homes are maintaining higher occupancy rates—around 65%—while private rooms are lagging at approximately 55%. This suggests a preference for privacy and self-sufficiency among travelers. We also see a correlation between professionally managed properties and higher occupancy, suggesting effective revenue management and marketing contribute to success.
What 2026 looks like
Predicting Airbnb occupancy rates for 2026 requires a nuanced approach. Our projections are based on data from AirDNA and Airbtics, coupled with economic forecasts from sources like the Bureau of Economic Analysis. We’re assuming moderate economic growth—around 2.5% annually—and a continued, though decelerating, increase in international travel.
The model incorporates several key variables: new property listings, which can dilute occupancy if supply outpaces demand; changes in travel preferences, such as a potential shift towards more sustainable tourism; and the impact of potential regulatory changes in key markets. We've also factored in the possibility of unforeseen events, like economic recessions or global health crises, which could significantly impact travel patterns.
Based on this modeling, we anticipate a national average occupancy rate of between 60% and 65% in 2026. This range reflects the inherent uncertainty in forecasting. It’s important to note that these are averages, and actual occupancy rates will vary considerably by city and property type. The potential for increased competition from new short-term rental platforms is also a factor, though its impact remains difficult to quantify.
A significant challenge is accurately predicting the pace of new listings. While current growth is slowing, a sudden influx of properties could easily suppress occupancy rates. We’re also monitoring the impact of longer-term rental conversions; as the housing market shifts, some landlords may choose to revert to traditional long-term rentals, reducing the supply of Airbnb properties.
Projected National Airbnb Occupancy Rates (2024-2026) with Confidence Intervals
Data: AI-generated estimate for illustration
Cities with the highest demand
Looking ahead to 2026, several cities are poised to lead in Airbnb occupancy. Miami, Florida, is projected to maintain a high occupancy rate of around 78%, driven by its status as a premier tourist destination and a growing hub for business travel. This consistent demand is bolstered by a year-round warm climate and a vibrant cultural scene.
Nashville, Tennessee, is also expected to perform strongly, with an estimated occupancy rate of 75%. The city’s popularity as a music and entertainment destination continues to attract a large number of visitors. However, the rapid growth in short-term rentals in Nashville is creating increased competition, and regulatory scrutiny is also rising.
New Orleans, Louisiana, anticipates an occupancy rate of approximately 72%. The city’s unique cultural heritage and lively atmosphere consistently draw tourists, particularly during festivals and events. However, New Orleans is also vulnerable to hurricanes, which can disrupt travel and impact occupancy.
Savannah, Georgia, is emerging as a strong performer, with a projected occupancy rate of 70%. Its historic charm and relatively affordable prices are attracting a growing number of visitors. Austin, Texas, is forecasted at 68%, benefiting from its tech industry and lively music scene. Seattle, Washington, rounds out our top performers at 66%, driven by a strong economy and its proximity to outdoor recreation.
Seasonality dictates the revenue in these spots. Miami and New Orleans peak during spring break and Mardi Gras, while Nashville fills up during music festivals. If you aren't timing your price hikes to these dates, you're leaving money on the table.
Projected Airbnb Performance: Top 10 Cities - 2026
| City | Occupancy Rate (Annual Average) | Average Daily Rate (ADR) | Revenue Per Available Rental (RevPAR) | Seasonality (Peak vs. Off-Peak Occupancy Difference) |
|---|---|---|---|---|
| Miami, FL | 78.5% | $285 | $224 | Peak Season (Dec-Apr): +35% over off-peak |
| Orlando, FL | 75.2% | $210 | $158 | Peak Season (Summer/Holidays): +40% over off-peak |
| New York, NY | 72.8% | $310 | $226 | Peak Season (May-Sept): +20% over off-peak |
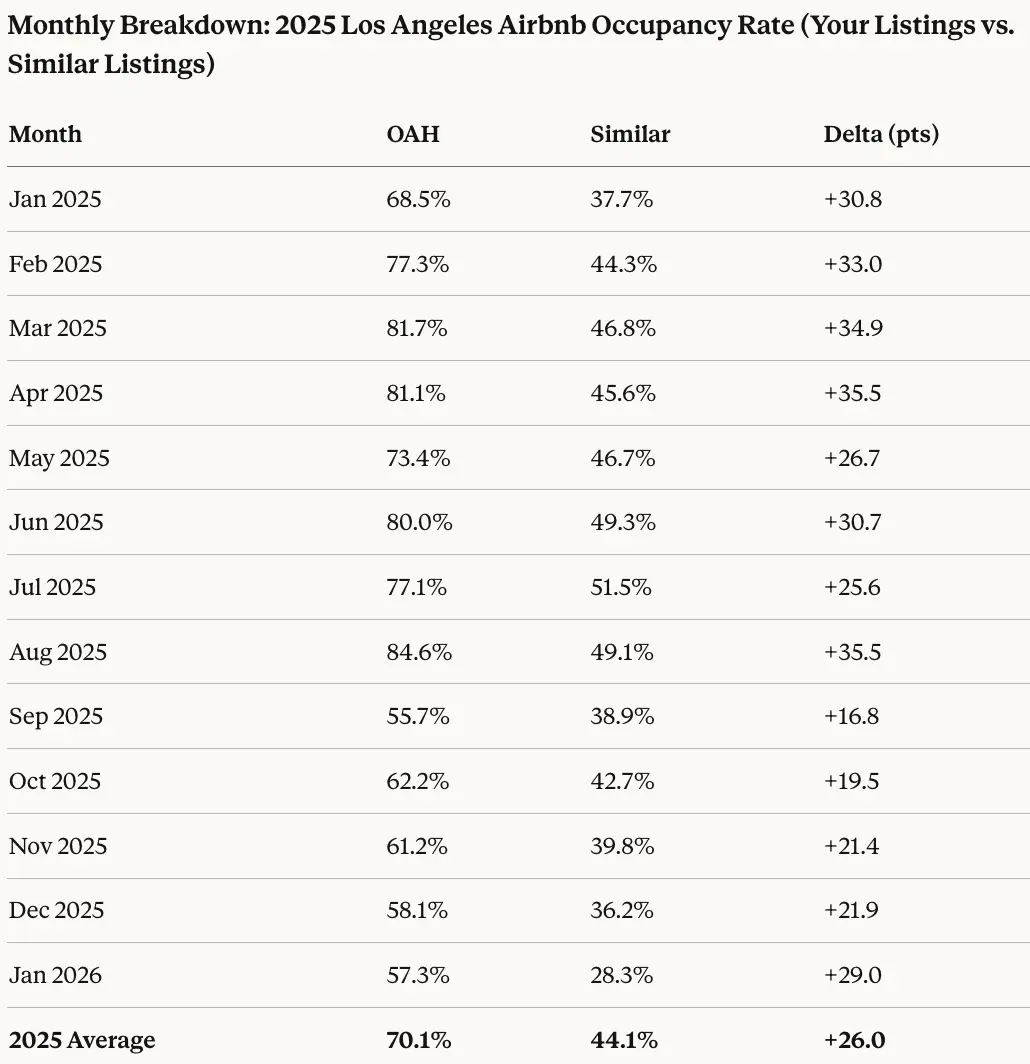
| Los Angeles, CA | 70.1% | $250 | $175 | Peak Season (Summer/Holidays): +25% over off-peak |
| Nashville, TN | 74.3% | $195 | $145 | Peak Season (Spring/Fall): +30% over off-peak |
| Las Vegas, NV | 71.9% | $175 | $126 | Peak Season (Weekends/Events): +50% over off-peak |
| New Orleans, LA | 68.7% | $220 | $151 | Peak Season (Mardi Gras/Festivals): +60% over off-peak |
| Phoenix, AZ | 69.4% | $180 | $125 | Peak Season (Winter): +30% over off-peak |
Illustrative comparison based on the article research brief. Verify current pricing, limits, and product details in the official docs before relying on it.
Seasonal Fluctuations: Peak and Off-Peak
Airbnb occupancy rates are inherently seasonal. Across the US, peak seasons generally occur during the summer months (June-August) and around major holidays like Christmas and New Year’s. Coastal destinations, like Florida and California, experience another peak during the spring break season. These periods are characterized by higher demand and premium pricing.
Conversely, off-peak seasons—typically fall and winter (excluding holidays)—see lower occupancy rates and increased price competition. However, these periods can present opportunities for savvy hosts. Shoulder seasons—spring and late fall—often offer a sweet spot between higher demand and moderate pricing. Targeting these periods can maximize revenue without relying solely on peak-season demand.
The impact of seasonality varies by region. Mountain destinations, like those in Colorado and Utah, experience peak demand during the winter ski season. Desert destinations, like Arizona and Nevada, see increased occupancy during the cooler months. Hosts should tailor their marketing and pricing strategies to align with these regional variations.
In 2026, we expect these seasonal patterns to persist. However, the increasing flexibility of remote work may moderate some of the traditional seasonal fluctuations, as travelers are less constrained by school schedules and work commitments. This could lead to more consistent occupancy rates throughout the year, particularly in destinations with attractive year-round amenities.
What guests are actually booking
The type of home you list matters more than the location sometimes. Entire homes are at 65% occupancy nationally, while private rooms struggle at 55%. People want their own space and a kitchen, not a shared hallway with a stranger.
Amenities also play a crucial role. Properties with pools, hot tubs, and fully equipped kitchens tend to have higher occupancy rates. Pet-friendly properties are also in high demand, particularly among families and long-term travelers. Listings with high-speed internet are essential for remote workers.
Luxury properties—those with high-end finishes and premium amenities—appear to be more resilient during economic downturns. While they may experience a slight dip in occupancy during periods of recession, they tend to recover more quickly than other property types. This suggests that affluent travelers are less sensitive to economic fluctuations.
The demand for specific property types is also evolving. We’re seeing increased interest in unique accommodations, such as tiny homes, yurts, and treehouses. These properties offer a distinct travel experience and can command premium pricing. However, they may also appeal to a niche market, limiting their overall occupancy potential.
- Entire homes: 65%
- Private Rooms: 55% occupancy
- Shared Rooms: 48% occupancy
High-Correlation Amenities
- Wi-Fi - Consistent, high-speed internet access remains a foundational expectation for modern travelers, impacting booking decisions across all property types.
- Fully Equipped Kitchen - Properties offering complete kitchen facilities (oven, stovetop, refrigerator, microwave, cookware) demonstrate increased demand, particularly for longer stays as reported by AirDNA.
- Washer & Dryer - In-unit laundry facilities correlate positively with occupancy, providing convenience and reducing the need for external laundry services.
- Air Conditioning - A critical amenity in warmer climates, and increasingly desirable even in temperate regions, directly influencing booking rates during peak seasons.
- Dedicated Workspace - The rise of remote work has elevated the importance of dedicated workspaces (desk, chair, adequate lighting), attracting digital nomads and business travelers.
- Parking - Free, on-site parking is a significant advantage, especially in urban areas with limited or expensive parking options.
- Pet-Friendly Policies - Listings that explicitly welcome pets can tap into a growing segment of travelers, although management considerations are important.
Regional Differences: Emerging Markets
Beyond the established Airbnb markets, several regions are showing promising growth in occupancy rates. The Smoky Mountains region of Tennessee and North Carolina is experiencing a surge in demand, driven by its natural beauty and outdoor recreation opportunities. Occupancy rates in this area are approaching those of more established markets.
The Gulf Coast of Florida, including destinations like Fort Myers and Naples, is also emerging as a popular Airbnb destination. The area’s warm climate, pristine beaches, and affordable prices are attracting a growing number of visitors. However, the region is also vulnerable to hurricanes, which can disrupt travel.
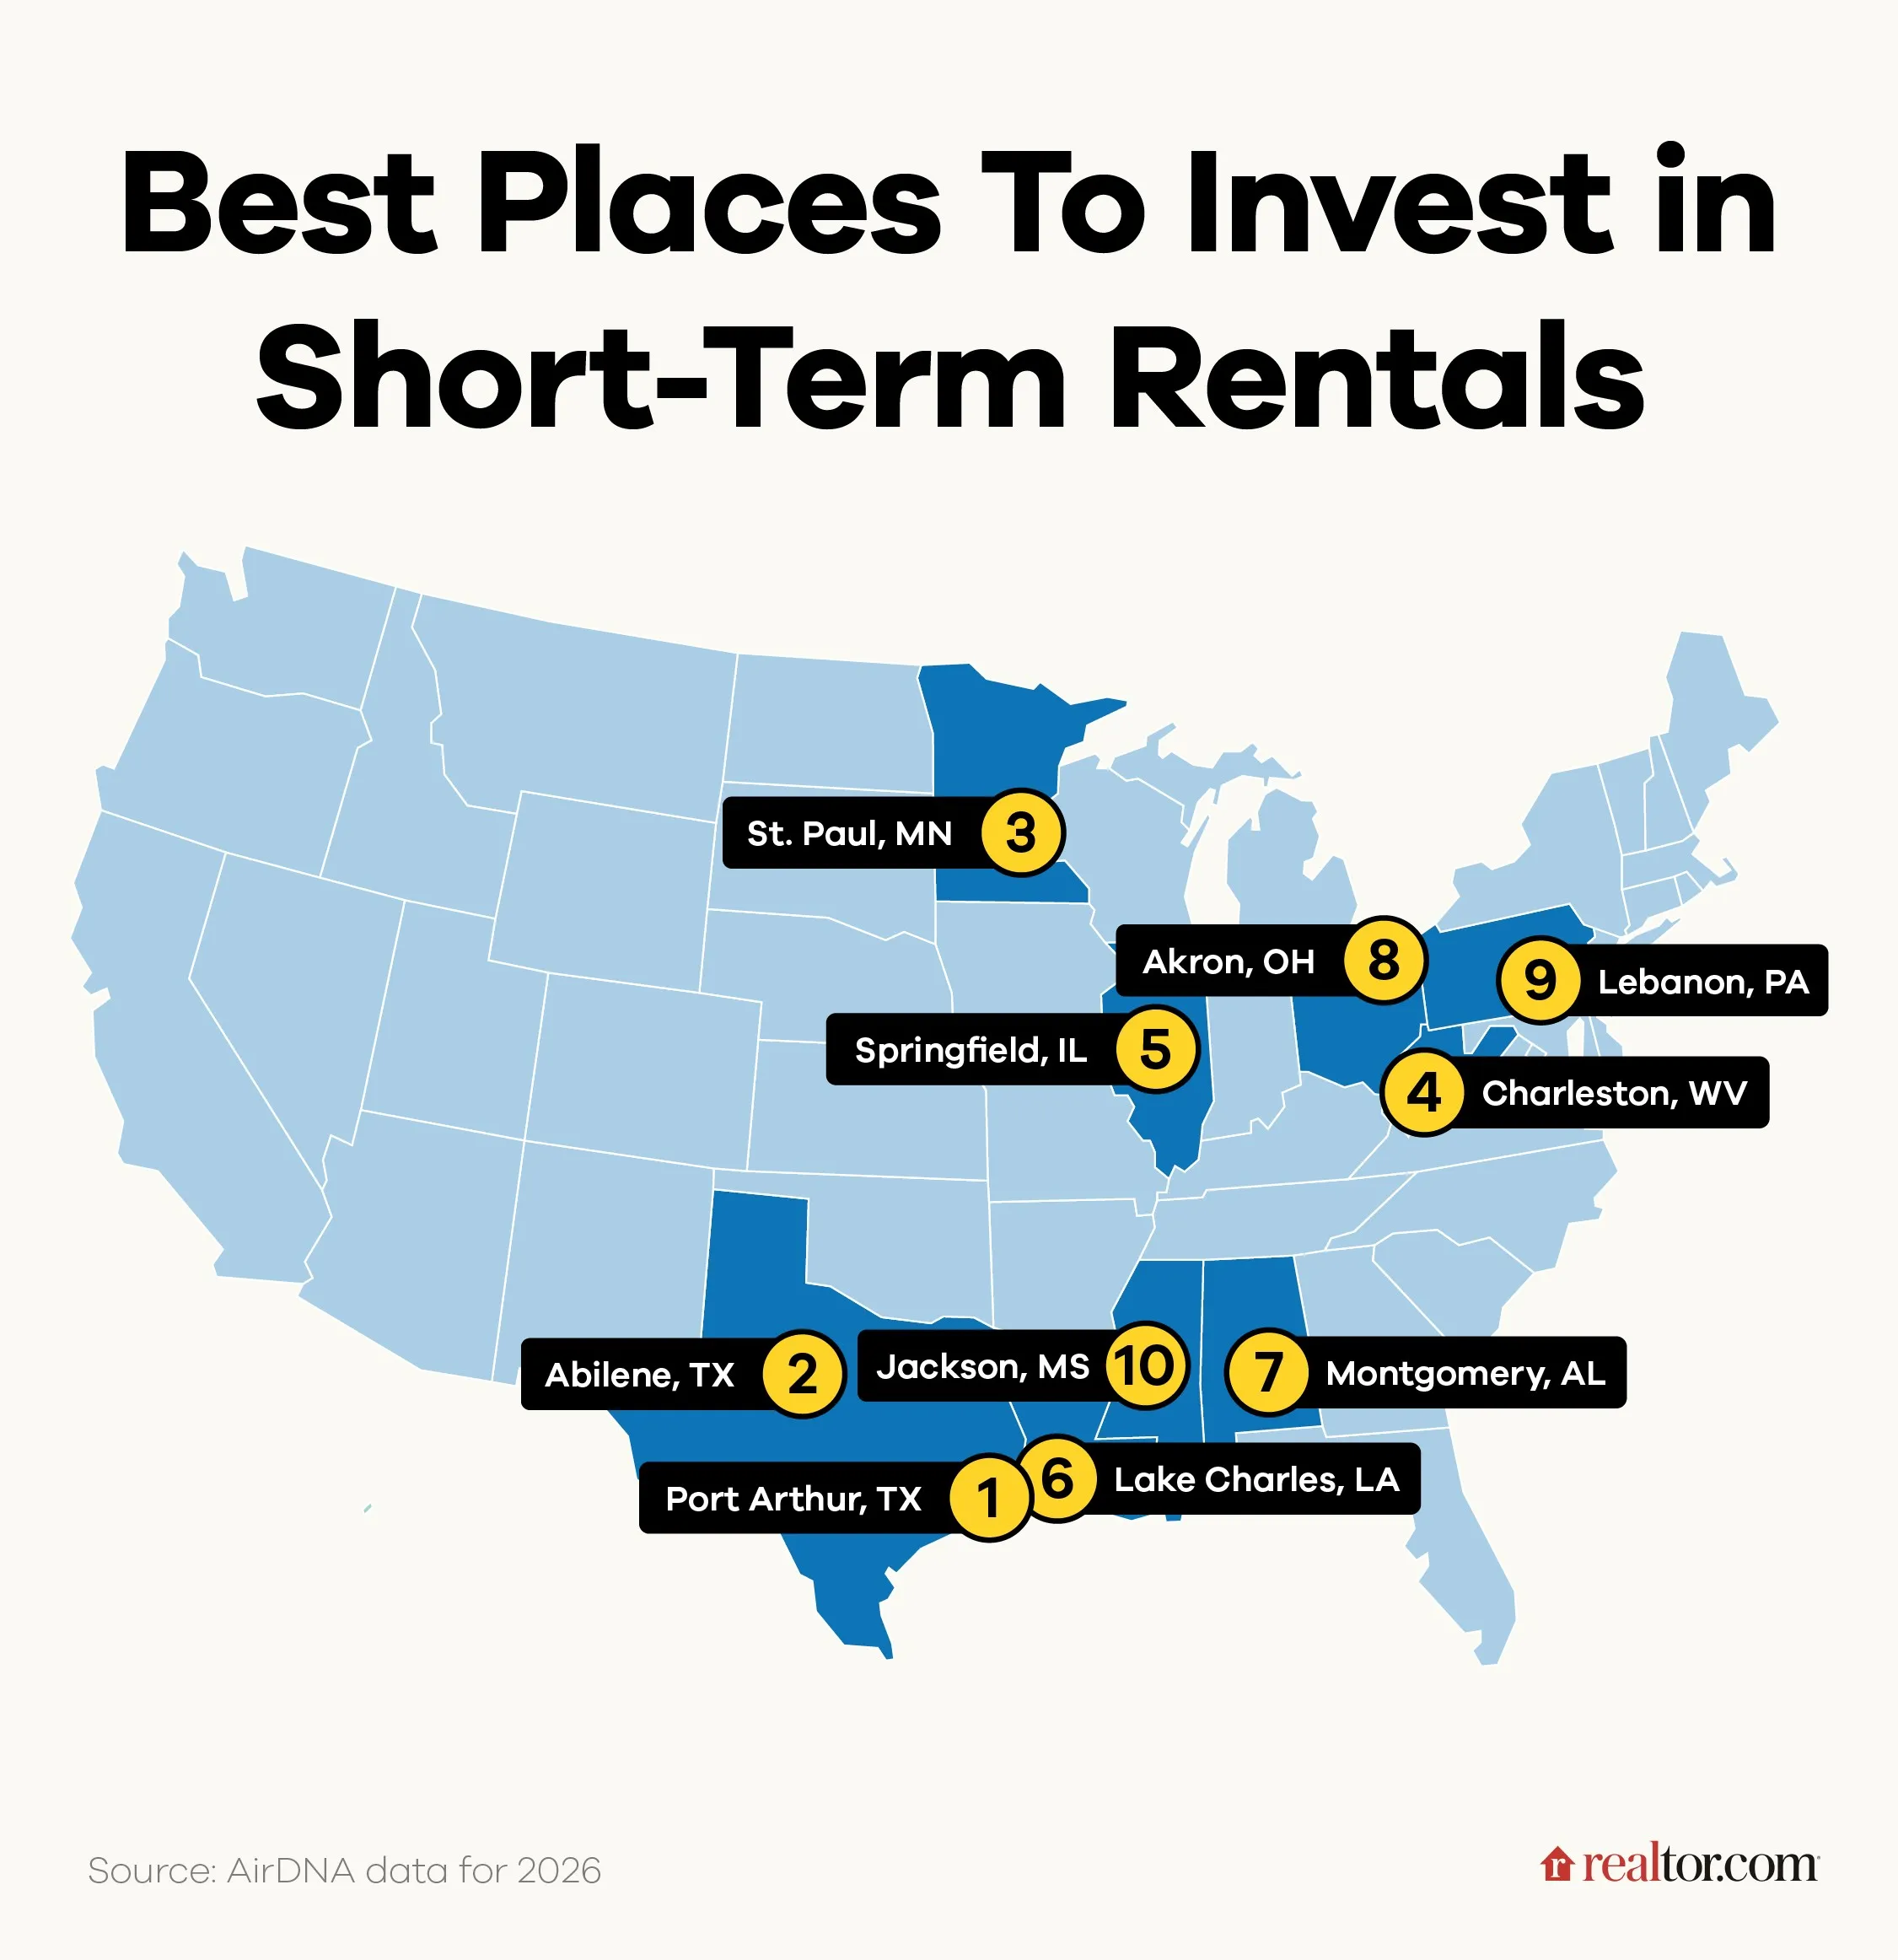
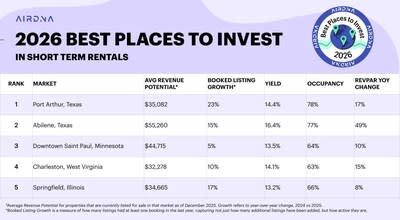
Smaller cities with strong local economies are also showing potential. Cities like Boise, Idaho, and Chattanooga, Tennessee, are attracting a growing number of remote workers and entrepreneurs, driving demand for short-term rentals. These markets often offer better investment opportunities than more saturated markets.
We’re also seeing increased interest in rural destinations, as travelers seek to escape the crowds and connect with nature. Areas like the Catskills in New York and the Berkshires in Massachusetts are experiencing a surge in demand. This trend suggests a shift in travel preferences towards more authentic and off-the-beaten-path experiences.
It’s true many @airbnb_au owners will just raise their rates to cover most or all of this new 7.5% tax, but that doesn’t make this law a bad thing.
— MFWitches (@MFWitches) September 20, 2023
First, because the tax will still go to build more social housing, and second because Airbnb occupancy rates should fall (because… pic.twitter.com/We9eHZ0Zf6


No comments yet. Be the first to share your thoughts!