
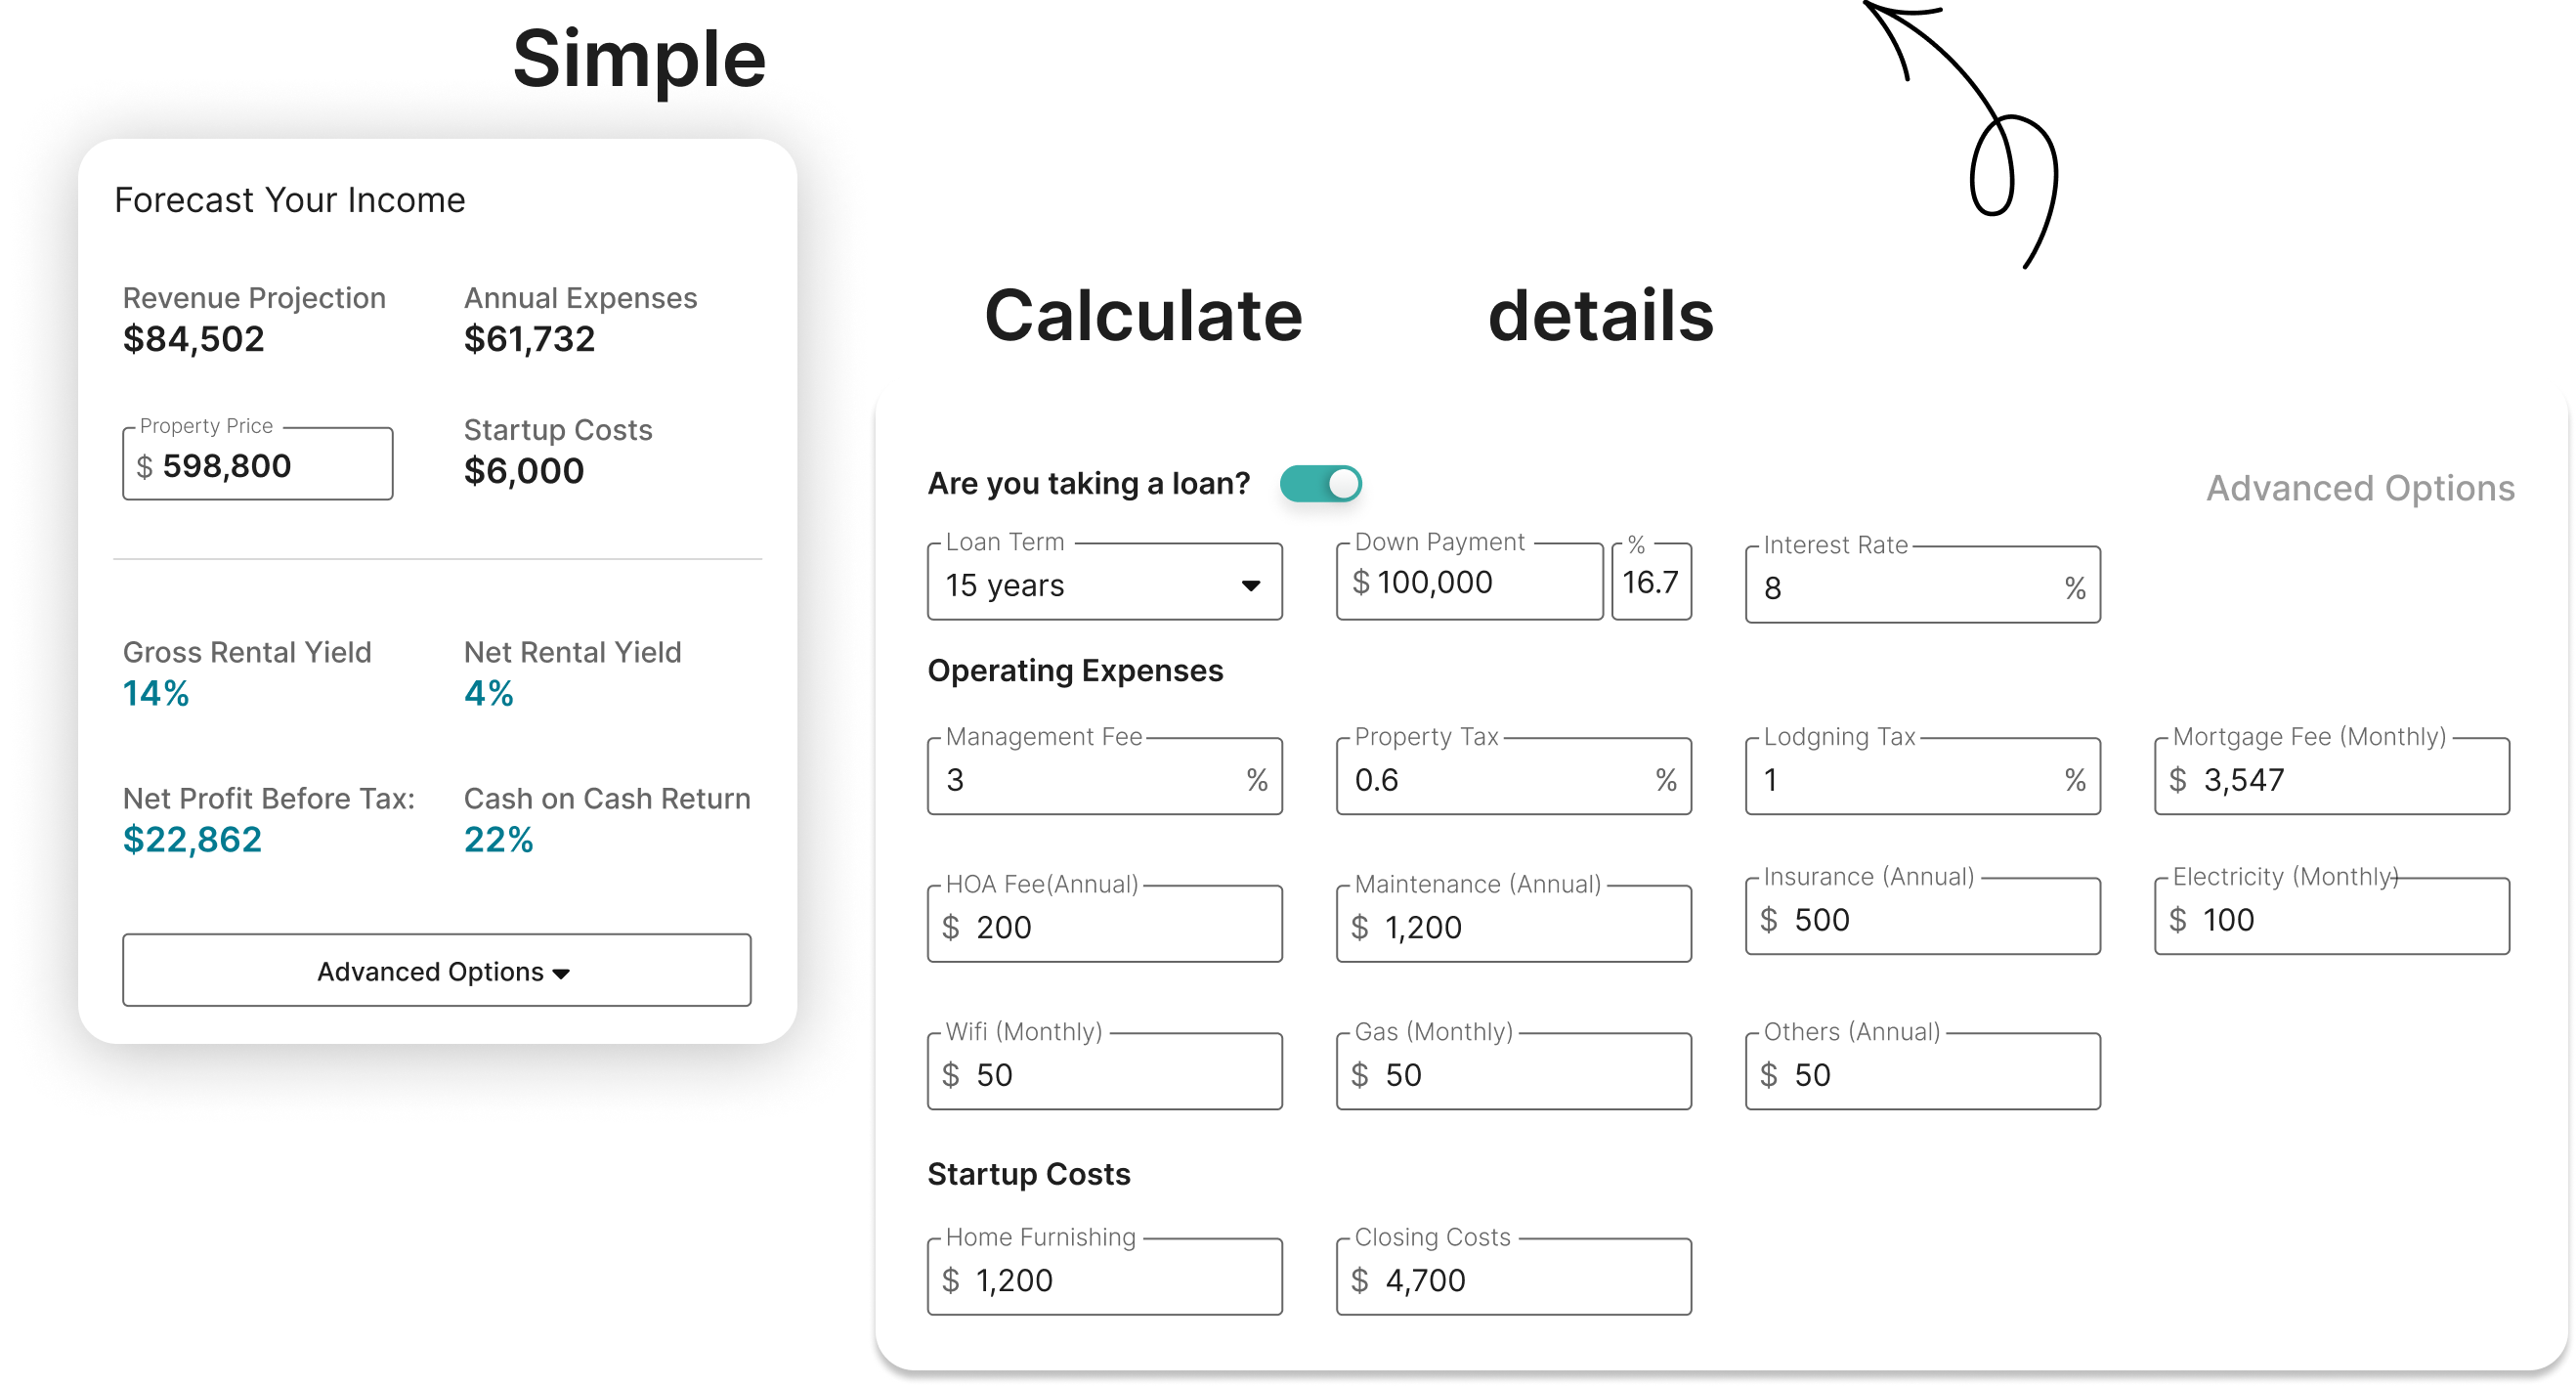
roi beyond rate and occupancy
The old formula of (revenue - expenses) / investment doesn't cut it anymore. By 2026, the rental market is too volatile for simple math. I've seen that a real assessment of ROI now has to weigh risk and opportunity cost as much as raw profit.
The rise of artificial intelligence and the proliferation of data analytics tools are driving this change. AI isn’t just about automating tasks; it's about identifying patterns and making predictions that humans can’t. Early examples of this included dynamic pricing engines adjusting rates based on demand, and basic predictive analytics suggesting optimal booking windows. Now, the capabilities are far more sophisticated, predicting not just if a property will book, but when, at what price, and against what competition.
This represents a fundamental shift. Instead of looking solely at past performance, investors now have access to tools that estimate future performance with increasing accuracy. This necessitates a re-evaluation of traditional investment metrics and an embrace of more nuanced analytical approaches. We're moving toward a world where ROI is less about what has happened, and more about what will happen, informed by intelligent data analysis.
airdna adapt and predictive modeling
AirDNA Adapt, as detailed on airdna.co, represents a significant leap forward in vacation rental analytics. It’s not merely a reporting tool showcasing historical occupancy and rates; it’s a predictive model designed to forecast future performance. This is a critical distinction. Adapt leverages a vast dataset encompassing millions of listings across the globe, but its value lies in its ability to extrapolate from that data to predict future trends.
The platform incorporates a wide array of data points, including historical booking data, seasonality, local events, point-of-interest proximity, and even macroeconomic indicators. It attempts to account for factors like school holidays, festivals, and major conferences, adjusting its projections accordingly. This is a substantial improvement over methods relying solely on year-over-year comparisons, which can be easily skewed by unforeseen circumstances.
Don't bet the house on these models. They are only as good as the data they eat. A sudden shift in travel patterns or a local policy change can make the most expensive software look foolish. I treat these predictions as educated guesses, not guarantees.
Beyond Revenue: Total Cost of Ownership (TCO)
A comprehensive ROI calculation extends far beyond simply subtracting revenue from expenses. It requires a thorough accounting of the total cost of ownership (TCO), encompassing all expenses associated with the property, both direct and indirect. This includes, of course, the initial property price, but also ongoing costs like property taxes, insurance, maintenance, utilities, and property management fees.
AI analytics platforms are increasingly integrating TCO calculations into their dashboards, providing investors with a more holistic view of profitability. These platforms can identify hidden costs that might otherwise be overlooked, such as inefficient appliances consuming excessive energy, or high water bills indicating potential leaks. They can even estimate vacancy losses based on historical occupancy data and market trends.
Considering TCO is particularly important in highly competitive markets where seemingly small differences in operating costs can significantly impact the bottom line. Ignoring these costs can lead to an inflated ROI estimate and ultimately, a poor investment decision. A true understanding of TCO allows for more accurate performance comparisons between different properties and markets.
Total Cost of Ownership (TCO) Tracking Capabilities: Property Management Software Comparison - 2026 Assessment
| Software Name | Automated Expense Tracking | Maintenance Request Integration | Utility Bill Upload | Reporting Granularity |
|---|---|---|---|---|
| Hostaway | Good | Good | Fair | Good |
| Lodgify | Fair | Fair | Fair | Fair |
| Smoobu | Good | Good | Fair | Good |
| iGMS | Excellent | Excellent | Good | Excellent |
| OwnerRez | Good | Good | Good | Excellent |
| Guesty | Excellent | Excellent | Excellent | Excellent |
Illustrative comparison based on the article research brief. Verify current pricing, limits, and product details in the official docs before relying on it.
Airbtics and Competitive Rate Intelligence
Airbtics, as highlighted on airbtics.com, excels at providing investors with competitive rate intelligence. Understanding the competitive landscape is paramount in maximizing revenue and optimizing pricing strategies. Airbtics doesn’t just show you average daily rates (ADR) and occupancy rates; it provides granular data on comparable properties in your target market, allowing you to benchmark your own performance.
The platform tracks a wide range of metrics, including RevPAR (revenue per available room), length of stay, and booking lead time, for similar listings. This data can be filtered by property type, size, amenities, and location, providing a highly targeted analysis. This granular data allows investors to identify opportunities to differentiate their listings and command premium pricing.
Airbtics also helps investors understand price sensitivity – how demand changes in response to price fluctuations. AI-powered algorithms can analyze historical booking data to identify the optimal price point that maximizes revenue without sacrificing occupancy. This is a dynamic process, requiring constant monitoring and adjustment based on changing market conditions. Understanding competitor pricing is no longer a manual exercise; it’s a data-driven science.
Dynamic Pricing Algorithms: A Deep Dive
Dynamic pricing algorithms are the engines driving much of the revenue optimization in the vacation rental market. These algorithms continuously adjust prices based on a complex interplay of factors, including demand, seasonality, day of the week, special events, competitor pricing, and even weather conditions. They operate on the principle that the optimal price isn’t fixed, but rather a moving target.
The core logic typically involves analyzing real-time data feeds and identifying patterns that correlate with booking probability. Machine learning plays a crucial role in refining these algorithms over time, allowing them to learn from past performance and improve their predictive accuracy. The frequency of price adjustments can vary, ranging from hourly to daily, depending on the platform and the market.
While dynamic pricing offers significant potential benefits – increased revenue, improved occupancy rates – it also carries potential drawbacks. Guests may perceive frequent price fluctuations as unfair or manipulative, potentially leading to negative reviews or reduced loyalty. There are also ethical considerations to be aware of, such as the potential for price gouging during periods of peak demand. A balanced approach, prioritizing both profitability and guest satisfaction, is essential.
- Algorithms gather data on demand, competitor pricing, and external factors.
- Pattern Identification: Machine learning identifies correlations between these factors and booking rates.
- Price Adjustment: Prices are adjusted automatically based on the identified patterns.
- Algorithm Refinement: The algorithm learns from past performance and adjusts its parameters accordingly.
how ai changes property selection
AI-powered tools are fundamentally changing how investors identify potential properties. Traditionally, property selection relied heavily on gut feeling, local market knowledge, and basic financial analysis. Now, machine learning algorithms can analyze vast datasets to identify undervalued properties with strong potential for growth. These tools can sift through thousands of listings, identifying those that meet specific investment criteria.
AI can assess the risk associated with different investment opportunities by analyzing factors like crime rates, school district rankings, and proximity to amenities. It can also predict future appreciation rates based on historical trends and demographic projections. This allows investors to make more informed decisions, reducing the likelihood of costly mistakes.
Data visualization tools play a critical role in helping investors understand complex market trends. Interactive maps, charts, and dashboards allow investors to quickly identify promising areas and compare different investment opportunities. This visual representation of data makes it easier to spot patterns and make informed decisions.
No comments yet. Be the first to share your thoughts!