
Tracking 2026 occupancy rate shifts
The short-term rental market in 2026 is no longer defined by uniform growth. Instead, it is characterized by a sharp divergence in occupancy rates across different tiers and regions. While the aggregate national occupancy figures may appear stable, the underlying data reveals a market where supply growth is outpacing demand in saturated urban cores, while secondary and tertiary markets experience a surge in traveler interest.
This divergence is critical for investors evaluating ROI. Properties in high-supply areas face downward pressure on both occupancy and daily rates, compressing margins. Conversely, destinations with constrained inventory and strong underlying economic drivers are seeing occupancy rates hold firm or increase, even as overall market growth slows. Understanding this split is essential for accurate forecasting.
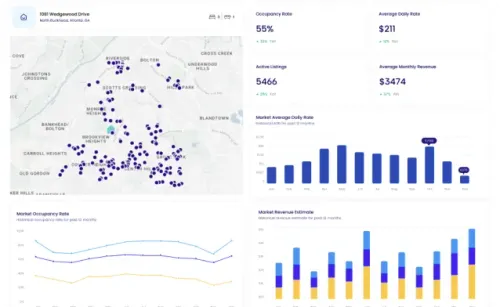
To visualize these historical trends, we can look at the performance of major US markets over the last 24 months. The following chart illustrates the fluctuating occupancy rates, highlighting the volatility that has become the new normal for short-term rental assets.
Calculating net yield from revenue
Gross revenue tells you what the market will pay, but net yield tells you what you keep. In the 2026 short-term rental landscape, the gap between the two is widening. A property listing for $5,000 a month in gross revenue rarely translates to $5,000 in profit. The mechanics of converting that top-line figure into actual investment return require a rigorous subtraction of fixed and variable costs.
To model this accurately, you must separate expenses into two buckets. Fixed costs include mortgage payments, property taxes, insurance, and software subscriptions. These remain constant regardless of occupancy. Variable costs scale with guest activity: cleaning fees paid to vendors, utilities, internet, supplies, and platform service fees. Missing even one variable cost can distort your net operating income (NOI) by 10% or more, leading to over-leveraged decisions.
The following comparison illustrates how two distinct market types process revenue differently. A high-occupancy leisure market relies on volume and lower daily rates, while a high-rate business market depends on premium pricing and shorter, more expensive stays. The expense ratios shift significantly between these models.
| Expense Category | Leisure Market (High Occ.) | Business Market (High Rate) |
|---|---|---|
| Platform Fees | 15-18% | 15-18% |
| Cleaning & Supplies | 12-15% | 5-8% |
| Utilities & Internet | 4-6% | 2-4% |
| Maintenance Reserve | 3-5% | 2-3% |
| Property Management | 20-25% | 15-20% |
Notice how management and cleaning costs consume a larger share of revenue in leisure markets. These properties often require more frequent turnovers and longer booking windows to maintain occupancy. In contrast, business travelers often stay longer, reducing cleaning frequency and management touchpoints, but they demand higher-end finishes and reliable amenities that drive up fixed maintenance costs.
Selecting the right analytics tools
In 2026, relying on static market reports is a liability. Airbnb market data changes hourly as host supply shifts and demand fluctuates. Investors need platforms that pull directly from primary sources—Airbnb and Vrbo APIs—rather than relying on delayed or modeled estimates. The difference between a profitable acquisition and a money-losing property often comes down to the latency and accuracy of the data you trust.
When evaluating tools, prioritize those that offer real-time occupancy rates, average daily rates (ADR), and revenue per available room (RevPAR) for your specific zip code. Look for platforms that also integrate comparable long-term rental data; this allows you to calculate the opportunity cost of short-term leasing versus traditional renting. If a tool cannot show you how a property performs in both markets simultaneously, it is likely missing a critical piece of your ROI equation.
Three platforms currently dominate the landscape for serious investors due to their depth of primary-source integration:
AirDNA remains the industry standard for broad market coverage. It tracks over 10 million listings across 120,000 markets, providing the most granular historical data available. Its strength lies in its benchmarking tools, which allow you to compare a potential property against thousands of similar listings in the same neighborhood. For investors analyzing large portfolios or multiple markets, the breadth of AirDNA’s dataset is unmatched.
AirROI offers a strong alternative for investors who need both analytics and operational tools. It provides free market analytics and revenue estimates while also offering an API for developers who want to build custom dashboards. AirROI’s dynamic pricing suggestions are particularly useful for hosts looking to maximize nightly rates without manual intervention, making it a dual-purpose tool for analysis and management.
BNBCalc is ideal for investors focused on U.S. markets who need to model specific property scenarios. It predicts revenue by integrating real-time market data with local long-term rental comps. This allows you to run "what-if" scenarios based on your specific purchase price, renovation costs, and financing terms. If you are underwriting a deal from scratch, BNBCalc’s calculator provides a more detailed financial model than general market dashboards.
| Platform | Best For | Data Source |
|---|---|---|
| AirDNA | Broad Market Benchmarking | Primary API |
| AirROI | Analytics + Dynamic Pricing | Primary API |
| BNBCalc | Deal Underwriting & Comps | Primary API + Local Comps |
Forecasting long term rental performance
The trajectory for short-term rental (STR) investors in 2026 is defined by a divergence between regulatory stability and market saturation. As cities like New York and Paris tighten enforcement on unhosted stays, the remaining viable markets are shifting toward secondary cities and suburban peripheries where zoning remains permissive. This geographic migration suggests that future ROI will not come from high-volume, high-churn urban listings, but from stable, long-term leases in emerging demand corridors.
Data from Inside Airbnb indicates that the majority of listings in mature markets are already operating as de facto long-term rentals, often without proper licensing. This "shadow inventory" creates a floor for occupancy rates but suppresses nightly rate growth. For investors, this means forecasting models must account for lower yields and higher regulatory risk premiums rather than relying on peak-season revenue spikes.
To visualize the macroeconomic headwinds, we track the NASDAQ Composite as a proxy for consumer confidence and discretionary spending, which directly influences travel demand.
Looking ahead three to five years, the most resilient STR assets will be those that can pivot to mid-term corporate housing or traditional leasing if short-term regulations tighten. Investors should prioritize properties in markets with diversified economic bases—those not reliant on a single tourism driver or corporate hub. This diversification mitigates the volatility inherent in the current regulatory landscape.
No comments yet. Be the first to share your thoughts!