
Moving past gut feelings in rental investing
I used to buy rentals based on a gut feeling about a neighborhood. That doesn't work anymore. The market is too crowded for guesses, and you need actual numbers to see if a property will cash flow.
Traditional methods like comparing to a handful of 'comp' listings or applying a simple capitalization rate simply don’t cut it anymore. These methods fail to account for the dynamic nature of demand, seasonal fluctuations, and the constant adjustments made by competitors. A property that looks promising on the surface can quickly underperform if these factors aren't properly considered.
Looking ahead to 2026, competition will only intensify. Success in the short-term rental market won’t belong to those who think they know the market, but to those who actually know it – armed with the right data and analytical tools. The shift is underway, and investors who hesitate to embrace data risk being left behind.
How AirDNA and BNBCalc stack up today
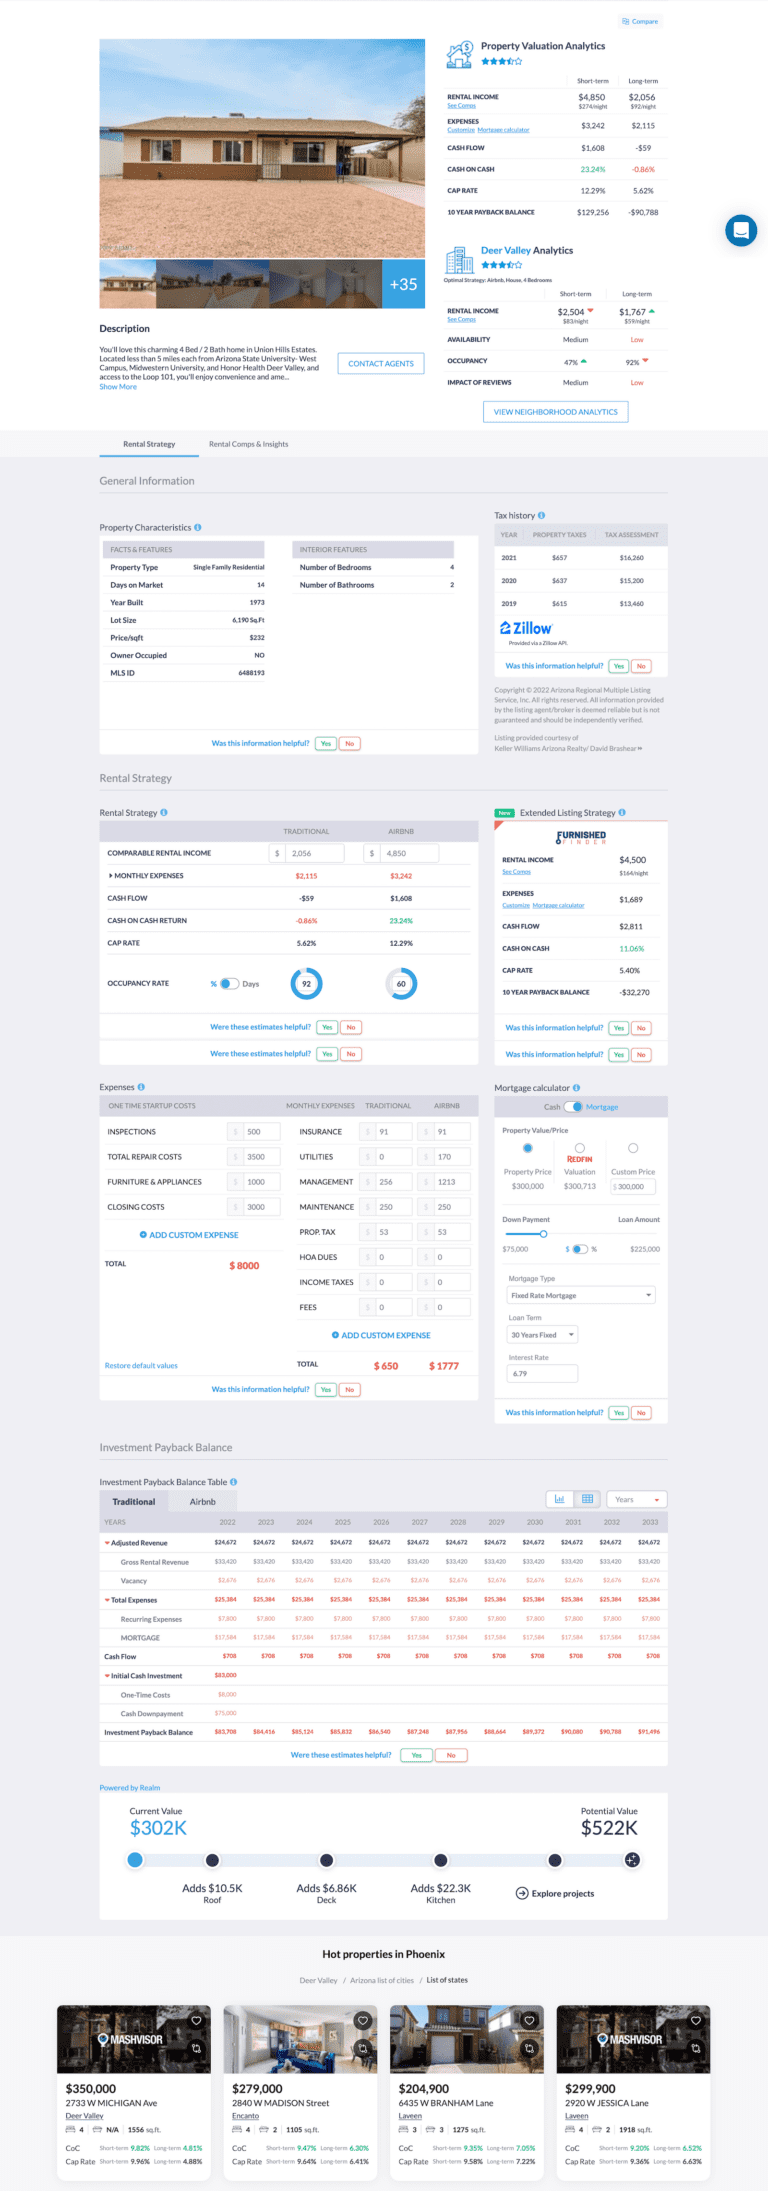
AirDNA Adapt and BNBCalc are the two big names right now. They both give you the basic numbers, but they handle the data differently depending on what you're looking for.
AirDNA Adapt focuses heavily on providing comprehensive market data. They pull information from Airbnb and Vrbo, offering insights into occupancy rates, average daily rates (ADR), and revenue per available room (RevPAR). A key feature is their 'Adapt' functionality, which dynamically adjusts projections based on real-time market changes. Their user interface is generally considered robust, though can be a little overwhelming for new users.
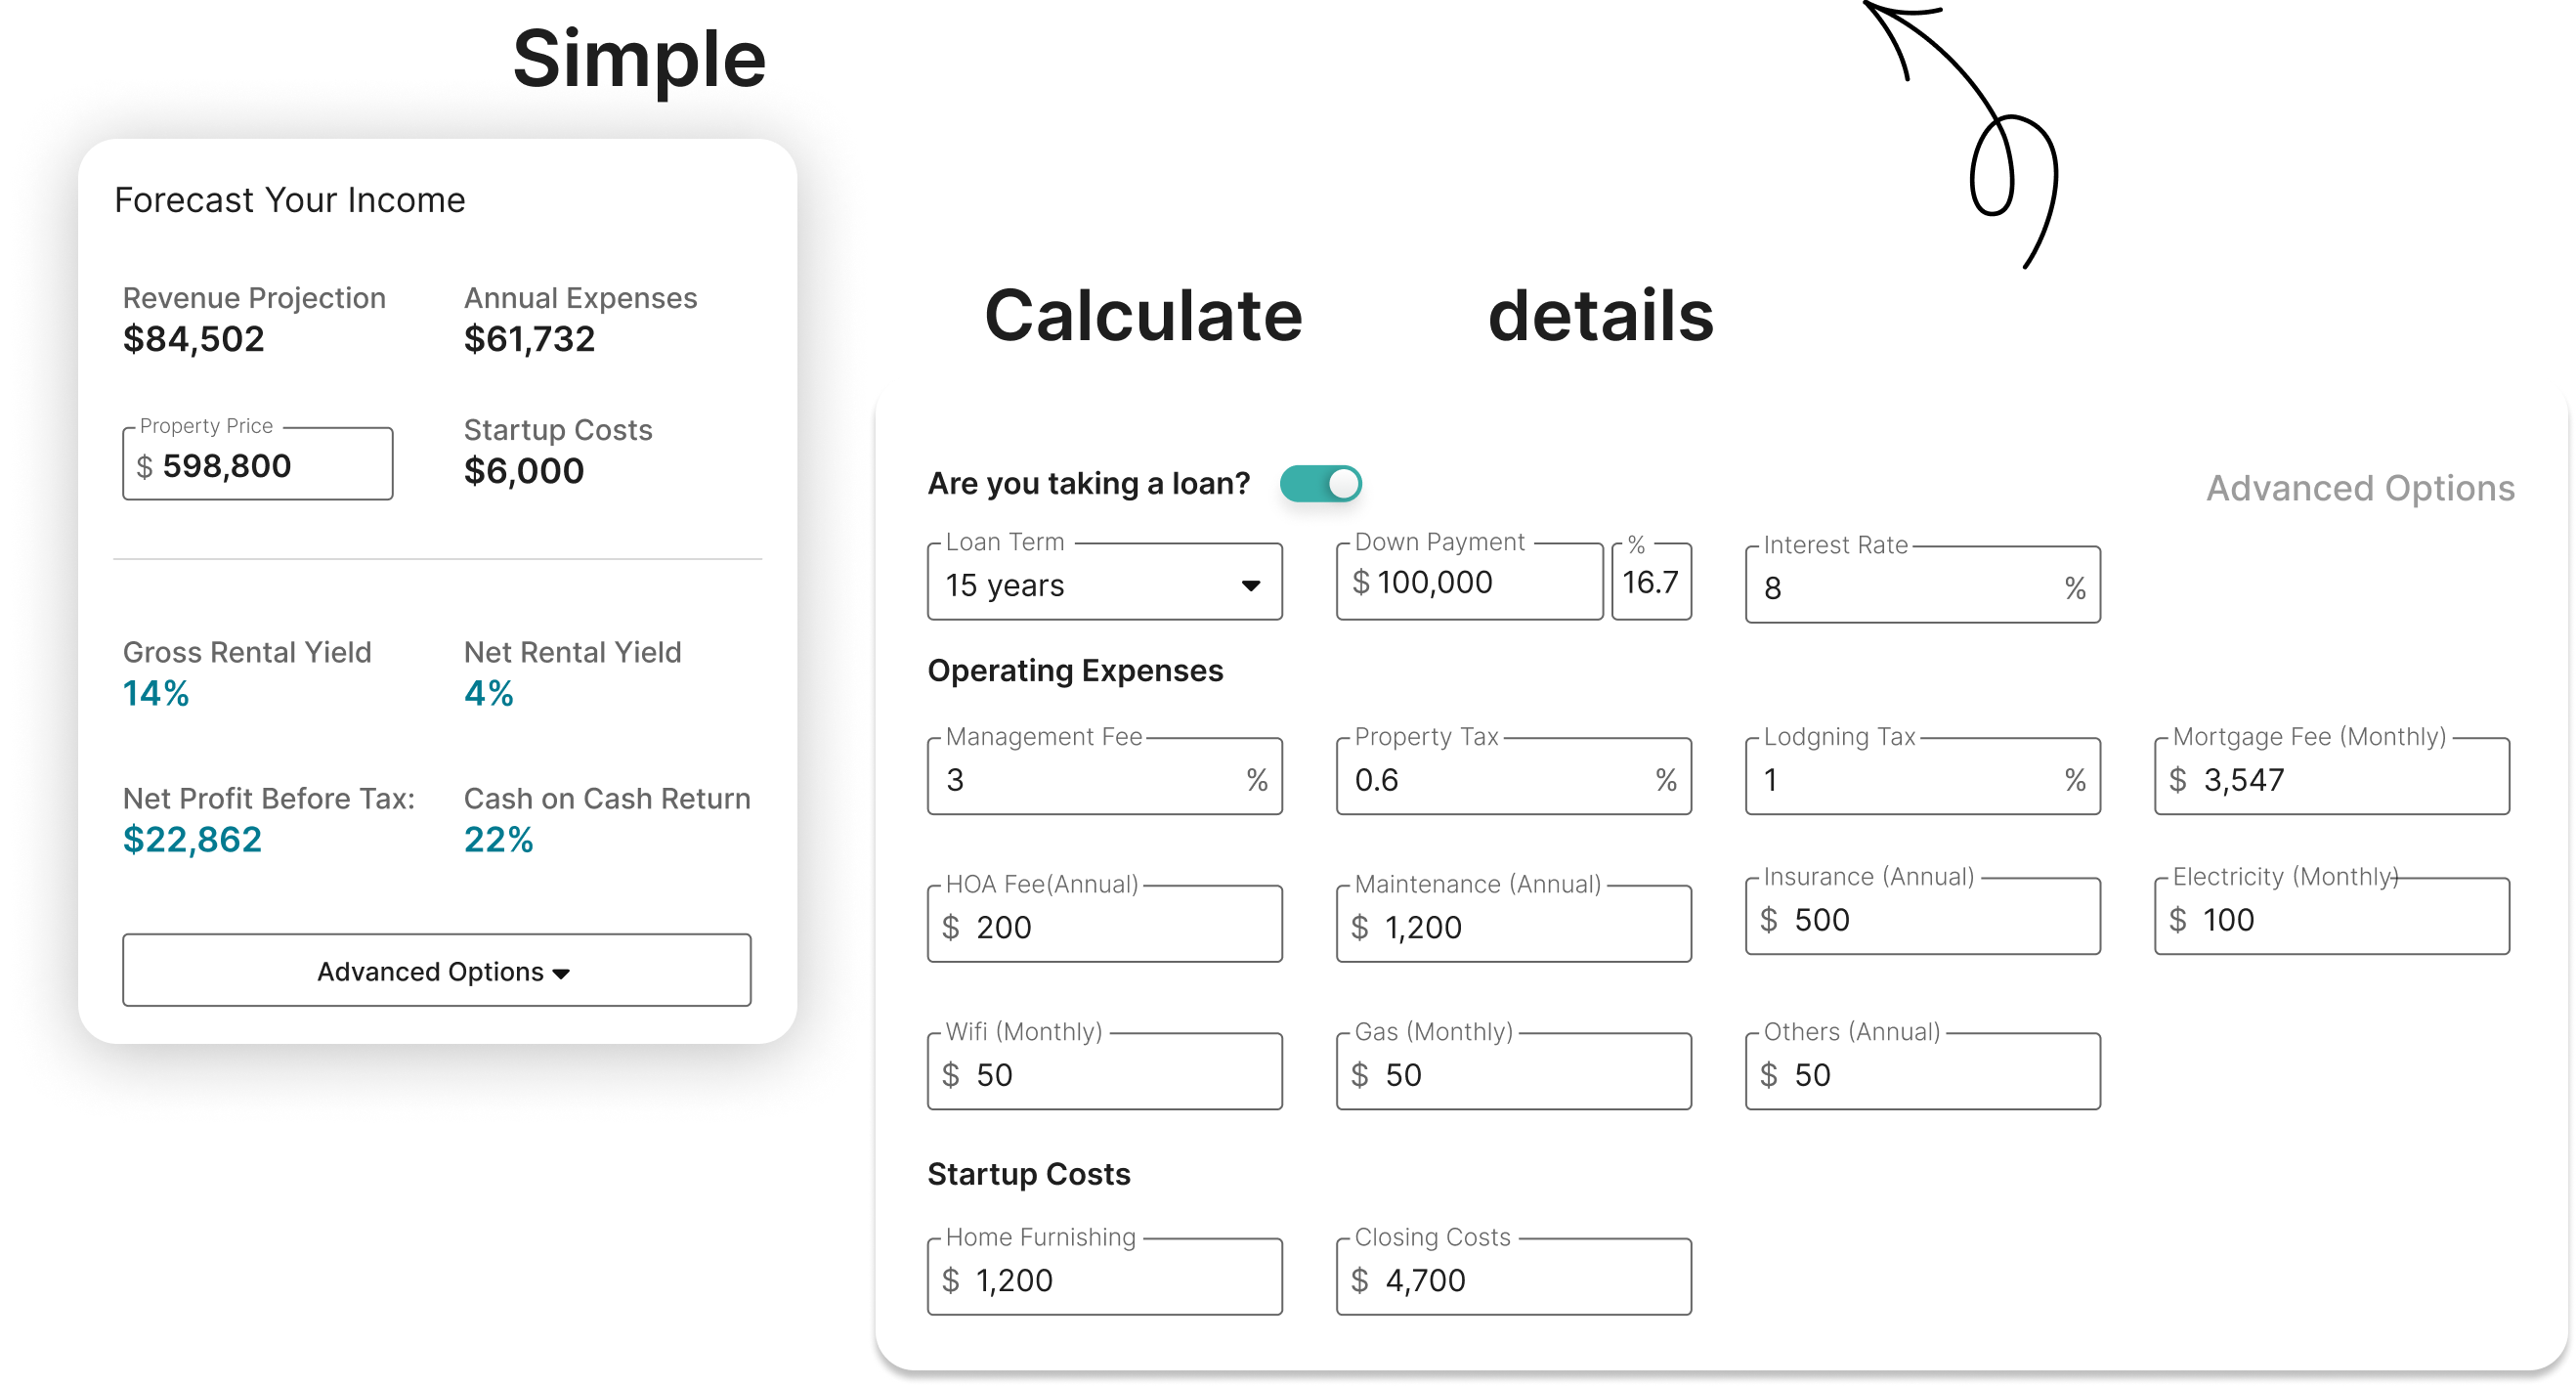
BNBCalc, on the other hand, emphasizes ease of use and a streamlined experience. It also calculates key metrics like occupancy, ADR, and RevPAR, but tends to focus more on providing a quick, at-a-glance overview of potential revenue. BNBCalc has recently partnered with Steadily Insurance, offering integrated insurance quotes for users – a valuable addition for investors. It's a good starting point for simpler analyses.
Both platforms have evolved significantly in recent years, incorporating more data points and refining their algorithms. AirDNA has expanded its geographic coverage and added features like comparable property analysis, while BNBCalc has improved its forecasting accuracy and added support for long-term rental projections. Ultimately, the best choice depends on the investor’s needs and level of analytical sophistication.
Predictive modeling for 2026
The real transformation in Airbnb revenue prediction lies in the application of artificial intelligence and machine learning. These technologies move beyond simply analyzing historical data; they attempt to predict future performance by identifying complex patterns and correlations.
AI-powered calculators now consider a much wider range of factors than ever before. Seasonality is still important, of course, but algorithms also account for local events (conferences, festivals, sporting events), competitor pricing strategies, and even external factors like weather forecasts. Imagine a model that anticipates a surge in demand during a heatwave, allowing you to adjust pricing accordingly.
Under the hood, these calculators likely employ a combination of time series analysis, regression models, and potentially even more advanced techniques like neural networks. Time series analysis helps identify trends and seasonality, while regression models can quantify the relationship between various factors (like price and occupancy). The specifics are often proprietary, but the goal is consistent: to create a more accurate and dynamic revenue forecast.
The sophistication of these models will only increase by 2026. We can expect to see algorithms that are better at adapting to changing market conditions, identifying niche demand segments, and personalizing predictions based on property characteristics.
Forecasting occupancy and demand
While revenue is the ultimate goal, occupancy is the foundational metric. A property can have a high ADR, but if it sits vacant most of the time, the overall return will be disappointing. AI is playing an increasingly important role in improving occupancy rate predictions.
Modern analytics aren't just looking at past occupancy; they are attempting to identify emerging demand patterns. This involves analyzing booking trends, search data, and even social media sentiment to anticipate shifts in traveler behavior. For example, a sudden increase in searches for 'pet-friendly rentals' in a particular area could signal a growing demand segment.
Investors can use this information to proactively optimize their listing strategies. This might involve highlighting specific amenities, adjusting pricing to attract different types of travelers, or even targeting marketing efforts towards specific demographics. Understanding the balance between short-term and long-term demand is also crucial. A shift towards longer stays, for instance, requires a different pricing and marketing approach.
Accurate occupancy forecasting allows investors to make more informed decisions about property management, staffing levels, and overall operational efficiency.
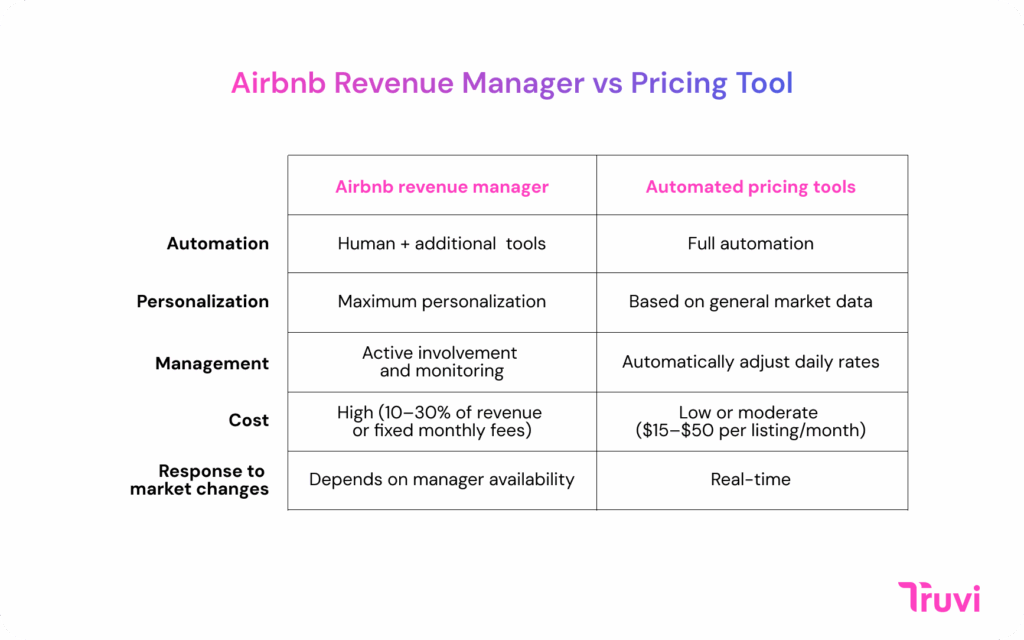
Dynamic pricing in a crowded market
Dynamic pricing is arguably the most impactful application of AI in the short-term rental market. Algorithms can automatically adjust pricing based on real-time demand, competitor rates, and a host of other factors. This ensures that you’re capturing the maximum possible revenue while remaining competitive.
The key is finding the 'sweet spot' – the price point that maximizes occupancy and revenue simultaneously. Over-pricing can lead to vacancies, while under-pricing leaves money on the table. AI algorithms aim to navigate this trade-off by continuously monitoring market conditions and adjusting prices accordingly.
Seasonality and day-of-week adjustments are fundamental components of dynamic pricing. Demand typically peaks during weekends and holidays, and prices should reflect this. AI-powered tools can automate these adjustments, ensuring that your pricing is always optimized. However, it's crucial to monitor the algorithm's performance and make manual adjustments when necessary.
The competitive landscape is also vital. Algorithms track competitor pricing in real-time, allowing you to maintain a competitive edge without sacrificing revenue. This requires access to accurate and up-to-date data, which is where platforms like AirDNA and BNBCalc excel.
What the calculators miss
Even the best software has blind spots. These models are only as good as the data they're fed, and they can't account for everything.
One common issue is data gaps. Some markets may have limited data coverage, particularly in emerging destinations or areas with a high concentration of off-market rentals. Inaccurate or incomplete data can lead to flawed predictions. It’s also important to remember that these calculators primarily rely on historical data, which may not be representative of future conditions.
Local market knowledge remains invaluable. A calculator can tell you what is happening, but it can’t tell you why. Understanding the local dynamics – upcoming events, zoning regulations, community sentiment – is crucial for making informed decisions. On-the-ground research, including talking to local property managers and residents, can provide insights that no algorithm can replicate.
Unexpected events – pandemics, natural disasters, economic recessions – can disrupt even the most carefully crafted forecasts. These 'black swan' events are inherently unpredictable and can have a significant impact on the short-term rental market.
Our 2nd Short Term Rental investment fund breaks down as follows:
— Taylor Jones (@MrJonesSTRs) September 5, 2023
•13 live on Airbnb/VRBO
•25 under renovation
•5 under contract
All of this since February when we launched Short Term Rental Fund 2!
Real-World Case Studies: Successes and Failures
Consider the case of Sarah, a first-time investor who purchased a condo in Nashville, Tennessee, in 2023. She used BNBCalc to analyze the market and identify a property with strong revenue potential. By closely monitoring occupancy rates and adjusting her pricing based on the calculator's recommendations, she achieved a 75% occupancy rate and a 15% return on investment – exceeding her initial expectations.
However, Mark's experience was less positive. He purchased a cabin in the Smoky Mountains based solely on the optimistic projections from AirDNA Adapt, without conducting thorough local market research. He failed to account for the increasing competition from new rentals in the area, and his occupancy rates fell short of expectations. He ultimately had to lower his prices significantly to attract bookings, resulting in a lower-than-anticipated return.
A third example involves a property owner in Miami Beach who used AI-powered dynamic pricing to maximize revenue during Art Basel. The algorithm automatically increased prices by 40% during the event, resulting in a substantial increase in income. However, the owner regularly reviewed the pricing to avoid alienating potential guests.
Content is being updated. Check back soon.

No comments yet. Be the first to share your thoughts!