
The airbnb market data limits to account for
The narrative that the short-term rental market is collapsing is incomplete. While early-stage supply booms have cooled in saturated markets, occupancy rates are stabilizing and revenue per available room (RevPAR) is recovering in high-demand destinations. This shift means Airbnb market data is no longer a simple growth chart; it is a complex signal of maturation.\n Investors must distinguish between broad platform trends and hyperlocal realities. A city-wide average occupancy rate of 65% might mask a 20% variance between a downtown luxury condo and a suburban family home. Relying on national aggregates without drilling into neighborhood-level performance is the primary reason many 2026 projections for ROI fail.
To navigate this, you need to look at three specific data constraints that define profitability this year:
- Regulatory Friction: Cities like New York and Barcelona are enforcing strict occupancy caps. Your data must account for legal availability, not just demand.
- Supply Saturation: The number of new listings has outpaced visitor growth in many US markets. You must compare your projected occupancy against the actual inventory growth rate of your zip code.
- Dynamic Pricing Efficacy: Static nightly rates are obsolete. Data shows that properties using algorithmic pricing tools capture 15-20% more revenue during shoulder seasons.
Ignoring these constraints leads to overestimating cash flow. The data is there, but it requires a granular lens to be useful. Use platforms like AirDNA to validate these local constraints before committing capital.
Airbnb market data choices that change the plan
Profitability in 2026 depends on recognizing that high occupancy rates often mask rising operational friction. Investors who rely solely on gross revenue projections frequently overlook the hidden costs that erode net returns. Accurate market analysis requires balancing these competing variables against local regulatory realities.
Occupancy vs. Average Daily Rate
High occupancy does not always equal higher profit. Markets saturated with new supply often see rates drop faster than occupancy rises. Investors must calculate the break-even occupancy point to determine if volume justifies lower nightly prices.
Regulatory Risk and Compliance Costs
Local zoning laws and licensing fees directly impact net operating income. Markets with strict short-term rental caps may offer stability but limit growth potential. Always factor in potential regulatory changes when modeling long-term cash flow.
Seasonality and Demand Volatility
Reliance on peak-season revenue creates cash flow gaps. Properties in year-round business hubs typically show more consistent returns than leisure destinations. Diversifying booking sources, such as Vrbo, can help smooth out seasonal dips.
Operational Efficiency and Management Fees
Self-managing properties saves money but consumes significant time. Professional management fees typically range from 20% to 30% of gross revenue. Calculate whether the time saved justifies the cost or if technology tools can bridge the gap.
How to decide if a market still works in 2026
The rise in occupancy rates doesn't help every investor equally. High occupancy in a saturated market still means low revenue per available night. Instead of chasing volume, focus on yield per unit. Use this five-step framework to filter out dead-end markets before you spend money on due diligence.
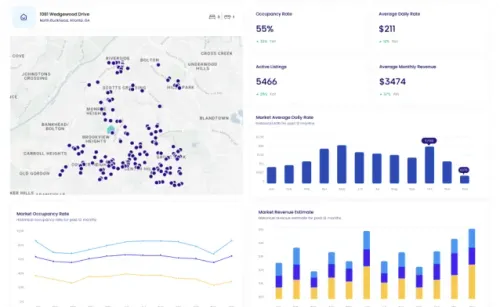
The 75-55 rule is a quick filter for market health. Look for a market where at least 75% of active listings are generating revenue, and at least 55% are profitable after expenses. If the "active" percentage is low, the market is likely oversaturated with dormant or failing listings. This data is available through platforms like AirDNA or AirROI, which track active vs. total inventory.

Occupancy is a vanity metric if nightly rates are crashing. Look at RevPAR (Revenue Per Available Room) instead. A market with 60% occupancy but $250/night averages often outperforms a market with 90% occupancy but $100/night averages. Compare this metric across your top three candidate cities to find the true revenue leader, not just the busiest one.
Short-term rental laws change faster than real estate cycles. Check if the city has implemented or is debating strict caps on rental days, mandatory licensing fees, or outright bans in residential zones. Avoid markets with high regulatory uncertainty unless you have a legal strategy in place. Stable, pro-business environments offer safer long-term ROI.
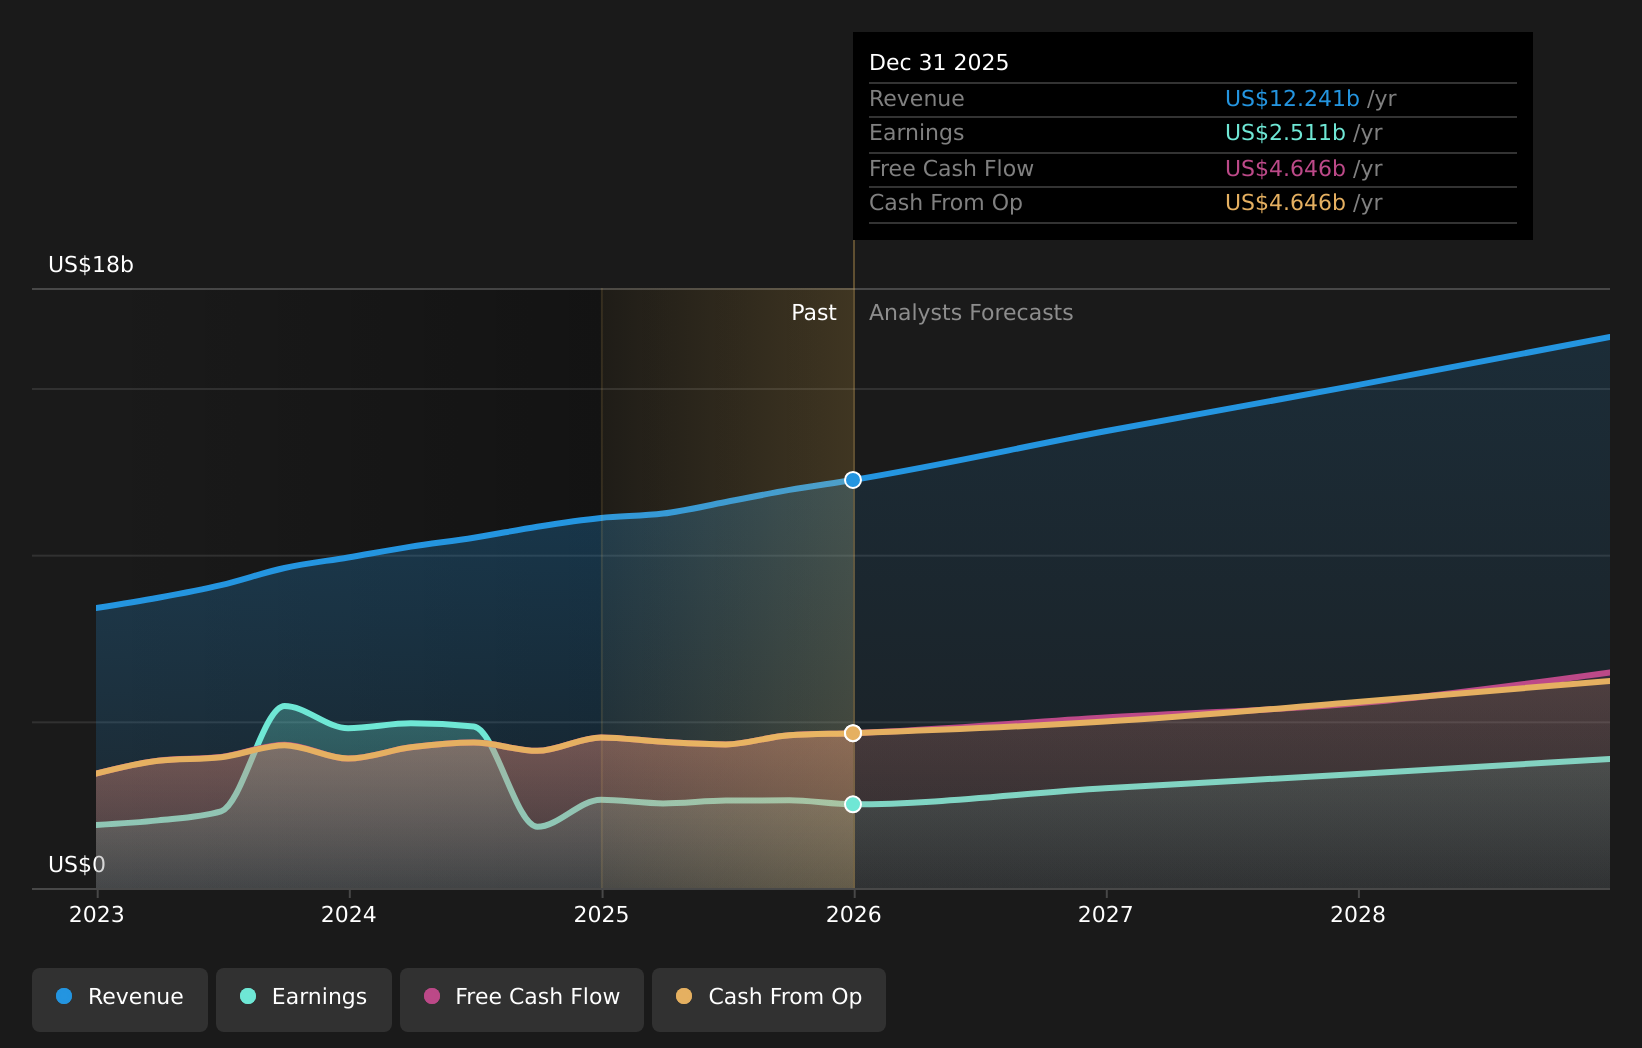
Don't rely on gross revenue. Calculate your cash-on-cash return by dividing your annual pre-tax cash flow by the total cash invested (down payment, closing costs, and renovations). Aim for a minimum of 8-10% to beat traditional real estate and stock market alternatives. If the numbers don't work on a conservative occupancy estimate, walk away.
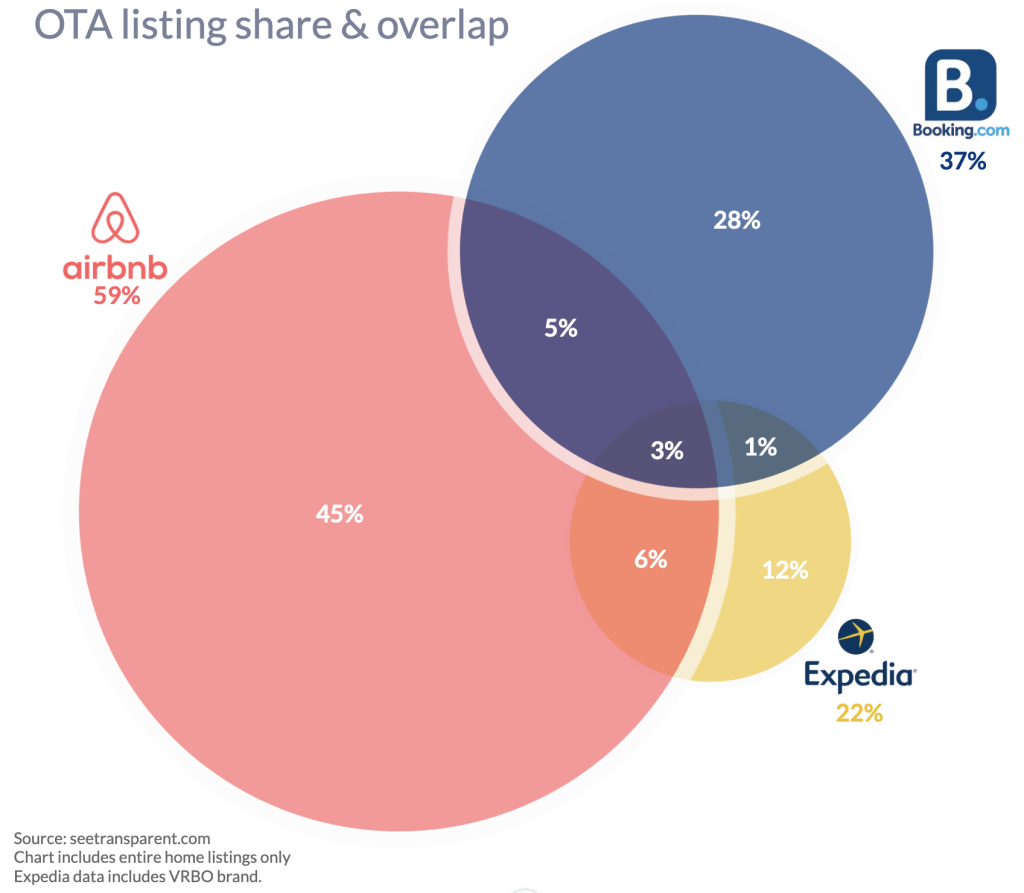
Use local MLS data or STR platforms to see how many new listings are coming online. If supply is growing 20% year-over-year while demand is flat, your future occupancy will drop. Look for markets where supply growth is slower than population or tourism growth. This imbalance is what keeps occupancy rates high and rates stable.
Spotting Misleading STR Claims
The short-term rental market is recovering, but not uniformly. Rising occupancy rates are reshoring ROI for investors who know where to look. Many online guides still cite pre-2020 data or aggregate national averages that hide local realities. This section breaks down the specific claims you should ignore and the checks you need to make.
Ignoring the 75-55 Rule
The "75-55 rule" is a common myth suggesting you must achieve 75% occupancy to break even and 55% to profit. This is incorrect. Profitability depends on your specific cost structure, not a fixed occupancy percentage. A high-cost urban property might need 85% occupancy to break even, while a low-cost rural cabin might profit at 40%. Focus on your net operating income (NOI) and cash-on-cash return, not arbitrary occupancy targets.
Relying on National Averages
National average occupancy rates are misleading because they mask hyper-local trends. A city might show a 60% average, but that could mean some neighborhoods are at 90% while others are at 30%. Always drill down to the zip code or neighborhood level. Use tools like AirDNA or AirROI to analyze sub-market performance. If you are investing in a specific area, you need granular data, not a national headline.
Assuming Decline Equals Collapse
Claims that "Airbnb is in decline" often confuse a correction with a crash. The market is maturing, not disappearing. Regulatory crackdowns in some cities have shifted supply, not demand. In many markets, occupancy is rising as supply tightens. Look at revenue per available room (RevPAR) trends, not just occupancy. A slight dip in occupancy with a 10% rise in ADR (Average Daily Rate) is a positive sign, not a decline.
Overlooking Seasonality
Many investors project annual income based on peak season performance. This is a mistake. If your property only books well in summer, your annualized ROI will be much lower than expected. Analyze monthly trends, not just annual totals. A property with 90% occupancy in July and 20% in January is very different from one with 60% year-round. Factor in the "shoulder seasons" when calculating your true annual return.
No comments yet. Be the first to share your thoughts!