

Why Airbnb Market Data Matters Now
Short-term rental investing has moved past the era of gut feeling. What used to be a game of intuition is now a discipline of precision. If you are looking at listings without looking at the underlying numbers, you are flying blind. Airbnb market data is no longer just a nice-to-have; it is the only reliable compass for making high-stakes financial decisions.
The stakes are higher than ever. Supply has increased in many major markets, while traveler demand fluctuates with economic conditions. A property that looked like a goldmine two years ago might be bleeding money today if it isn't priced and positioned correctly. This is where raw data cuts through the noise. It replaces "I think" with "I know."
Consider the difference between guessing your occupancy rate and knowing it. When you analyze Airbnb market data, you aren't just looking at past performance; you are forecasting future cash flow. You can see exactly how seasonal shifts impact your daily rate and identify which amenities actually drive bookings in your specific neighborhood. Without this clarity, you are essentially gambling with your investment.
The tools available today make this level of insight accessible. Platforms like AirDNA track millions of rentals across thousands of markets, providing the granularity needed to spot trends before they become obvious to the general public. Using this data allows you to adjust your strategy in real-time, ensuring you stay competitive rather than falling behind. In a market this dynamic, data is your best defense against volatility.
Reading occupancy rates correctly
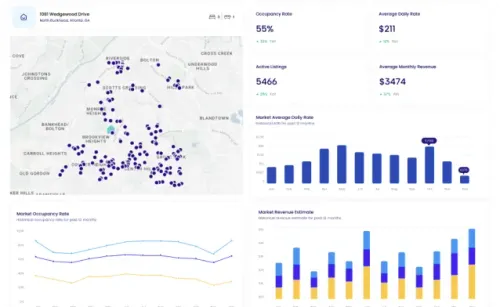
Occupancy percentage is the most cited metric in Airbnb market data, yet it is also the most misunderstood. A headline number like 75% might look solid on a dashboard, but without context, it tells you nothing about the actual health of an investment. High occupancy can mask low daily rates, while low occupancy might coexist with premium pricing strategies. To read these signals correctly, you must look beyond the aggregate and examine the underlying drivers of demand.
The first distortion comes from seasonality. Most markets have distinct peaks and valleys that skew annual averages. If a property sits at 90% occupancy for three months and 40% for the rest, the annual average will look decent, but the cash flow reality is volatile. You need to see the monthly breakdown to understand if the property can cover fixed costs during the off-season. Tools like AirDNA provide granular historical data that separates these trends, allowing you to model realistic income rather than relying on a flat yearly estimate.
The second distortion is market saturation. As more listings enter a market, the total demand often stays flat or grows slowly, meaning individual occupancy rates get diluted. A 70% occupancy rate in a saturated market might require aggressive pricing to maintain, whereas the same rate in a growing market could support higher daily rates. You must compare a property’s occupancy against the local median, not just historical benchmarks. If your occupancy is high but your daily rate is below the market average, you are likely leaving money on the table or competing in a race to the bottom.
Understanding these nuances requires looking at the data through a longer lens. Static snapshots can be misleading, so tracking trends over time helps identify whether a market is heating up or cooling down. This approach separates temporary spikes from sustainable performance, giving you a clearer picture of what the numbers actually mean for your bottom line.
How to calculate real returns with an ROI calculator
Using a rental property ROI calculator is the most reliable way to separate fantasy from financial reality. Many new investors focus on gross revenue, but that number ignores the friction that actually eats into your bank account. To understand true profitability, you need to distinguish between gross yield and net operating income (NOI). Gross yield is a simple metric: total annual revenue divided by the property’s purchase price. It’s useful for a quick snapshot, but it’s dangerously incomplete for decision-making.
Net yield, on the other hand, accounts for the hard costs of operating a short-term rental. You must subtract property management fees, cleaning costs, utilities, insurance, and maintenance from your revenue before dividing by your investment. If you skip these steps, your calculator will show a profit where there is actually a loss. Reliable tools like BNBCalc or Mashvisor aggregate real-time market data to estimate these expenses based on local benchmarks, giving you a realistic baseline for cash flow.
The goal is not just to find a property that looks good on paper, but one that survives the market. By inputting conservative occupancy rates and realistic expense ratios into an ROI calculator, you can stress-test your investment against actual Airbnb market data. This approach helps you identify the minimum performance threshold required to break even, ensuring you are buying a business, not just a vacation home.
Comparing Top Analytics Platforms
Airbnb market data platforms vary significantly in their data granularity, pricing, and user interface. Choosing the right tool depends on your specific needs, whether you are evaluating a single property or managing a portfolio. Below is a comparison of key factors to consider when selecting a provider.
| Factor | What to check | Why it matters |
|---|---|---|
| Fit | Match the option to the primary use case. | A good deal still fails if it does not fit the job. |
| Condition | Verify age, wear, and service history. | Hidden condition issues erase upfront savings. |
| Cost | Compare purchase price with likely upkeep. | The cheapest option is not always the lowest-cost option. |
How to Get Airbnb Market Data
Accessing reliable Airbnb market data requires a systematic approach to ensure you are analyzing accurate and relevant information. Follow these steps to gather the insights needed for informed investment decisions.
Frequently asked: what to check next
How do I access reliable Airbnb market data?
Finding accurate Airbnb market data requires specialized analytics platforms rather than relying on the public listing page. Tools like AirDNA, Airbtics, and BNBCalc aggregate millions of listings to provide historical performance metrics, projected revenue, and occupancy rates. These platforms allow you to enter a specific zip code or city to uncover the true demand and supply dynamics of that neighborhood.
What metrics matter most for short-term rental ROI?
When analyzing Airbnb market data, occupancy rate and average daily rate (ADR) are the primary drivers of your bottom line. High occupancy with a low ADR often signals a pricing strategy that leaves money on the table, while a high ADR with low occupancy suggests your property may be overpriced or lacking in key amenities. Look for the revenue per available room (RevPAR) to get a balanced view of performance.
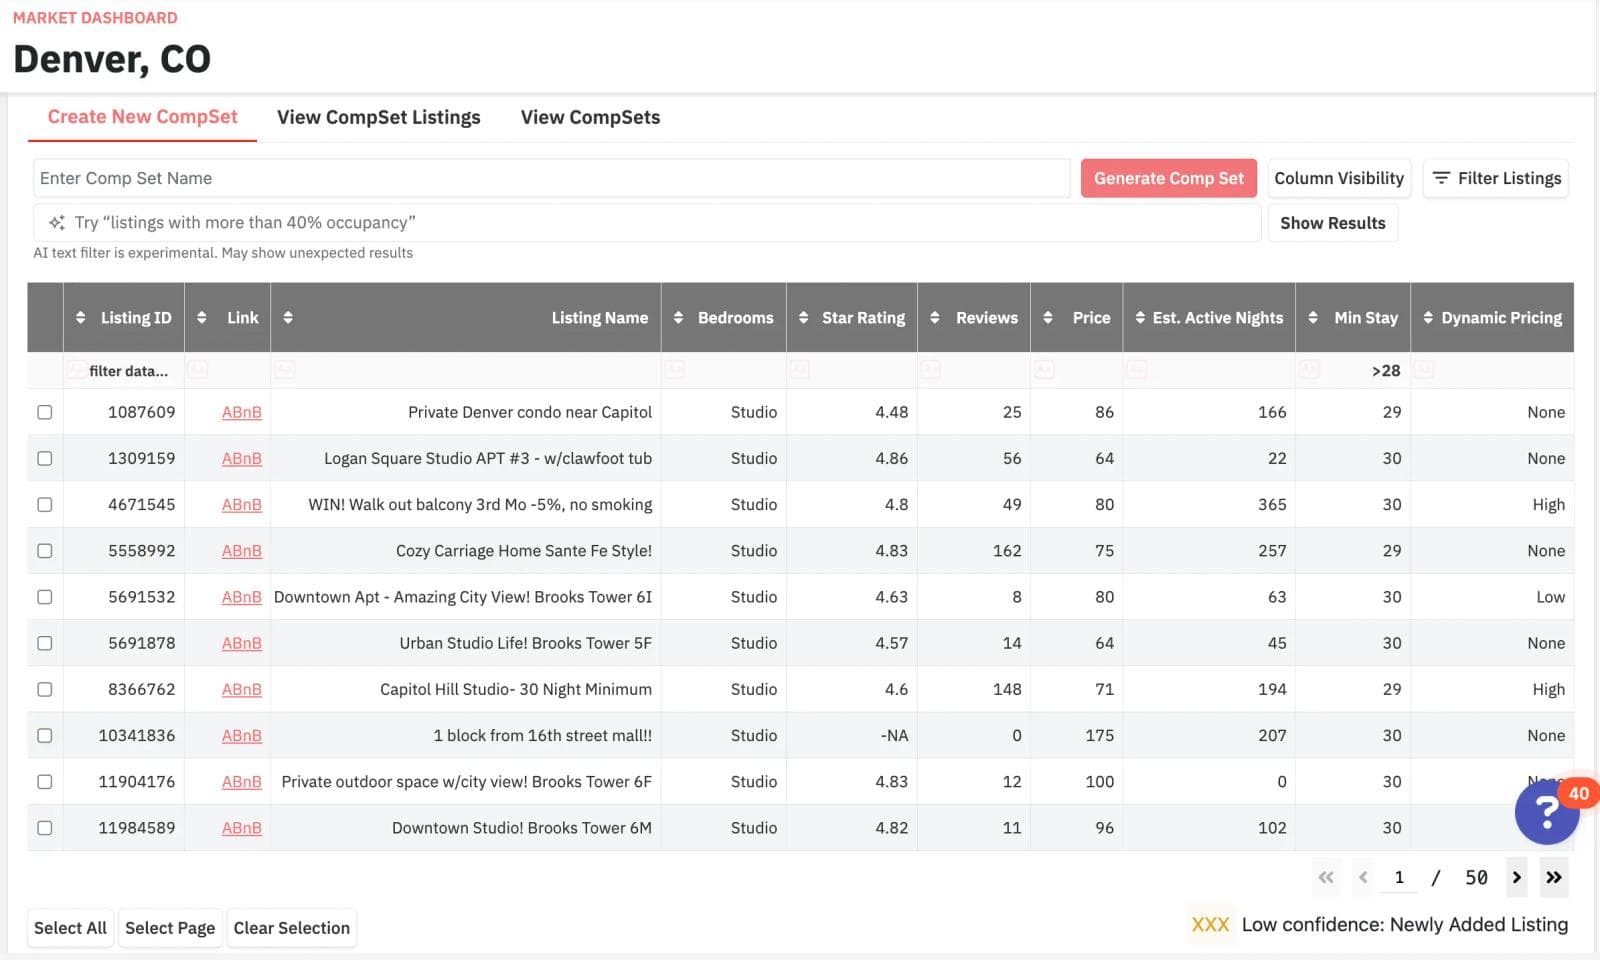
Can I see how my property compares to competitors?
Yes, most robust market data platforms offer competitive set analysis. This feature lets you benchmark your potential or existing property against a curated list of similar listings in the same area. You can see exactly how your projected nightly rates, occupancy, and annual revenue stack up against the top-performing hosts in your zip code.
Is free Airbnb market data accurate enough?
Free tools often provide a snapshot of current listings but may lack the deep historical data needed for long-term investment planning. While they are useful for quick checks, paid platforms typically offer more granular insights, such as seasonality trends, guest sentiment analysis, and 3-year historical datasets. For high-stakes investment decisions, investing in a comprehensive data source is usually necessary.
No comments yet. Be the first to share your thoughts!