
Market shifts in 2026 occupancy rates
Short-term rental occupancy rates have stabilized in 2026, marking a clear departure from the volatile post-pandemic peaks that characterized 2021 and 2022. The initial surge in demand, driven by pent-up travel desire and remote work flexibility, has normalized as corporate travel returned to pre-2020 levels and leisure travel habits adjusted to inflationary pressures. Investors who relied on the 80–90% occupancy benchmarks of the early recovery phase are now recalibrating their underwriting models to reflect a more mature, competitive market.
Data from AirDNA indicates that while total booking volume remains robust, the days of automatic high occupancy for every property are over. The average occupancy rate for US listings has settled into a tighter range, heavily influenced by local regulatory environments and seasonal demand fluctuations. Markets that previously benefited from a lack of supply are seeing occupancy dips as new inventory enters the market, particularly in secondary cities that experienced rapid Airbnb adoption during the pandemic. This saturation has forced hosts to compete on amenity quality and pricing strategy rather than simply listing availability.
The divergence between top-performing and average properties is widening. High-quality listings in prime locations with professional management are maintaining occupancy rates above 70%, while unmanaged or lower-tier assets struggle to break 50%. This bifurcation highlights that occupancy is no longer a guaranteed metric but a function of operational excellence. Investors must now treat occupancy as a variable to be managed through dynamic pricing and guest experience optimization, rather than a constant derived from market beta.
Understanding these shifts is critical for accurate ROI projections. The 2026 landscape rewards precision over volume. Hosts who analyze granular market data to adjust their pricing strategies in real-time are better positioned to maintain steady cash flow. Those who continue to operate on static assumptions risk significant revenue leakage. The market has moved from a seller’s market to a service-driven market, where occupancy is earned, not given.
Dynamic Pricing and Revenue Management
As occupancy rates plateau across many markets, the primary lever for increasing rental property roi calculator outputs is no longer volume, but yield per booking. Hosts are shifting from static pricing models to dynamic revenue management systems that adjust nightly rates in real time based on local demand, seasonality, and competitor activity.
Revenue per available room (RevPAR) has become the definitive metric for success, replacing simple occupancy counts as the key indicator of financial health. By leveraging data-driven analytics, hosts can identify pricing gaps and capture higher-margin bookings that static calendars miss.
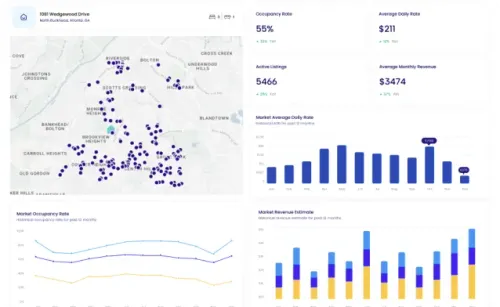
Tools like Mashvisor provide thorough Airbnb market research and rent comps analysis to determine the optimal nightly rate for specific properties. These platforms visualize global market data, allowing hosts to compare their performance against local benchmarks and adjust strategies accordingly. This data-backed approach ensures that pricing reflects current market conditions rather than historical assumptions.
The integration of these revenue management tools directly impacts the outputs of rental property roi calculator models. By increasing average daily rates (ADR) without sacrificing occupancy, hosts improve their net operating income, which translates to higher calculated returns on investment. This dynamic approach to pricing is essential for maintaining profitability in a saturated market.
Comparing top market analysis tools
Choosing the right data source is the foundation of high-stakes investment advice. While many platforms promise accuracy, their underlying data structures, historical depth, and calculation methods vary significantly. For investors relying on official or primary data, understanding these differences prevents costly underestimations of risk.
The following comparison highlights four leading platforms: AirDNA, Rabbu, Airbtics, and Awning. Each serves a distinct purpose, from deep historical analysis to quick, free market snapshots.
| Tool | Historical Data | Pricing Model | Primary Use Case |
|---|
No comments yet. Be the first to share your thoughts!