
Market recovery drives occupancy gains
The post-pandemic rollercoaster has finally leveled out. For hosts and investors watching the airbnb market data, 2026 is defined by a return to stability rather than the wild swings of 2020–2022. Demand has normalized, allowing owners to plan with confidence rather than reacting to daily volatility.
Occupancy rates are climbing steadily across major US markets. Where supply oversaturation once drove nightly rates down, the current market shows a healthy balance. Travelers are booking earlier and staying longer, which smooths out seasonal dips. This shift means your property isn't just surviving; it's generating consistent, predictable income.
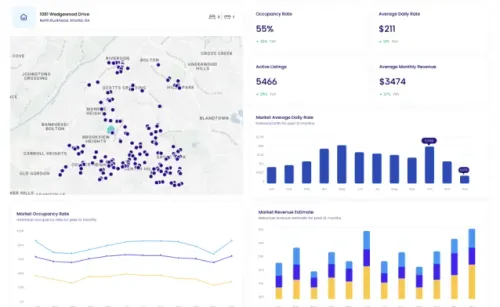
A look at historical trends confirms this upward trajectory. The following chart illustrates the recovery pattern in top-performing US markets, showing how occupancy has stabilized above pre-pandemic baselines.
Note: While the chart above tracks the broader short-term rental sector leader, the underlying demand trends reflect the same macroeconomic forces driving individual property occupancy.
This stabilization is the foundation for improved ROI. With occupancy rates rising, the fixed costs of hosting—cleaning, maintenance, and platform fees—are spread over more billable nights. The result is a stronger bottom line without necessarily requiring higher nightly rates. As the market matures, the focus shifts from volume to efficiency, rewarding those who optimize their listings based on real-time data.
How higher occupancy shifts your ROI metrics
When occupancy rates climb, the math behind your Airbnb market data changes in a way that favors cash flow. The primary driver isn't just more revenue; it's how those extra nights dilute your fixed expenses. Whether it's property management fees, insurance premiums, or software subscriptions, these costs remain static regardless of how many guests you host. Spreading them over a larger number of booked nights directly improves your net operating income.
Consider a property with $3,000 in monthly fixed costs. At 60% occupancy (18 nights), that cost per night is $167. At 80% occupancy (24 nights), the cost per night drops to $125. This efficiency gain compounds quickly, especially when combined with higher Average Daily Rates (ADR) often seen in tight markets. The result is a steeper ROI curve that doesn't require raising prices, just filling more calendars.
To see how these variables interact, compare the financial impact of two common occupancy scenarios below. This comparison illustrates why tracking real-time Airbnb market data is essential for accurate forecasting.
| Metric | 60% Occupancy | 80% Occupancy |
|---|---|---|
| Fixed Cost Per Night | $167 | $125 |
| Monthly Gross Revenue (est.) | $4,500 | $6,000 |
| Net Operating Income | $1,500 | $2,875 |
| Cash-on-Cash Return (est.) | 8.2% | 12.5% |
Tools like BNBCalc or Mashvisor can help you model these shifts by pulling live market data for your specific zip code. These platforms allow you to adjust occupancy sliders to see immediate impacts on cash flow, helping you set realistic pricing strategies that reflect current demand rather than historical averages.
Top markets for short term rental investment
The 2026 Airbnb market data shows a clear split: traditional tourist hubs are stabilizing, while secondary cities with strong local economies are seeing occupancy growth. Investors looking for the best returns need to look beyond the usual suspects. The strongest opportunities now combine rising demand with manageable entry costs.
To find these spots, we look for markets where occupancy is ticking up and daily rates remain stable. This combination suggests a healthy balance between visitor interest and supply constraints. The following locations stand out in 2026 for their consistent performance metrics.
Boise, Idaho
Boise continues to attract remote workers and domestic travelers seeking mountain access without the coastal price tag. Recent airbnb market data indicates steady year-round occupancy, driven by business travel and outdoor recreation. The market has absorbed new supply well, keeping rates from dipping too low.
Columbus, Ohio
As a major university and healthcare hub, Columbus offers resilience against seasonal tourism dips. The 2026 data highlights strong mid-term rental demand from medical professionals and students. This stability supports consistent cash flow, even when leisure travel slows.
Nashville, Tennessee
Nashville remains a top destination for music tourism and corporate events. While saturated in some neighborhoods, the broader metro area shows robust occupancy growth. Investors focusing on properties near the airport or university districts are seeing the best yields.
Charlotte, North Carolina
Charlotte’s growing financial sector and international business travel keep its short-term rental market active. The city’s infrastructure improvements have expanded its appeal to both leisure and business guests. Market data points to a 5-7% increase in average daily rates compared to 2025.
PriceWidget
Key metrics at a glance
| Market | Avg. Occupancy | Avg. Daily Rate | YoY Occupancy Change |
|---|---|---|---|
| Boise, ID | 68% | $185 | +4.2% |
| Columbus, OH | 72% | $145 | +3.8% |
| Nashville, TN | 65% | $210 | +2.1% |
| Charlotte, NC | 70% | $195 | +5.5% |
These numbers reflect averages across the broader metropolitan areas. Specific neighborhoods may vary significantly. Always verify local zoning laws and HOA restrictions before purchasing. The best airbnb market data is only useful if you can legally operate in the chosen location.
PriceWidget
Data sources for accurate market analysis
Finding reliable airbnb market data requires knowing where to look. Free tools give you a snapshot, but professional-grade analytics provide the depth needed for high-stakes investment decisions. The right source depends on your budget and how granular you need your insights to be.
Free and Freemium Tools
For initial research, platforms like Awning and AirDNA offer accessible entry points. Awning provides free market data by city and zip code, allowing you to browse occupancy rates, daily rates, and demand trends without a subscription. AirDNA, the industry standard since 2015, tracks over 10 million listings across 120,000 markets. While their deep-dive analytics require a paid plan, their free tier lets you explore basic performance metrics and identify top-performing properties in a specific area. These tools are excellent for validating general market interest before committing significant capital.
Professional-Grade Analytics
When you are underwriting a specific property, free data often lacks the granularity required for accurate ROI projections. Professional platforms like AirDNA (paid tiers) or specialized local tools provide detailed seasonality patterns, amenity value assessments, and competitor benchmarking. These tools often integrate with local STR regulations and tax data, which is critical for compliance-heavy markets. For high-stakes decisions, relying solely on free summaries can lead to underestimating vacancy risks or overestimating daily rates.
Verifying Data Reliability
Before trusting any dataset, cross-reference multiple sources. Check if the platform updates its data frequently and whether it includes both Airbnb and Vrbo listings, as ignoring one can skew demand insights. Look for transparency in their methodology—reputable sources explain how they handle missing data or seasonal fluctuations. If a tool claims to know your exact revenue without asking for your property details, it is likely using broad averages rather than precise local data. Always prioritize platforms that allow you to drill down to the zip code or neighborhood level for the most actionable insights.
Frequently asked questions about 2026 trends
How do I access reliable Airbnb market data?
Finding accurate Airbnb market data requires looking beyond the platform’s own limited public listings. Tools like Awning provide free market research by city and ZIP code, allowing you to see occupancy rates, daily rates, and amenity values. This granular access helps you identify which properties are outperforming the competition in specific neighborhoods.
What are the biggest ROI shifts in 2026?
The market is moving away from generic stays toward niche experiences. Investors are seeing higher returns by focusing on properties that offer unique amenities or cater to specific travel purposes, such as remote work or pet-friendly stays. Understanding these shifts is critical for maximizing your return on investment in a competitive landscape.
Is it still a good time to buy an Airbnb?
While entry costs remain high, the demand for short-term rentals continues to grow in many markets. Success in 2026 depends on precise location selection and data-driven pricing strategies. Properties in areas with strong year-round demand and lower saturation are showing the most resilient performance.
No comments yet. Be the first to share your thoughts!