
Gather local short-term rental metrics
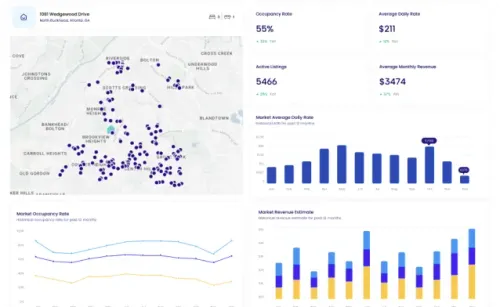
Before committing capital, you need a clear picture of the local short-term rental landscape. Airbnb market data provides the baseline metrics required to calculate realistic returns. The three most critical indicators are Average Daily Rate (ADR), occupancy rate, and seasonality. These numbers tell you how much revenue a property can generate and how consistent that income is likely to be.
Begin by choosing a dedicated short-term rental analytics tool. Platforms like AirDNA, Rabbu, or AirROI aggregate listing data to provide market-wide insights. These tools filter out noise and give you standardized metrics for specific zip codes or neighborhoods. Most offer a free tier that is sufficient for initial research.
Locate the ADR for your target area. This metric represents the average price per night for comparable listings. It is not the maximum possible rate, but the realistic average after accounting for discounts and lower-demand days. Use this figure to estimate your gross potential revenue before subtracting expenses.
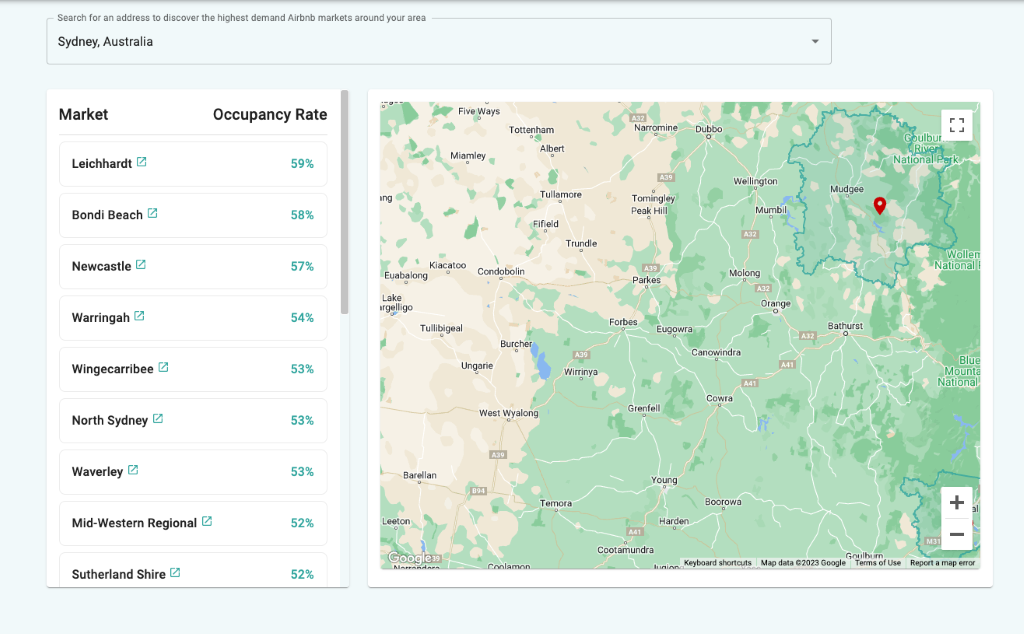
Review the annual occupancy percentage and monthly breakdown. A high annual average can be misleading if the property sits empty for three months in winter. Look for seasonality trends to understand cash flow gaps. This data helps you determine if the market supports year-round income or if it is heavily dependent on peak travel seasons.
Once you have these numbers, calculate the projected annual revenue by multiplying the ADR by the annual occupancy rate and then by 365 days. This gives you a top-line estimate. However, this number is not profit. You must subtract operating expenses, cleaning fees, platform commissions, and management costs to find your true net operating income. Without accurate local metrics, your ROI calculations will be based on guesswork rather than market reality.
Estimate annual gross revenue
To calculate projected annual gross revenue, you need to combine your property’s specific capacity with verified market metrics. This step transforms raw market data into a concrete financial projection, allowing you to assess whether the rental property meets your ROI targets before you commit capital.
First, determine your property’s maximum occupancy. Count the number of bedrooms and multiply by the standard occupancy per room, typically two guests. Add any additional beds, such as sofa beds or rollaways, to establish the total guest capacity. This figure represents the theoretical maximum number of guests your property can host in a single booking.
Next, estimate the average daily rate (ADR). Use the median ADR for comparable properties in your target neighborhood as a baseline. Adjust this figure based on your property’s unique features, such as premium amenities or superior location. This adjusted rate reflects the realistic nightly income you can expect to charge.
Then, apply the market’s average occupancy rate. This percentage indicates how many nights per year similar properties are booked. Multiply the ADR by 365 days, then by the occupancy rate to find the gross revenue per occupied night over a year. Finally, multiply this annual revenue by your property’s total guest capacity if you are comparing per-room yields, or keep it as total property revenue if calculating overall cash flow potential.
This calculation provides a top-line revenue estimate. It does not yet account for expenses like cleaning fees, platform commissions, or maintenance costs. Use this gross figure as the starting point for your cash flow analysis, ensuring you subtract all operating expenses to determine net operating income (NOI).
Subtract operating expenses and taxes
Gross revenue is only the starting point. To determine the true Net Operating Income (NOI), you must subtract every direct and indirect cost associated with the property. This calculation strips away the noise to reveal the actual cash flow potential before debt service.
Direct operating costs
These are expenses that fluctuate with occupancy. They include cleaning fees paid to vendors, property management commissions (typically 20–30% of gross revenue), and utilities not reimbursed by guests. You must also budget for routine maintenance, repairs, and supplies like toiletries or linens. Using Airbnb market data helps you estimate these costs by comparing your property to similar listings in the area.
Indirect and fixed costs
Indirect costs remain constant regardless of occupancy. These include property taxes, insurance premiums, and HOA fees. While taxes vary by jurisdiction, insurance for short-term rentals is often higher than standard homeowner policies. Accurate data entry for these fixed costs is critical; underestimating them can erase your projected profit margin entirely.
Calculating net operating income
The formula for NOI is straightforward:
NOI = Gross Revenue - Direct Operating Expenses - Indirect Fixed Costs
This figure represents the property’s profitability before mortgage payments and income taxes. It is the primary metric for comparing investment opportunities. If your NOI is negative, the property is not generating sufficient cash flow to cover its operating burdens, regardless of how high the nightly rates are.
-
Cleaning and turnover costs
-
Property management fees
-
Utilities and internet
-
Maintenance and repairs
-
Property taxes
-
Insurance premiums
-
HOA or condo fees
Apply the ROI formula to your purchase price
Now that you have estimated the annual Net Operating Income, the final step is to determine the total cash outlay required to acquire the property. This figure includes the purchase price, closing costs, and any immediate renovations needed to bring the unit up to short-term rental standards. By dividing the annual NOI by this total cash investment, you get the Return on Investment percentage.
This calculation tells you whether the deal meets your financial threshold. A higher percentage indicates a more efficient use of capital, but it must be weighed against the risks of market volatility and management overhead.
Sum the purchase price, closing costs (typically 2-5% of the price), and renovation costs. This is your denominator.
Take the annual NOI from your pro forma and divide it by the total cash invested. The result is your ROI percentage.

If the ROI exceeds your minimum acceptable return (e.g., 8-10%), the deal moves to the due diligence phase. If it falls short, walk away.
A common mistake is ignoring the cost of furnishing and initial marketing. These are part of your initial cash outlay. Failing to include them inflates your ROI and leads to unrealistic expectations. Always use conservative estimates for renovation costs, as unexpected repairs often arise in older properties.
Validate findings with competitor analysis
Your initial revenue projections are theoretical until you stress-test them against actual market performance. The most common error investors make is assuming their property will outperform the current leaders without accounting for their existing advantages: prime location, professional photography, or automated pricing strategies. To ensure your ROI calculations are realistic, you must analyze the top-performing competitors in your target area.
Start by identifying the top 5 to 10 listings in your specific neighborhood that have a high volume of recent reviews (at least 20+ in the last 12 months). High review counts indicate consistent occupancy, which is a stronger signal than occasional high rates. Use Airbnb’s search filters to sort by "Most Popular" or manually inspect listings with the "Superhost" badge, as these hosts have demonstrated reliability and quality.
Extract the following metrics for each competitor:
- Average Daily Rate (ADR): What are they actually charging, not just the displayed starting price?
- Occupancy Rate: Estimate this by looking at their calendar availability. If a month shows 15+ days booked, their occupancy is roughly 50% or higher.
- Amenity Gap: List what amenities they offer that you do not plan to include (e.g., hot tub, workspace, parking). Missing these can significantly lower your achievable rate.
Calculate the median ADR and occupancy rate from this group. Use these median figures, rather than the top performer’s numbers, for your conservative revenue model. If your property’s projected revenue falls below your break-even point using these median competitor stats, the investment may be too risky. This step prevents over-optimism by grounding your expectations in the average performance of successful peers in the exact same market.
Frequently asked questions about Airbnb data
How do I access reliable Airbnb market data?
Most investors use third-party analytics platforms to pull specific metrics like occupancy rates, daily rates, and revenue projections. To get started, enter the target zip code or city into a market analysis tool. These platforms provide real-time insights into amenity value and competitive performance. Always verify that the data source uses official or primary data feeds to ensure accuracy for your financial calculations.
Is Airbnb demand currently decreasing?
While pandemic-era booking drops were significant, usage has gradually increased as travel restrictions relaxed. However, demand fluctuates by location. In some major cities, hosts have shifted to long-term rentals to maintain steady income as the short-term market became volatile. Analyze local trend data rather than relying on broad global statistics to gauge current demand in your specific market.
How accurate is the revenue projection data?
Revenue projections are estimates based on historical averages and current market conditions. They are not guaranteed income figures. Factors like seasonality, local regulations, and property management quality significantly impact actual returns. Use these projections as a baseline for ROI formulas, but always stress-test your numbers with conservative occupancy assumptions and real expense data.
No comments yet. Be the first to share your thoughts!