
Market recovery signals in 2026
The short-term rental sector is moving past the volatility of the post-pandemic era into a phase of stabilized, data-driven growth. Current airbnb market data indicates that occupancy rates in major US markets have normalized rather than collapsed, signaling a maturation of the industry. Investors are no longer relying on pandemic-era demand spikes but are instead evaluating properties based on consistent, year-round performance metrics.
Occupancy trends show a distinct divergence between markets that adapted to regulatory changes and those that did not. Cities with clear STR zoning laws have seen occupancy rates stabilize around 65-75%, while unregulated areas face higher vacancy rates due to supply oversaturation. This shift means that raw occupancy numbers are less valuable than net operating income (NOI) projections. The market is rewarding precision over volume.
To understand these shifts, we must look at the underlying data infrastructure. Platforms like AirDNA and Mashvisor now provide granular insights into daily revenue, average daily rates (ADR), and seasonal demand curves. This level of detail allows investors to model cash flow with greater accuracy, moving away from broad market assumptions to property-specific financial forecasting.
The following chart illustrates the historical occupancy rate trends for major US markets over the last three years. It highlights the recovery trajectory and the current plateau in occupancy, providing a visual baseline for understanding the 2026 market landscape.
Occupancy rates drive revenue stability
Airbnb market data for 2026 reveals a structural shift in revenue generation. While Average Daily Rates (ADR) have plateaued in many mature markets, occupancy volumes are expanding. This divergence signals that volume is currently the primary driver of ROI, superseding the premium pricing strategies that dominated the previous decade.\n The correlation between rising occupancy and stabilized ADR is not accidental; it reflects a maturing supply chain. As new inventory hits the market, hosts who prioritize consistent booking velocity over sporadic high-yield days are seeing more predictable cash flows. This stability reduces the volatility of net operating income, making short-term rental assets more resilient to seasonal dips.
Investors are increasingly viewing high occupancy as a proxy for operational efficiency. A property booked 75% of the year at a moderate rate often outperforms a property booked 60% of the year at a 20% premium, once vacancy costs and turnover expenses are factored in. The data supports a move toward volume-centric strategies.
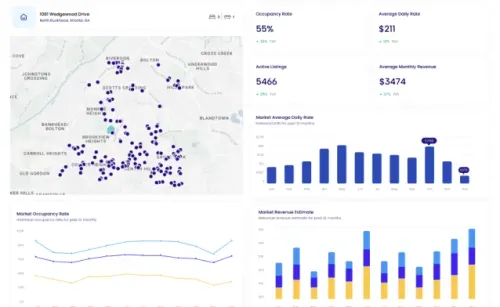
This trend is visible in the metrics provided by major analytics platforms like AirDNA and AirROI, which track the balance between supply growth and demand resilience. The focus is shifting from maximizing nightly rates to maximizing total annual revenue through sustained demand. Hosts who adapt to this volume-first model are better positioned for long-term profitability in a crowded marketplace.
For a broader view of market performance, investors should monitor live ADR trends alongside occupancy forecasts. Understanding these dynamics is essential for accurate financial modeling.
Top performing markets by occupancy
While national averages fluctuate, specific geographic pockets are delivering consistent cash flow through sustained demand. The 2026 Airbnb market data reveals that travelers are prioritizing accessibility and unique experiences over traditional tourist hubs. Markets like Austin, Nashville, and Asheville are outperforming the national average, driven by a combination of lower entry costs and high seasonal consistency.
These cities benefit from a "sticky" demand profile. Unlike coastal destinations that suffer from severe winter slumps, these inland markets maintain steady occupancy year-round. For investors analyzing airbnb market data, this stability reduces the risk associated with seasonal vacancy, making these locations attractive for long-term hold strategies.
The following table compares key performance metrics for the top five markets. Occupancy rates are calculated based on active listings over the last 12 months, while Average Daily Rate (ADR) and Revenue Per Available Room (RevPAR) reflect current pricing power.
| Market | Occupancy Rate | Avg Daily Rate | RevPAR |
|---|---|---|---|
| Austin, TX | 68% | $185 | $126 |
| Nashville, TN | 65% | $175 | $114 |
| Asheville, NC | 62% | $165 | $102 |
| Scottsdale, AZ | 64% | $195 | $125 |
| Charleston, SC | 61% | $180 | $110 |
Austin and Nashville lead the pack with occupancy rates above 65%, supported by strong business travel and event-driven tourism. Scottsdale and Charleston follow closely, leveraging their resort-style appeal to command higher ADRs. Investors should note that while RevPAR is a critical metric, local regulatory environments in these cities can significantly impact net profitability.
Calculating realistic rental property ROI
Building an accurate ROI model requires shifting from optimistic projections to conservative, data-driven estimates. The 2026 market demands precision. Using raw airbnb market data without adjusting for seasonality and operating costs leads to inflated expectations.
The methodology for accurate modeling
Start with gross revenue derived from current Average Daily Rates (ADR) and occupancy percentages. Do not use peak-season averages. Instead, apply a conservative 70-75% occupancy rate for year-round calculations. This accounts for the 2026 shift toward longer stays and lower turnover efficiency in saturated markets.
Subtract all operating expenses before calculating net operating income (NOI). These include cleaning fees, property management (20-25% of gross), maintenance (5-10%), and insurance. Many investors miss variable costs like utilities and platform fees, which can eat 15% of revenue. Use tools like BNBCalc or Mashvisor to benchmark these against local averages.
Stress-testing your assumptions
Your ROI calculation must include a vacancy buffer and a capex reserve. Set aside 5-10% of gross revenue for major replacements like furniture or HVAC repairs. This reserve ensures your cash flow remains positive during unexpected downtime.
| Metric | Conservative Estimate | Optimistic Projection |
|---|---|---|
| Occupancy Rate | 70% | 85% |
| Annual Expenses | 45% of Gross | 30% of Gross |
| Cap Rate | 4-6% | 8-10% |
This table highlights the danger of ignoring realistic expense ratios. A 15% difference in expense estimation can turn a profitable property into a money loser. Always model the worst-case scenario first.

Validating your model with market benchmarks
Compare your projected ROI against local market benchmarks. If your model shows a 10% cash-on-cash return in a market averaging 5%, your assumptions are likely too aggressive. Cross-reference your numbers with official airbnb market data from platforms like Mashvisor or BNBCalc to ensure your inputs reflect current conditions.
Remember, a realistic ROI model is not about predicting the perfect outcome. It is about understanding the risk. By grounding your calculations in conservative data, you protect your capital and make informed investment decisions.
Frequently asked questions about airbnb market data
Investors often interpret short-term rental (STR) metrics through the lens of past growth cycles, but 2026 requires a more rigorous approach to airbnb market data. The following questions address common misconceptions regarding market viability, data interpretation, and profitability thresholds.
Accurate airbnb market data is the foundation of these calculations. Relying on outdated or generic metrics can lead to significant miscalculations in ROI projections. Always verify occupancy trends and average daily rates (ADR) against current, localized datasets before making investment decisions.
No comments yet. Be the first to share your thoughts!