
Tracking occupancy shifts in 2026
The short-term rental market in 2026 is defined by a divergence: while supply has surged in many coastal markets, occupancy rates in high-demand urban and suburban hubs have remained resilient, stabilizing revenue streams for disciplined investors. This shift marks a move away from the hyper-growth phase of 2020–2022 toward a more mature, efficiency-driven cycle where consistent occupancy matters more than peak seasonal spikes.
Data from AirDNA, which tracks over 10 million listings across 120,000 markets, indicates that average daily occupancy in top-tier US markets has stabilized around 68–72% for well-managed properties, up from a low of 64% in late 2024. This uptick is not uniform; it reflects strategic pricing and professional management rather than broad market demand. Investors who rely on passive ownership are seeing occupancy drift below 60%, while those using dynamic pricing tools and optimized listings maintain higher utilization.
This resilience is critical for ROI calculations. A property operating at 70% occupancy with a 15% improvement in nightly rates can outperform a property at 80% occupancy with stagnant rates, due to the compounding effect of higher revenue against fixed costs. The 2026 landscape rewards precision over scale. Investors must monitor local regulatory changes and supply growth rates, as even minor oversupply in a submarket can quickly erode the occupancy margins that make these investments viable.
Calculating realistic rental property roi
Gross revenue figures from Airbnb market data tools often create a false sense of security. To build an accurate ROI model, you must move beyond top-line numbers and calculate net cash flow. This requires subtracting all operating expenses from the gross income to determine the actual profit margin.
Start by gathering historical occupancy rates and average daily rates (ADR) for the specific neighborhood. Use these metrics to project annual revenue. Then, deduct fixed costs such as mortgage payments, property taxes, and insurance. Variable costs—including cleaning fees, utilities, maintenance, and platform commissions—typically consume 25% to 50% of gross income depending on the market tier.
| Metric | High Occupancy Market | High ADR Market |
|---|---|---|
| Gross Revenue | $60,000 | $75,000 |
| Operating Expenses | $25,000 | $30,000 |
| Net Operating Income | $35,000 | $45,000 |
| Cash-on-Cash ROI | 8.5% | 11.2% |
A high-occupancy market may offer stability, but a high-ADR market often yields superior returns if demand remains resilient. Compare these scenarios side-by-side to identify which strategy aligns with your risk tolerance and capital structure.
Choose data platforms that prioritize official sources
Selecting a data platform is not just about finding a dashboard; it is about securing a reliable foundation for high-stakes investment decisions. The difference between a profitable acquisition and a stranded asset often lies in the depth and accuracy of the underlying data. Investors must look beyond superficial metrics like average daily rate and demand platforms that offer granular, historical insights into occupancy trends and revenue potential.
Why primary data matters
Many free or low-cost tools aggregate data from secondary sources, which can introduce latency and algorithmic bias. When you rely on platforms that do not connect directly to listing inventories or official transaction records, your market predictions may be flawed. Prioritizing tools that offer direct API access or verified primary data sources ensures that your due diligence is based on reality, not estimates.
Evaluating platform depth
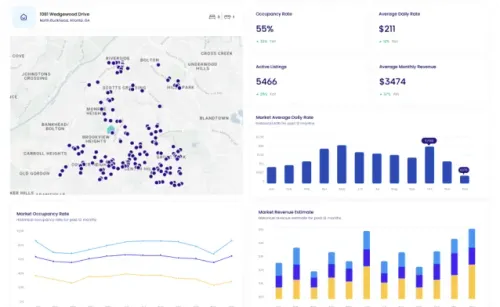
When comparing platforms like AirDNA, AirROI, or Airbtics, focus on the scope of their historical datasets and the granularity of their market coverage. AirDNA, for instance, tracks over 10 million rentals across 120,000 markets, providing a comprehensive view of the short-term rental landscape. AirROI offers data for over 20 million properties in 190+ countries, which is critical for investors looking at international markets. Airbtics provides a 3-year historical dataset at a daily level, allowing for robust trend analysis.
The cost of inaccurate data
In the context of 2026 Airbnb market data, the cost of inaccurate information is measured in lost equity and opportunity. A platform that fails to capture local regulatory changes, seasonal fluctuations, or hyper-local competition can lead to overvaluation of a property. By choosing a platform that emphasizes data depth and official sources, you protect your investment thesis against the volatility of the short-term rental market.
Making the final choice
Ultimately, the right platform is one that aligns with your specific investment strategy. If you are focused on domestic markets, a tool with deep local coverage like AirDNA may be sufficient. For global diversification, AirROI’s extensive international data might be more appropriate. Regardless of the choice, ensure the platform provides the transparency and historical depth required to make informed, data-driven decisions.
Applying the 75-55 and 80-20 rules
Investors often rely on heuristic frameworks to quickly filter viable short-term rental opportunities before committing to deep due diligence. Two specific rules—the 75-55 rule and the 80-20 rule—serve as initial screening metrics for occupancy stability and revenue concentration.
The 75-55 rule focuses on baseline occupancy. It suggests that a property should maintain at least 75% occupancy during peak seasons and 55% during shoulder or off-peak months to remain cash-flow positive. This threshold ensures that fixed costs like mortgage, insurance, and property management fees are covered even when demand dips. If a property consistently falls below these occupancy floors in historical data, it likely lacks the location fundamentals or pricing power to sustain long-term profitability.
The 80-20 rule addresses revenue concentration and operational risk. In this context, it warns that approximately 80% of a host’s gross income often comes from just 20% of their bookings or guests. While this might sound efficient, it highlights a vulnerability: losing a few high-value bookings can drastically impact annual income. Investors must verify that a property’s demand is diversified across seasons and guest types, rather than relying on a narrow set of peak-period events or corporate contracts.
These rules are not guarantees of success but rather filters for market fit. They help investors identify properties with resilient occupancy patterns and manageable revenue volatility, allowing them to focus on assets that meet basic financial thresholds before analyzing detailed ROI projections.
Final checklist for investment validation
Before committing capital, treat your short term rental investment as a stress-tested business model. This workflow moves from data verification to regulatory compliance, ensuring the numbers hold up under scrutiny.

Do not rely on host anecdotes or platform averages. Use AirDNA to pull the specific property’s historical occupancy and revenue data. Look for consistency over the last 12 months, not just peak season spikes. AirDNA provides the most granular short-term rental analytics available.
Calculate the true Net Operating Income (NOI) by subtracting all variable costs from gross revenue. Include cleaning fees, supplies, maintenance, and property management commissions. A healthy STR typically retains 30-40% of revenue after these expenses.
Short-term rental laws vary by zip code and can change overnight. Check your city’s planning department for zoning restrictions, occupancy limits, and permit requirements. In many markets, you must register as a business or pass a safety inspection before listing.
Run your projections using a 10% higher interest rate and 15% lower occupancy than your best-case scenario. If the deal still cash flows positively, it is resilient. If it turns negative, the leverage is too high for the current market cycle.
This validation process separates speculative bets from viable assets. By grounding your decision in verified data and regulatory reality, you protect your capital against market volatility.
No comments yet. Be the first to share your thoughts!