
Find reliable short term rental data sources
Before analyzing any market, you must establish a foundation of accurate data. Short-term rental (STR) metrics fluctuate rapidly due to seasonality, local regulations, and shifting demand. Relying on outdated or fragmented information leads to flawed underwriting and significant financial risk. The first step in using Airbnb market data for smarter rental investments is identifying platforms that provide authoritative, longitudinal datasets.
Prioritize platforms with 15+ years of historical data to smooth out seasonal anomalies and regulatory shifts.
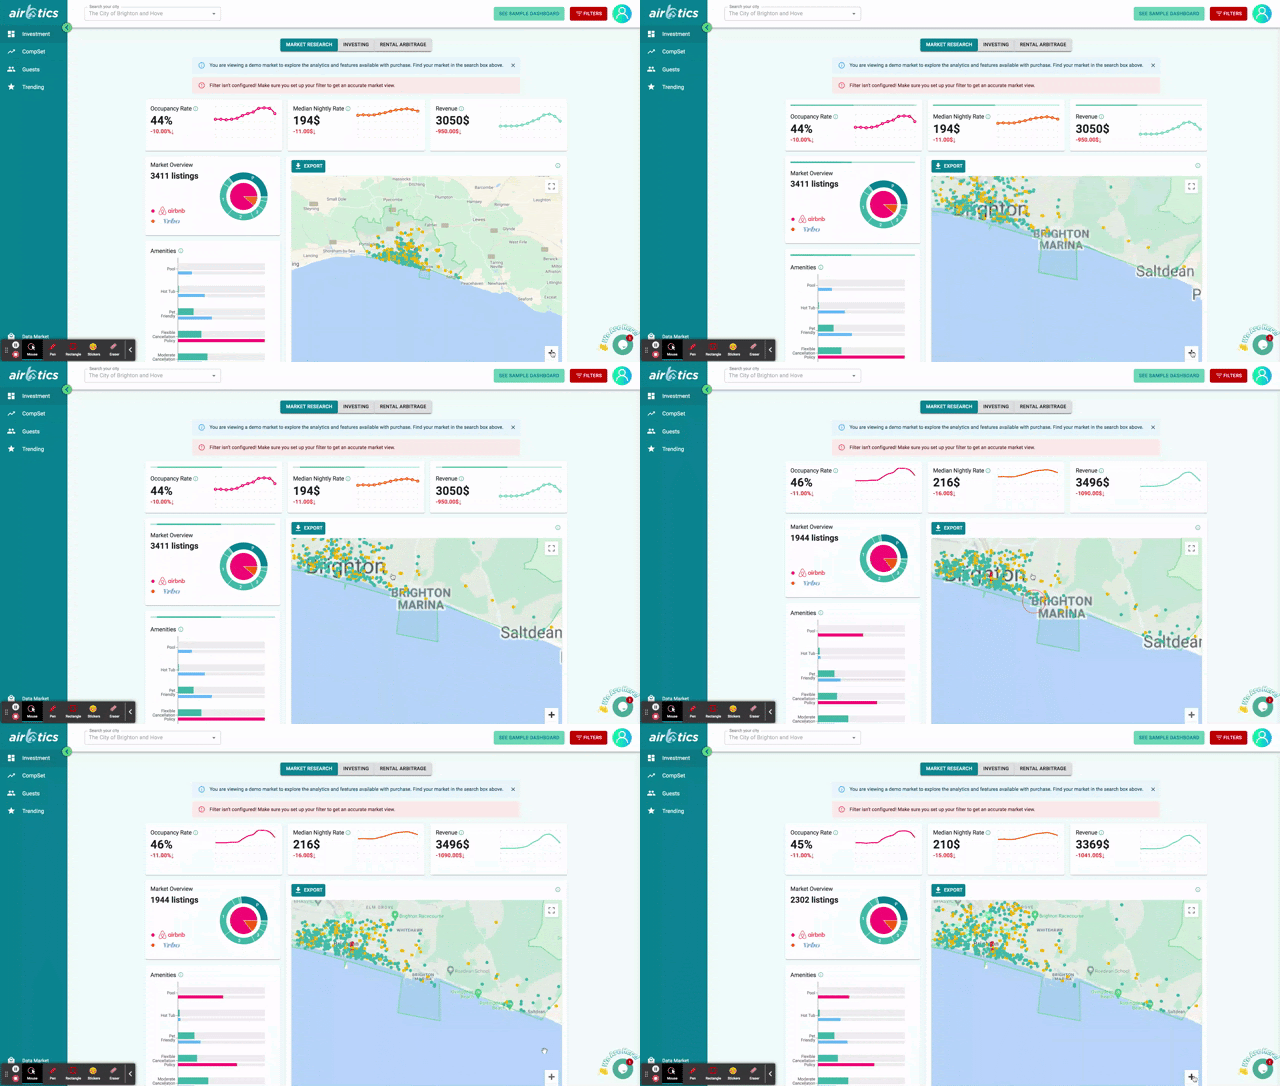
AirDNA serves as the industry standard for comprehensive STR analytics, tracking over 10 million rentals across 120,000 markets. Since its inception in 2015, it has built a robust dataset trusted by over 1.3 million users. Its strength lies in its breadth, offering granular insights into occupancy rates, average daily rates, and revenue projections for both Airbnb and Vrbo. This scale allows investors to benchmark properties against true market comparables rather than anecdotal evidence.
For investors seeking deeper API integration or specific regional focus, AirROI offers analytics for more than 20 million properties across 190 countries. It distinguishes itself with a 15+ year data history, which is critical for stress-testing financial models against past economic cycles. The platform also provides dynamic pricing tools and revenue calculators, making it a strong alternative for those needing automated data feeds.
Rabbu provides a compelling entry point for free Airbnb data and statistics, particularly for U.S. markets. While its historical depth may not match the paid giants, it offers real-time metrics and revenue projections that are sufficient for initial market screening. Using free tools like Rabbu for broad discovery, then validating findings with paid platforms like AirDNA, creates a cost-effective due diligence workflow.
Run the rental property ROI calculator
Market data is only useful if you translate it into cash flow projections. Using a dedicated Short-Term Rental (STR) calculator like BNBCalc or Mashvisor turns raw occupancy rates and Average Daily Rates (ADR) into tangible return metrics. This process removes guesswork, allowing you to stress-test assumptions against real numbers before committing capital.
Choose a platform built for STR-specific metrics. Standard mortgage calculators often miss variable costs like cleaning fees, dynamic pricing adjustments, and platform commissions. Tools like BNBCalc or Mashvisor are designed to ingest Airbnb market data directly, offering instant revenue projections based on address and local market conditions.
Enter your acquisition costs, including the purchase price, closing costs, and initial furnishing budget. Crucially, input your recurring fixed expenses: property taxes, insurance premiums, and HOA fees. These are the baseline costs that must be covered before you see any profit, regardless of occupancy levels.
Define the costs that fluctuate with each booking. This includes utilities, internet, cleaning fees paid to staff, and maintenance reserves (typically 10% of revenue). Accurate variable inputs are vital; underestimating these is the most common reason investors project inflated cash flow in their initial models.
Input the ADR and occupancy rate you gathered from your market research. Do not use optimistic "peak season" numbers for the entire year. Instead, use the annualized average or a conservative baseline to ensure your projections remain viable even during slower periods. This step directly links your market data to your bottom line.
Review the final metrics. Focus on Cash-on-Cash Return, which measures the annual pre-tax cash flow against the actual cash invested. Compare this against your required hurdle rate. If the calculator shows a negative cash flow or a return below your minimum threshold, the market data indicates the deal is not viable.
Compare top tools for market analysis
Choosing the right Airbnb market data platform depends on your budget, data depth needs, and technical comfort. The following table compares three leading platforms based on their core features, pricing models, and ideal user profiles.
| Platform | Pricing | Data Depth | Best For |
|---|---|---|---|
| AirDNA | Free tier; Pro from $99/mo | 10M+ listings, 120K markets, 3+ year history | Serious investors needing deep historical data |
| Airbtics | Free tier; Premium from $19/mo | Custom market analysis, daily historical data | Budget-conscious hosts and analysts |
| Awning | Free | City/ZIP level demand and occupancy | Beginners and casual investors |
AirDNA remains the industry standard for comprehensive data, offering the most robust historical datasets for serious investors. Airbtics provides a strong alternative for those needing specific market analysis without the premium price tag. Awning serves well for quick, free checks on basic demand metrics. Always verify data sources directly with the platform to ensure accuracy for your specific market.
Check occupancy rates and seasonality
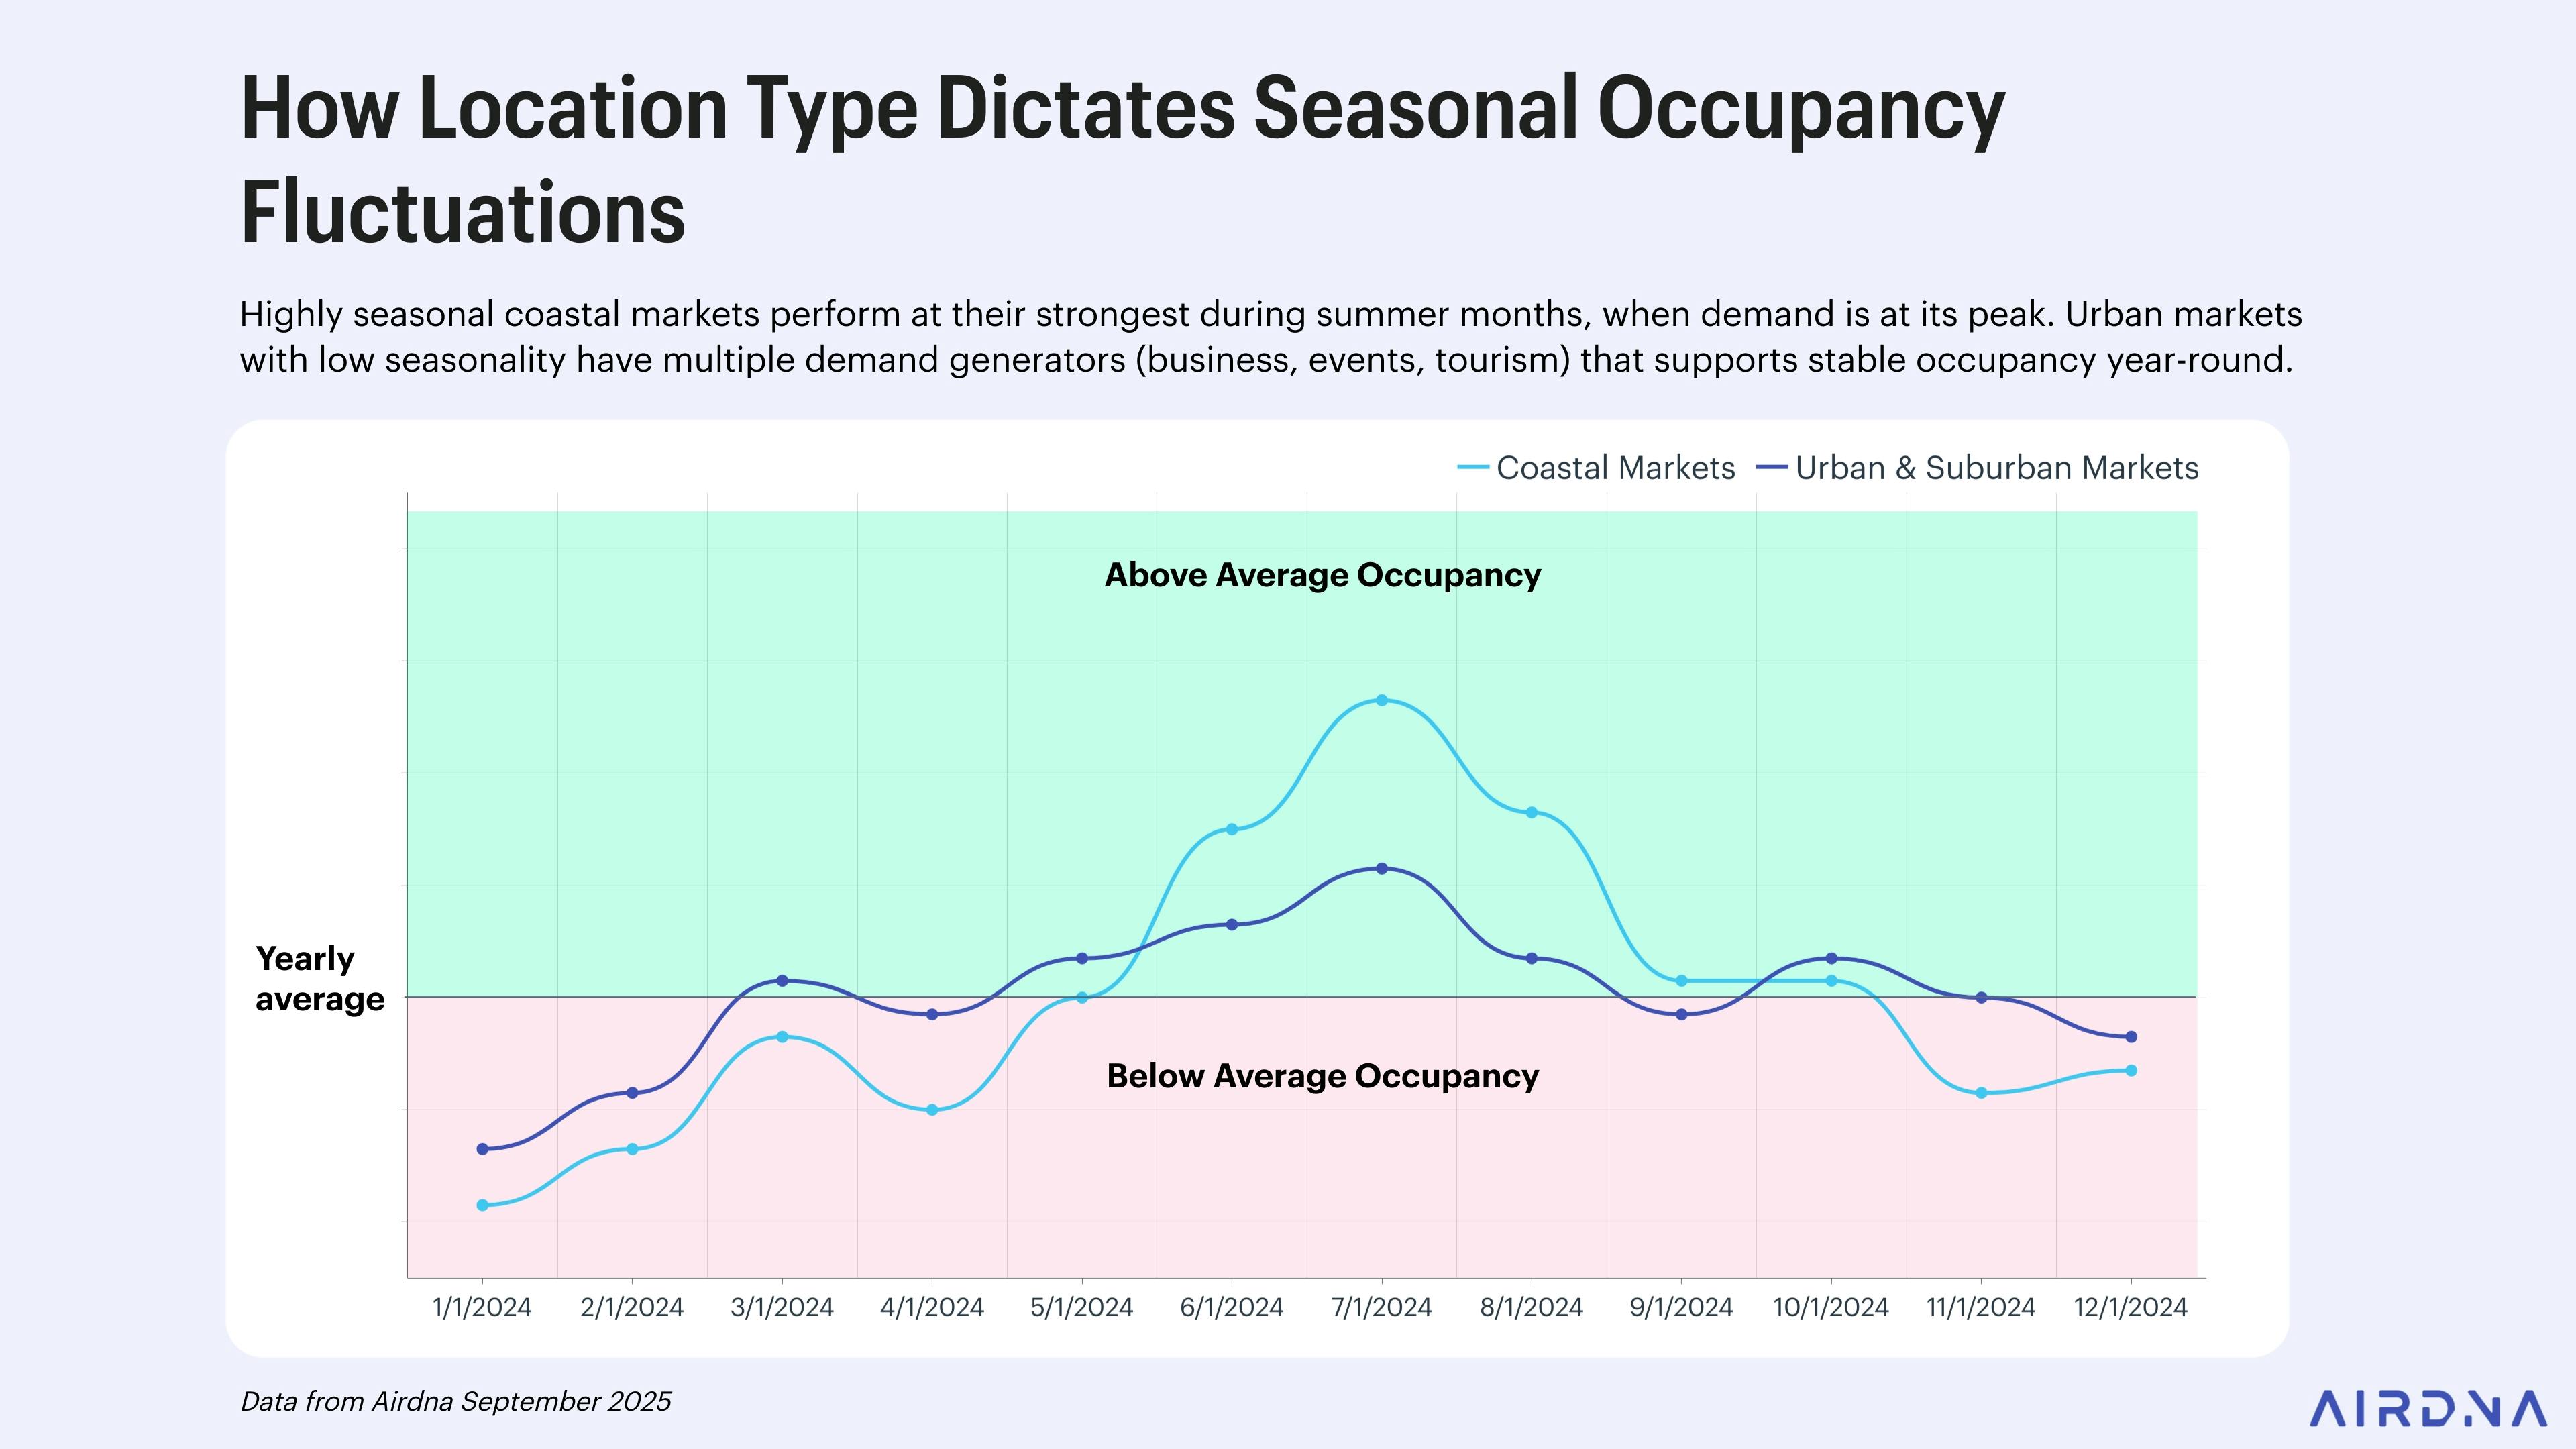
Annual revenue projections fail when they treat every month as identical. A property might show 80% occupancy in July but drop to 40% in November. If you average these months, you overestimate your income and underprepare for cash flow gaps. You must analyze occupancy by month to understand the true rhythm of your market.
Start by pulling the 12-month occupancy history for your specific zip code or neighborhood. Look for the "shoulder seasons"—the months between peak and low demand. This is where many new hosts get caught off guard. A steady 70% year-round is often more valuable than a volatile 85% peak with 30% lows, as it provides predictable cash flow for mortgage payments and maintenance reserves.
Seasonality dictates your pricing strategy. During low-occupancy months, you may need to lower your nightly rate or offer weekly discounts to attract longer stays. Conversely, during peak season, you can raise rates and implement minimum stay requirements to maximize revenue per available night (RevPAR). Ignoring these fluctuations leads to either empty rooms or missed profit opportunities.
Use this data to build a conservative cash flow model. Assume your occupancy will be 10–15% lower than the market average during your first year. This buffer protects you against unexpected vacancies or market shifts, ensuring you don't rely on optimistic seasonal peaks to cover your fixed costs.
Validate assumptions with local regulations
Data from platforms like AirDNA reveals market demand, but it does not account for the legal reality of operating a short-term rental. A property that looks profitable on paper can become a liability the moment local ordinances restrict occupancy or ban entire-home rentals. Before committing capital, you must verify that your specific address is eligible for short-term rental activity.
Start by checking your city or county’s planning department website for current STR ordinances. These rules vary wildly: some jurisdictions require a minimum number of nights rented per year, while others cap the total number of operating licenses. Look for sections titled "Short-Term Rental," "Vacation Rental," or "Tourism Tax." If the language is ambiguous, contact the local zoning office directly. Do not rely on third-party blogs or forum posts for legal interpretations.
Next, factor in the tax structure. Many municipalities impose transient occupancy taxes, hotel taxes, or business license fees that apply only to STRs. These costs can eat 10–20% of your gross revenue if ignored. Ensure your financial model includes these expenses as line items, not afterthoughts. Some cities also require annual registration numbers to be displayed on listing platforms. Failure to comply can result in heavy fines or forced closure.
Finally, review your homeowners association (HOA) or condo board rules. Even if city law permits STRs, private covenants often prohibit them. HOA violations are a common reason investors lose their properties to legal action. Request the most recent CC&Rs (Covenants, Conditions, and Restrictions) and look for clauses restricting rentals under 30 days. If the rules are unclear, get a written confirmation from the HOA board.
-
Verify city/county STR license eligibility for the specific address
-
Confirm minimum night stay requirements and occupancy caps
-
Calculate all transient occupancy and business license taxes
-
Obtain written HOA/condo board approval for short-term rentals
Common questions about Airbnb market data
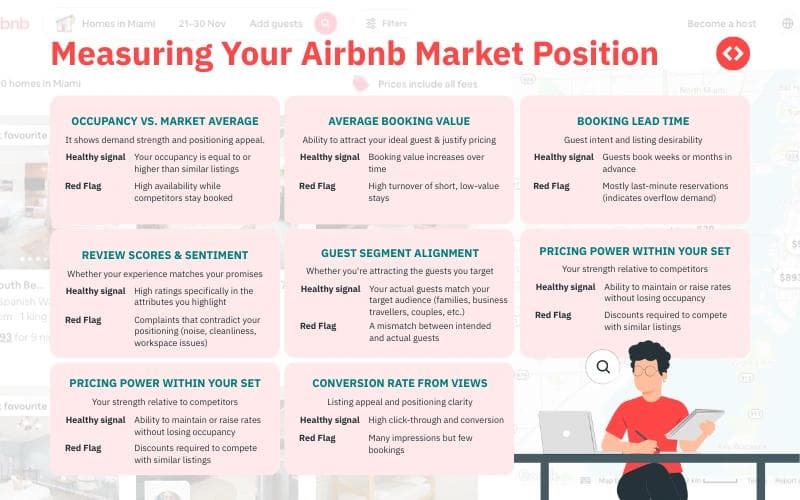
Investors often treat market data as a static snapshot, but short-term rental metrics are dynamic and seasonally dependent. Misinterpreting occupancy rates or average daily rates (ADR) can lead to overestimating cash flow and underestimating vacancy risk.
How accurate is third-party Airbnb data?
Platforms like AirDNA, Airbtics, and Mashvisor pull data from public listings and verified host submissions. While these tools cover millions of properties, they may not capture every unlisted or private rental. Use them for comparative market analysis, but always cross-reference with local permit data and actual host reports where available.
How do I calculate ROI using market data?
ROI depends on net operating income (NOI), not just revenue. Start with projected annual revenue from market ADR and occupancy estimates, then subtract fixed costs (mortgage, insurance, taxes) and variable costs (cleaning, maintenance, platform fees). The result divided by your total cash investment gives you the cash-on-cash return.
What metrics matter most for Airbnb investment?
Occupancy rate and ADR are the primary drivers of revenue, but they must be viewed alongside seasonal trends. A market with high ADR but low winter occupancy may yield less annual profit than a stable, mid-range market. Look for consistent year-round demand rather than peak-season spikes.
Can I trust Airbnb’s own published data?
Airbnb provides some public data through its Transparency Center, but it often aggregates information broadly and may not reflect granular neighborhood-level performance. For investment decisions, specialized STR analytics platforms offer more detailed, property-level insights and historical trends than Airbnb’s general reports.
No comments yet. Be the first to share your thoughts!