
Why use an Airbnb revenue calculator
Estimating short-term rental income by hand is a recipe for financial error. Manual calculations rely on static assumptions that ignore the volatility of seasonal demand, local regulatory shifts, and fluctuating occupancy rates. Without a dedicated Airbnb revenue calculator, you are essentially guessing your cash flow before you have even purchased a property.
Professional tools like the AirDNA Rentalizer aggregate real short-term rental (STR) comp data to generate projections for revenue, average daily rate (ADR), and occupancy. These platforms transform fragmented market signals into a single, data-driven confidence metric. This is not just about convenience; it is about due diligence.
For high-stakes investment decisions, precision matters. A 5% error in occupancy assumptions can mean the difference between a profitable asset and a money-losing liability. Using a specialized calculator ensures you are basing your purchase price on verified market performance rather than optimistic estimates.
Enter property details and location
The accuracy of your Airbnb revenue calculator output depends entirely on the precision of your initial inputs. Financial projections are only as reliable as the data fed into them; vague or incorrect property specifications will skew revenue estimates, occupancy rates, and profitability metrics. Treat this input phase as a due diligence exercise rather than a formality.
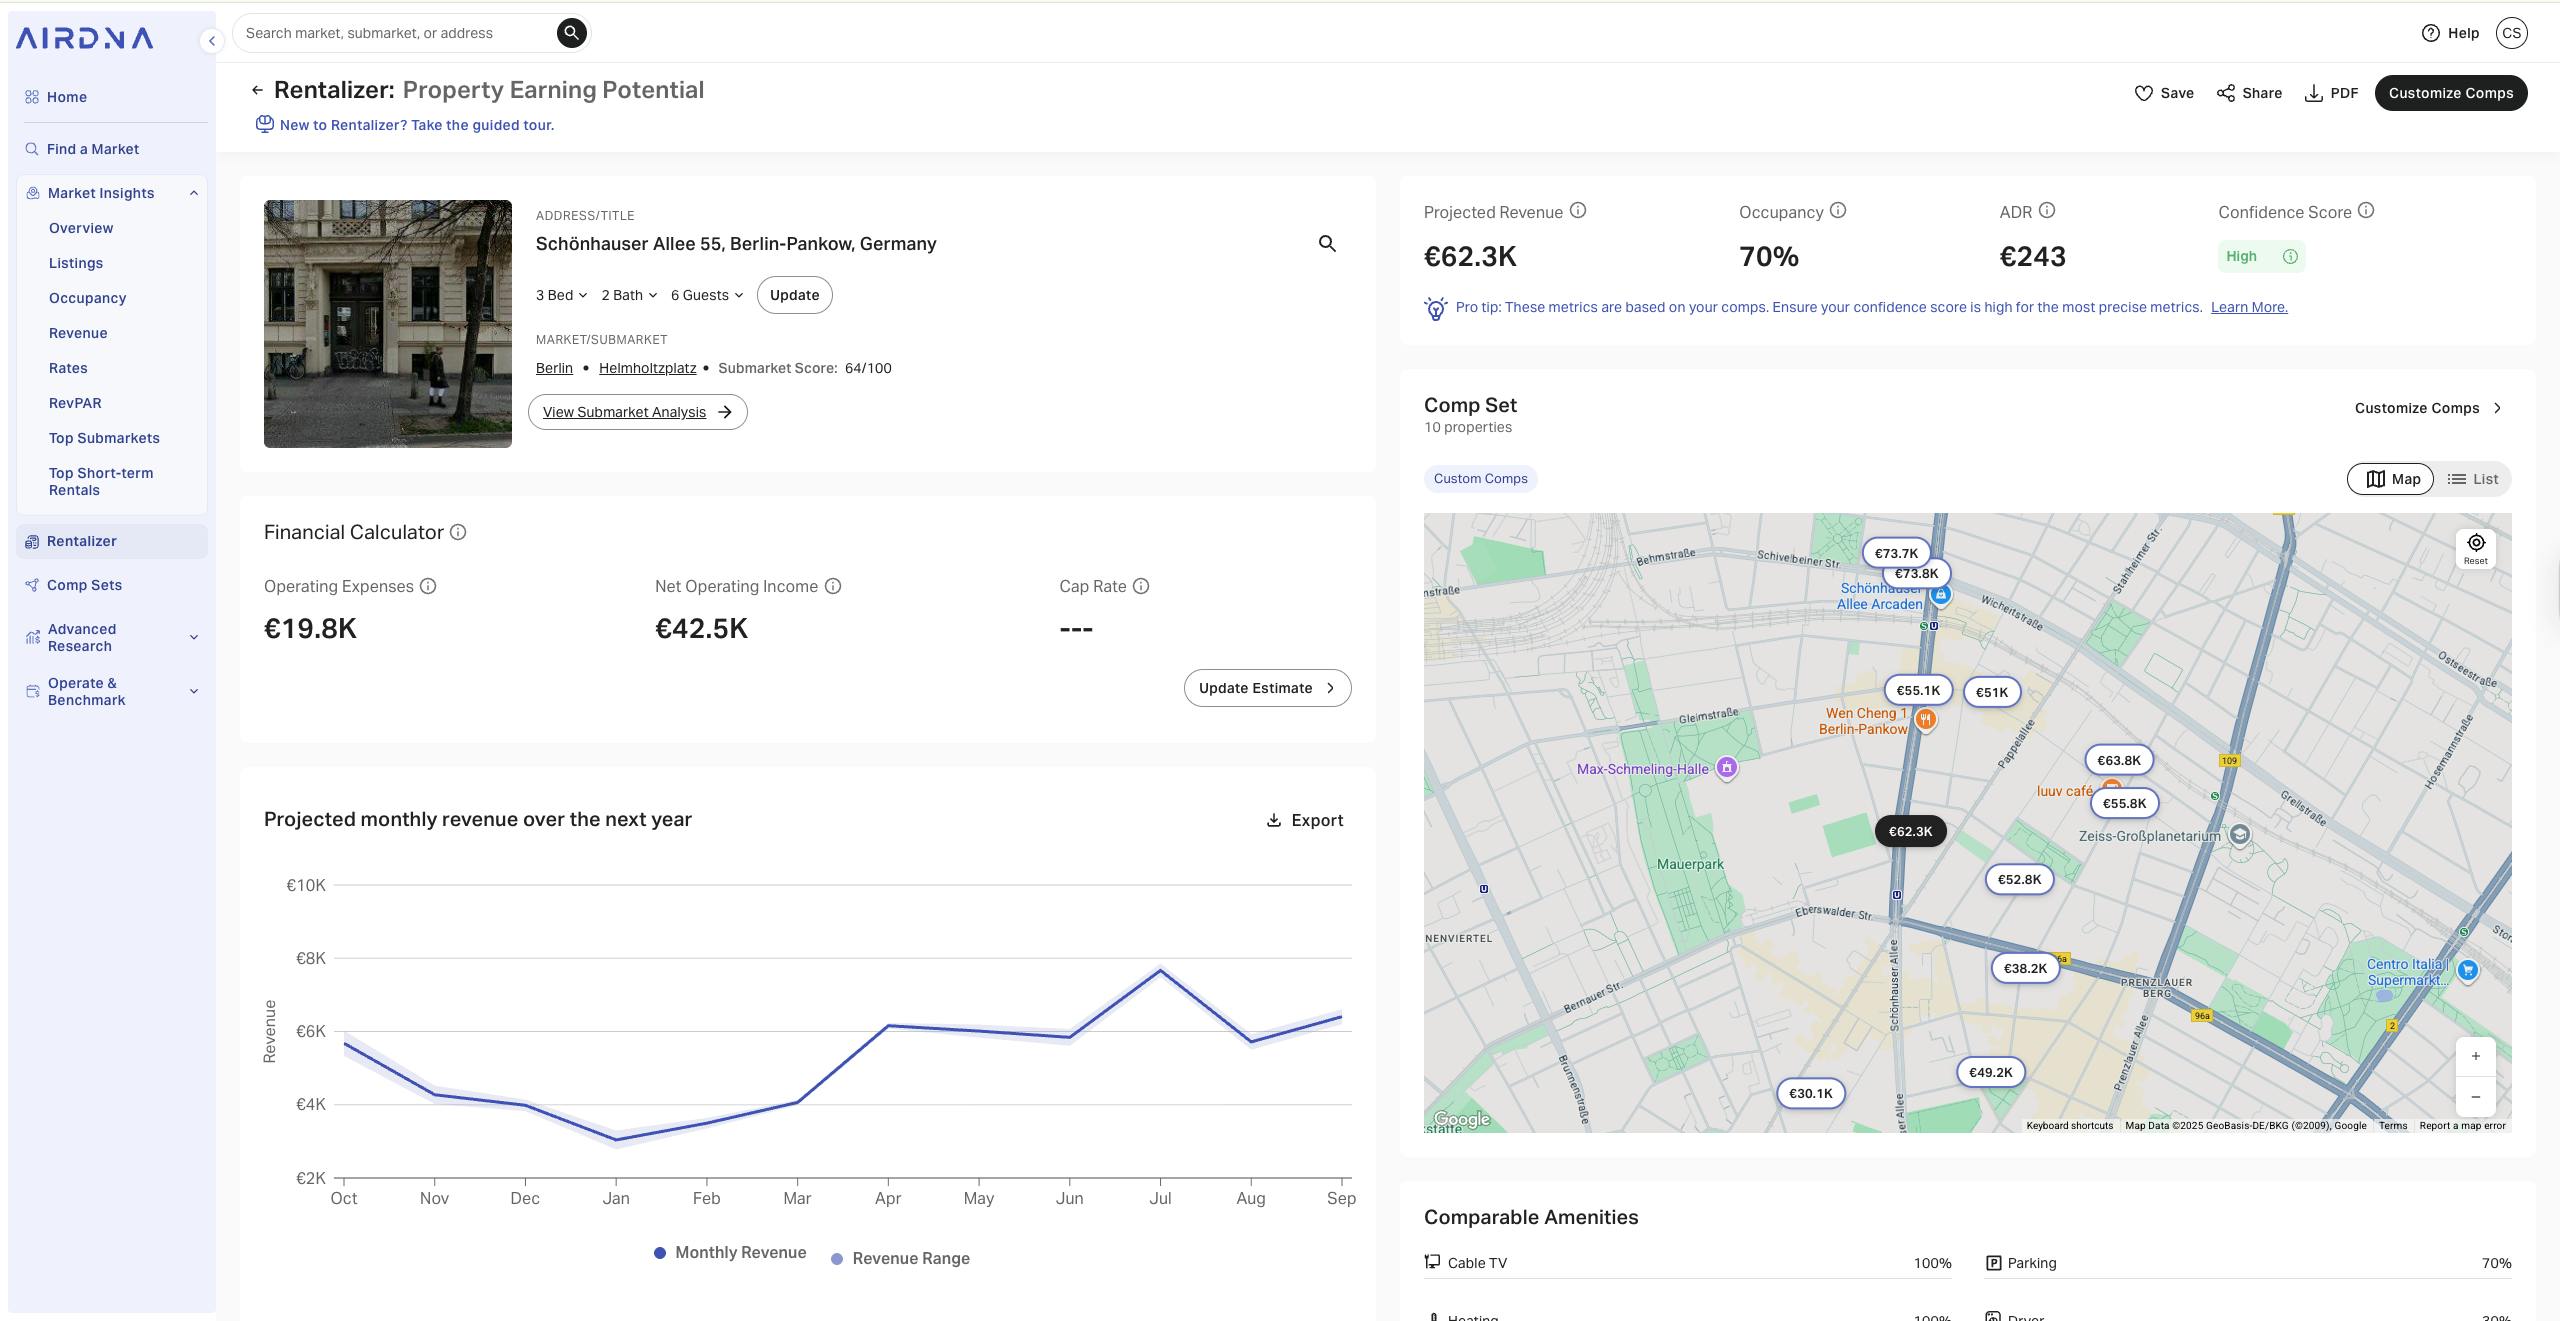
Begin by entering the full, exact street address. Location is the primary driver of demand and pricing power. Calculators like those from BNBCalc or AirROI use geospatial data to identify comparable short-term rentals within a specific radius. An imprecise address can pull data from a different neighborhood, leading to inaccurate average daily rate (ADR) projections.
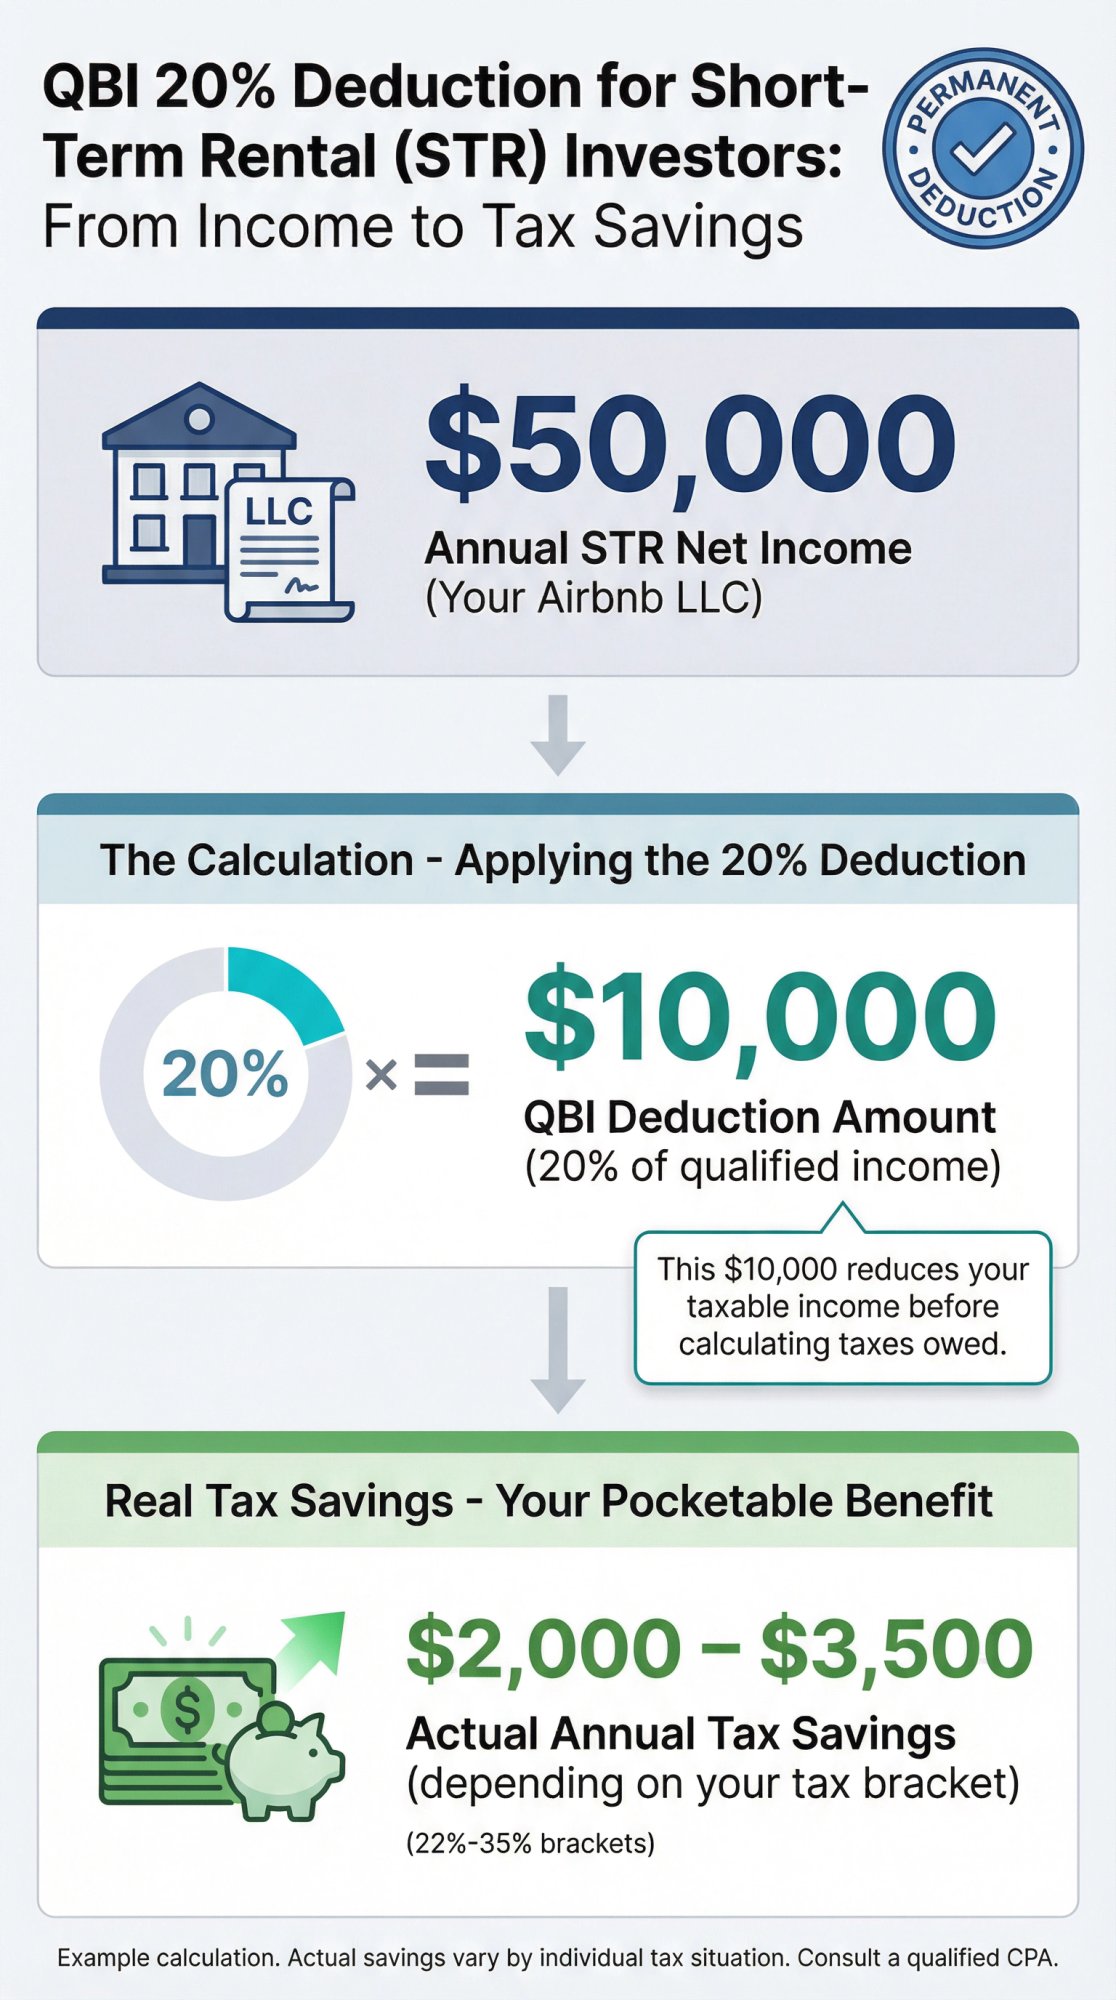
Define the physical structure of the rental. Specify whether it is a single-family home, condo, townhouse, or multifamily building, and accurately count the number of bedrooms and bathrooms. If the property contains multiple distinct units (e.g., a duplex), input the count for each unit separately. This data helps the algorithm adjust for economies of scale and market-specific occupancy trends associated with that property type.

Detail the amenities that drive premium pricing, such as pools, hot tubs, or parking. Inaccurate amenity selection can significantly alter the calculated revenue potential. Ensure the rental type matches your actual strategy (e.g., entire home vs. private room), as these categories have vastly different occupancy and revenue profiles in most markets.
Every data point entered here filters through comparable property databases. Small errors compound quickly, turning a realistic profit forecast into a misleading estimate. Double-check every field before calculating to ensure your financial model rests on a solid foundation.
Adjust occupancy and daily rate assumptions
Your initial revenue estimate is only as reliable as the inputs you feed into it. Treat your first calculation as a baseline, not a guarantee. To understand the true financial risk, you must stress-test the model by adjusting occupancy and daily rate assumptions to reflect different market conditions. This process reveals the gap between your best-case scenario and your worst-case reality.
Start by defining your conservative and aggressive metrics. A conservative model uses lower occupancy rates and seasonal daily rates to protect against underperformance. An aggressive model assumes high occupancy and peak-season pricing year-round. By comparing these two, you identify the margin of safety required to cover fixed costs like mortgage, insurance, and property management fees.
| Scenario | Occupancy Rate | Avg. Daily Rate (ADR) | Monthly Gross Revenue |
|---|---|---|---|
| Conservative | 55% | $120 | $1,980 |
| Moderate | 70% | $140 | $2,940 |
| Aggressive | 85% | $160 | $4,080 |
Use the data from local short-term rental platforms to ground these numbers. According to Airbtics, a simple way to estimate revenue is multiplying your year-round occupancy rate by your average daily rate. However, do not rely on average city-wide data alone. Narrow your scope to your specific neighborhood or zip code, as demand can vary significantly block by block.
If your conservative monthly revenue does not cover your total expenses, the investment is likely too risky. You must either reduce your acquisition cost, increase your daily rate through better amenities, or accept a lower margin. Never base your purchase decision on the aggressive scenario alone; that is the ceiling, not the floor.
Factor in operating expenses and taxes
Your gross revenue is just the starting line. To find your true net operating income (NOI), you must subtract every cost associated with running the property. Skipping these deductions is the most common reason new hosts overestimate their profits and face cash flow crises.
Subtract fixed and variable costs
Start by listing your recurring fixed costs. These include your mortgage or rent, property insurance, HOA fees, and property management fees (typically 15-25% of revenue). Next, add variable costs that change with occupancy: cleaning fees, utilities (electricity, water, internet), Wi-Fi, and consumables like toiletries and coffee.
Account for taxes and maintenance
Don’t forget the IRS. You must set aside money for income tax and, in many jurisdictions, transient occupancy taxes or tourist taxes. Also, budget for maintenance and repairs. A standard rule is to reserve 10% of gross revenue for unexpected fixes, from leaky faucets to broken appliances.
Verify your net profit
Once you have all expenses, subtract the total from your gross revenue. The result is your NOI. If this number is negative, your pricing or occupancy strategy needs adjustment before you list. Double-check your local tax requirements, as non-compliance can result in heavy fines.
-
Property management fees (15-25%)
-
Utilities (electricity, water, gas, internet)
-
Cleaning supplies and laundry
-
Maintenance and repair fund (10% of revenue)
-
Insurance and property taxes
-
Platform service fees (Airbnb/VRBO)
-
Licensing and transient occupancy taxes
-
Restocking toiletries and coffee
Read the Cap Rate and Cash-on-Cash Returns
The calculator’s output is not a guarantee of profit; it is a stress test for your financial assumptions. Two metrics determine whether a property is a viable investment or a money pit: the Cap Rate and the Cash-on-Cash return. Understanding how to read these figures prevents you from overpaying for a property that looks attractive on the surface but fails in reality.
The Capitalization Rate (Cap Rate)
The Cap Rate measures the property’s raw earning potential before financing costs. It answers the question: "How much cash flow does this property generate relative to its purchase price?" A higher Cap Rate generally indicates a higher return on investment, but it also signals higher risk or lower growth potential in that specific market.
When interpreting this number, compare it to local commercial real estate trends. A Cap Rate that significantly deviates from the neighborhood average warrants deeper scrutiny. If the number seems too good to be true, your input assumptions—such as occupancy rates or nightly rates—are likely inflated. Treat this metric as your first filter for deal viability.
Cash-on-Cash Return
While the Cap Rate ignores debt, the Cash-on-Cash return tells you exactly how much your initial down payment and closing costs are working for you. This is the most critical metric for individual investors because it reflects your actual liquid return. It accounts for mortgage payments, property management fees, and maintenance reserves.
A strong Cash-on-Cash return typically exceeds the return you could earn in a low-risk portfolio like index funds or high-yield savings accounts. If your calculator shows a low single-digit return, the property may not justify the operational hassle and risk of short-term rental management. Use this figure to decide if the effort matches the reward.
Validate Your Assumptions
Before signing any contracts, audit the inputs that drive these numbers. Short-term rental income is volatile and heavily dependent on seasonality, local regulations, and competition. Use reputable data sources like AirDNA to verify your projected occupancy and average daily rate (ADR) against actual market performance in that specific zip code.
If the calculator’s output relies on optimistic assumptions that don’t match local comp data, the resulting Cap Rate and Cash-on-Cash figures are meaningless. Adjust your inputs to reflect conservative, realistic scenarios. Only proceed with a property when the numbers hold up under a worst-case scenario, not just a best-case forecast.
Common calculation errors to avoid
Even with a robust airbnb revenue calculator, optimistic bias can distort your projections. A frequent error is assuming 100% occupancy year-round. In reality, most short-term rentals operate closer to 60–75% occupancy depending on market saturation and seasonality. Overestimating occupancy rates inflates your projected net income, leading to poor investment decisions.
Ignoring local regulatory restrictions is another high-stakes risk. Many cities impose strict limits on short-term rentals, including permit fees, occupancy taxes, or outright bans. Before finalizing any financial model, verify local zoning laws and licensing requirements. Failure to account for these compliance costs can erase your profit margin entirely.
Finally, neglecting seasonality skews your annual revenue estimates. A property might generate strong income during peak summer months but struggle in winter. Use historical data from platforms like AirDNA or local tourism boards to adjust your monthly revenue assumptions. This approach ensures your airbnb revenue calculator reflects realistic, market-driven expectations rather than idealized scenarios.
No comments yet. Be the first to share your thoughts!