
Start with a reliable data source
You cannot build a high-ROI Airbnb strategy on guesswork. Relying on manual searches on Airbnb.com or outdated census data is like navigating a storm without a compass; you might find land eventually, but you will likely crash first. Official government statistics often lag by 12 to 18 months, rendering them useless for capturing the real-time volatility of short-term rental markets. To make data-driven decisions, you need authoritative third-party analytics platforms that track live performance metrics.
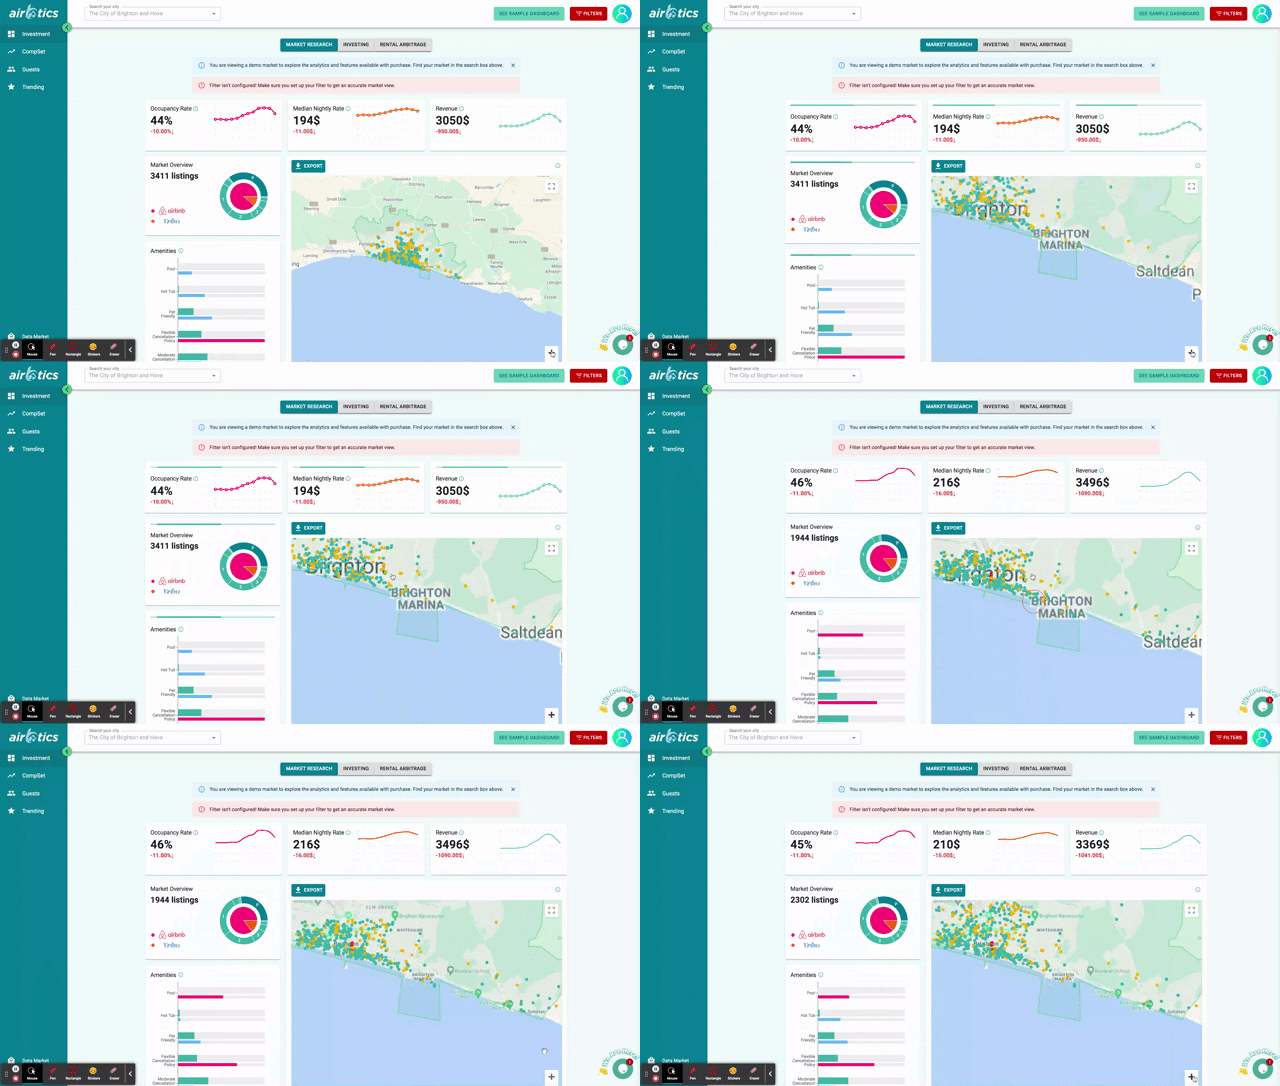
Platforms like AirDNA and AirROI aggregate data from millions of listings, providing the granular insights necessary for precise market analysis. Instead of scrolling through hundreds of active listings to manually calculate averages, these tools deliver standardized metrics such as Average Daily Rate (ADR), Occupancy Rate, and Revenue Per Available Room (RevPAR). These figures allow you to benchmark your potential property against comparable competitors in specific neighborhoods.
For example, knowing the historical ADR for a specific zip code helps you set dynamic pricing that maximizes revenue during peak seasons while remaining competitive during slower periods. Similarly, understanding occupancy trends prevents you from overpricing your listing, which can lead to long stretches of vacancy. By starting with reliable, real-time data, you shift from hoping for success to engineering it.
Compare key market metrics side by side
To evaluate an Airbnb market accurately, you must look beyond the headline revenue number. Relying on a single metric like Gross Revenue can be misleading, as it ignores the cost of vacancies and the efficiency of your pricing strategy. Instead, investors should triangulate three core data points: Occupancy Rate, Average Daily Rate (ADR), and Revenue Per Available Room (RevPAR). These metrics provide a standardized way to compare neighborhoods or property types on equal footing.
Occupancy Rate measures the percentage of nights your property is booked over a specific period. While a 100% occupancy rate sounds ideal, it often indicates you are underpricing your asset. Conversely, a high ADR with low occupancy can leave you with empty rooms and negative cash flow. The most reliable indicator of overall performance is RevPAR, which combines both volume and price into a single efficiency score. It tells you how much revenue each available night actually generates, regardless of whether it was booked at a high or low rate.
When comparing markets, use a side-by-side view to spot discrepancies. A neighborhood might boast a high ADR, but if the occupancy rate is significantly lower than the city average, the RevPAR may actually be inferior to a more stable, mid-range market. This comparison helps you identify where the true value lies—whether in premium pricing power or consistent demand volume.
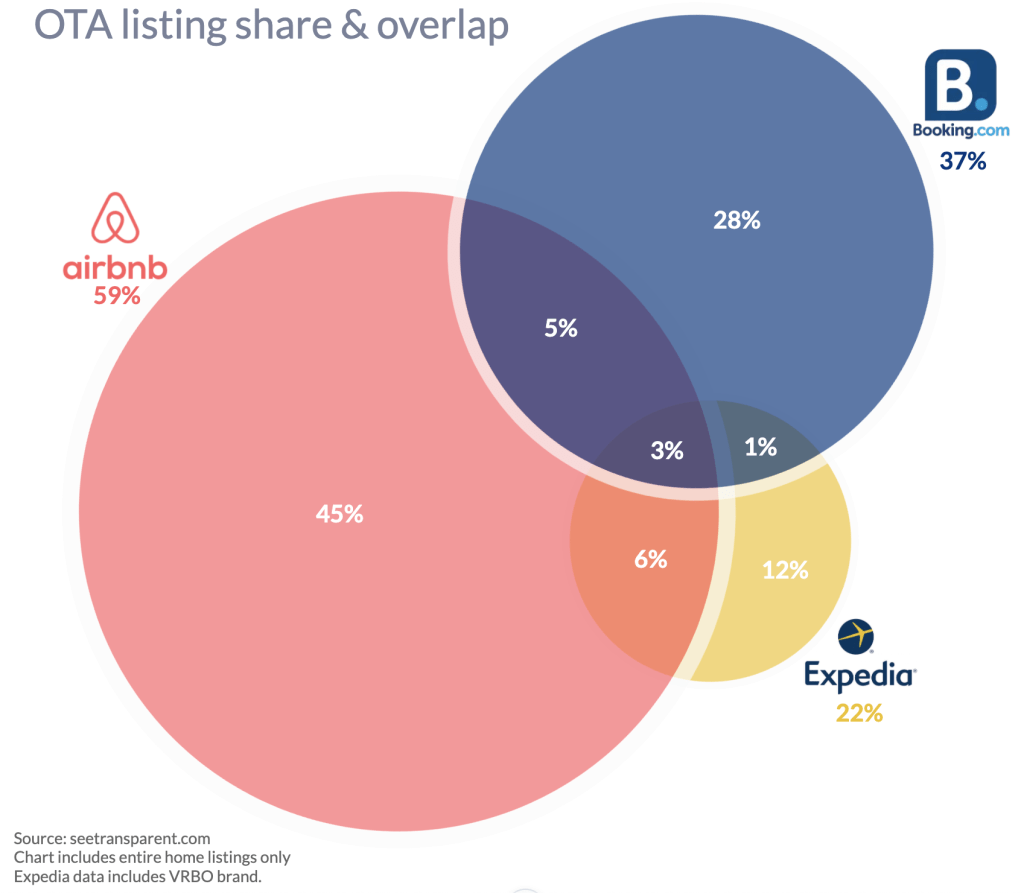
The following table compares three hypothetical market scenarios to illustrate how these metrics interact. Notice how Market B offers a balanced approach, while Market C’s high price point fails to convert into higher overall revenue due to lower occupancy.
| Market Profile | Avg. Occupancy | ADR (Nightly) | RevPAR |
|---|---|---|---|
| Market A (Budget) | 92% | $120 | $110 |
| Market B (Balanced) | 85% | $150 | $127 |
| Market C (Premium) | 60% | $250 | $150 |
Run the numbers with a revenue calculator
Gross revenue is a vanity metric; net cash flow is what keeps your doors open. To determine if a property actually works for your portfolio, you must move beyond surface-level occupancy stats and plug market data into a detailed financial model. This process separates viable investments from liabilities by accounting for the hidden costs that erode profit margins.
Use a dedicated STR calculator to input your specific market variables. These tools aggregate real-time data on Average Daily Rate (ADR) and occupancy percentages to project gross income, then subtract operating expenses to reveal true cash flow.
Begin by inputting the exact address or ZIP code. Select the property type (e.g., entire home, private room) because Airbnb’s algorithm treats these categories differently. This step ensures the calculator pulls comparable listings from the correct neighborhood segment, avoiding skewed data from mixed-use zones.
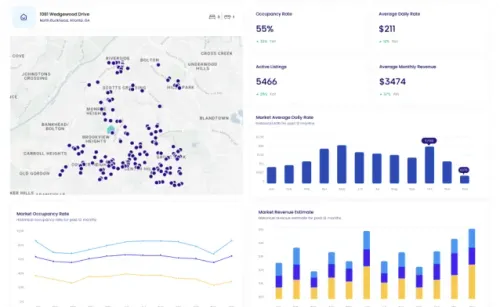
Choose a set of direct competitors with similar bedroom counts and amenities. The calculator will use these comparables to estimate your potential Average Daily Rate (ADR) and occupancy rate. Be conservative; using the top 10% performers often leads to overestimating your own revenue potential.
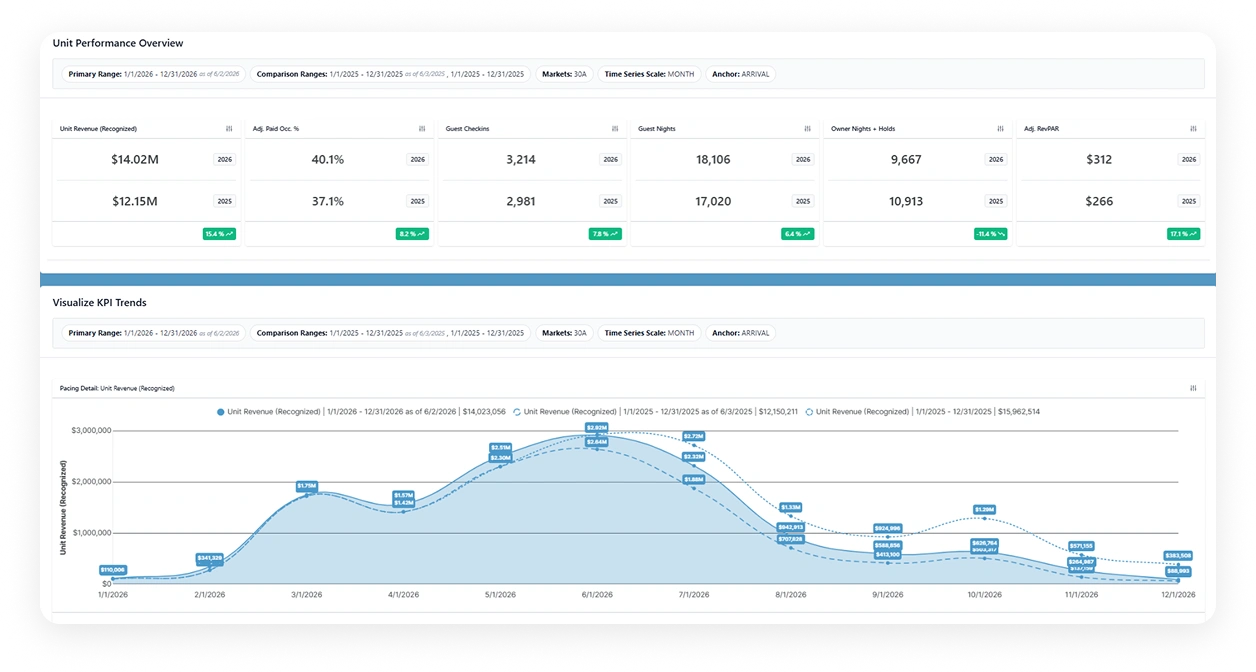
Enter the acquisition cost, down payment, and interest rate. This step shifts the focus from top-line revenue to bottom-line profitability. Financing terms dramatically impact your monthly cash flow, so accurate input here is non-negotiable for a realistic ROI projection.
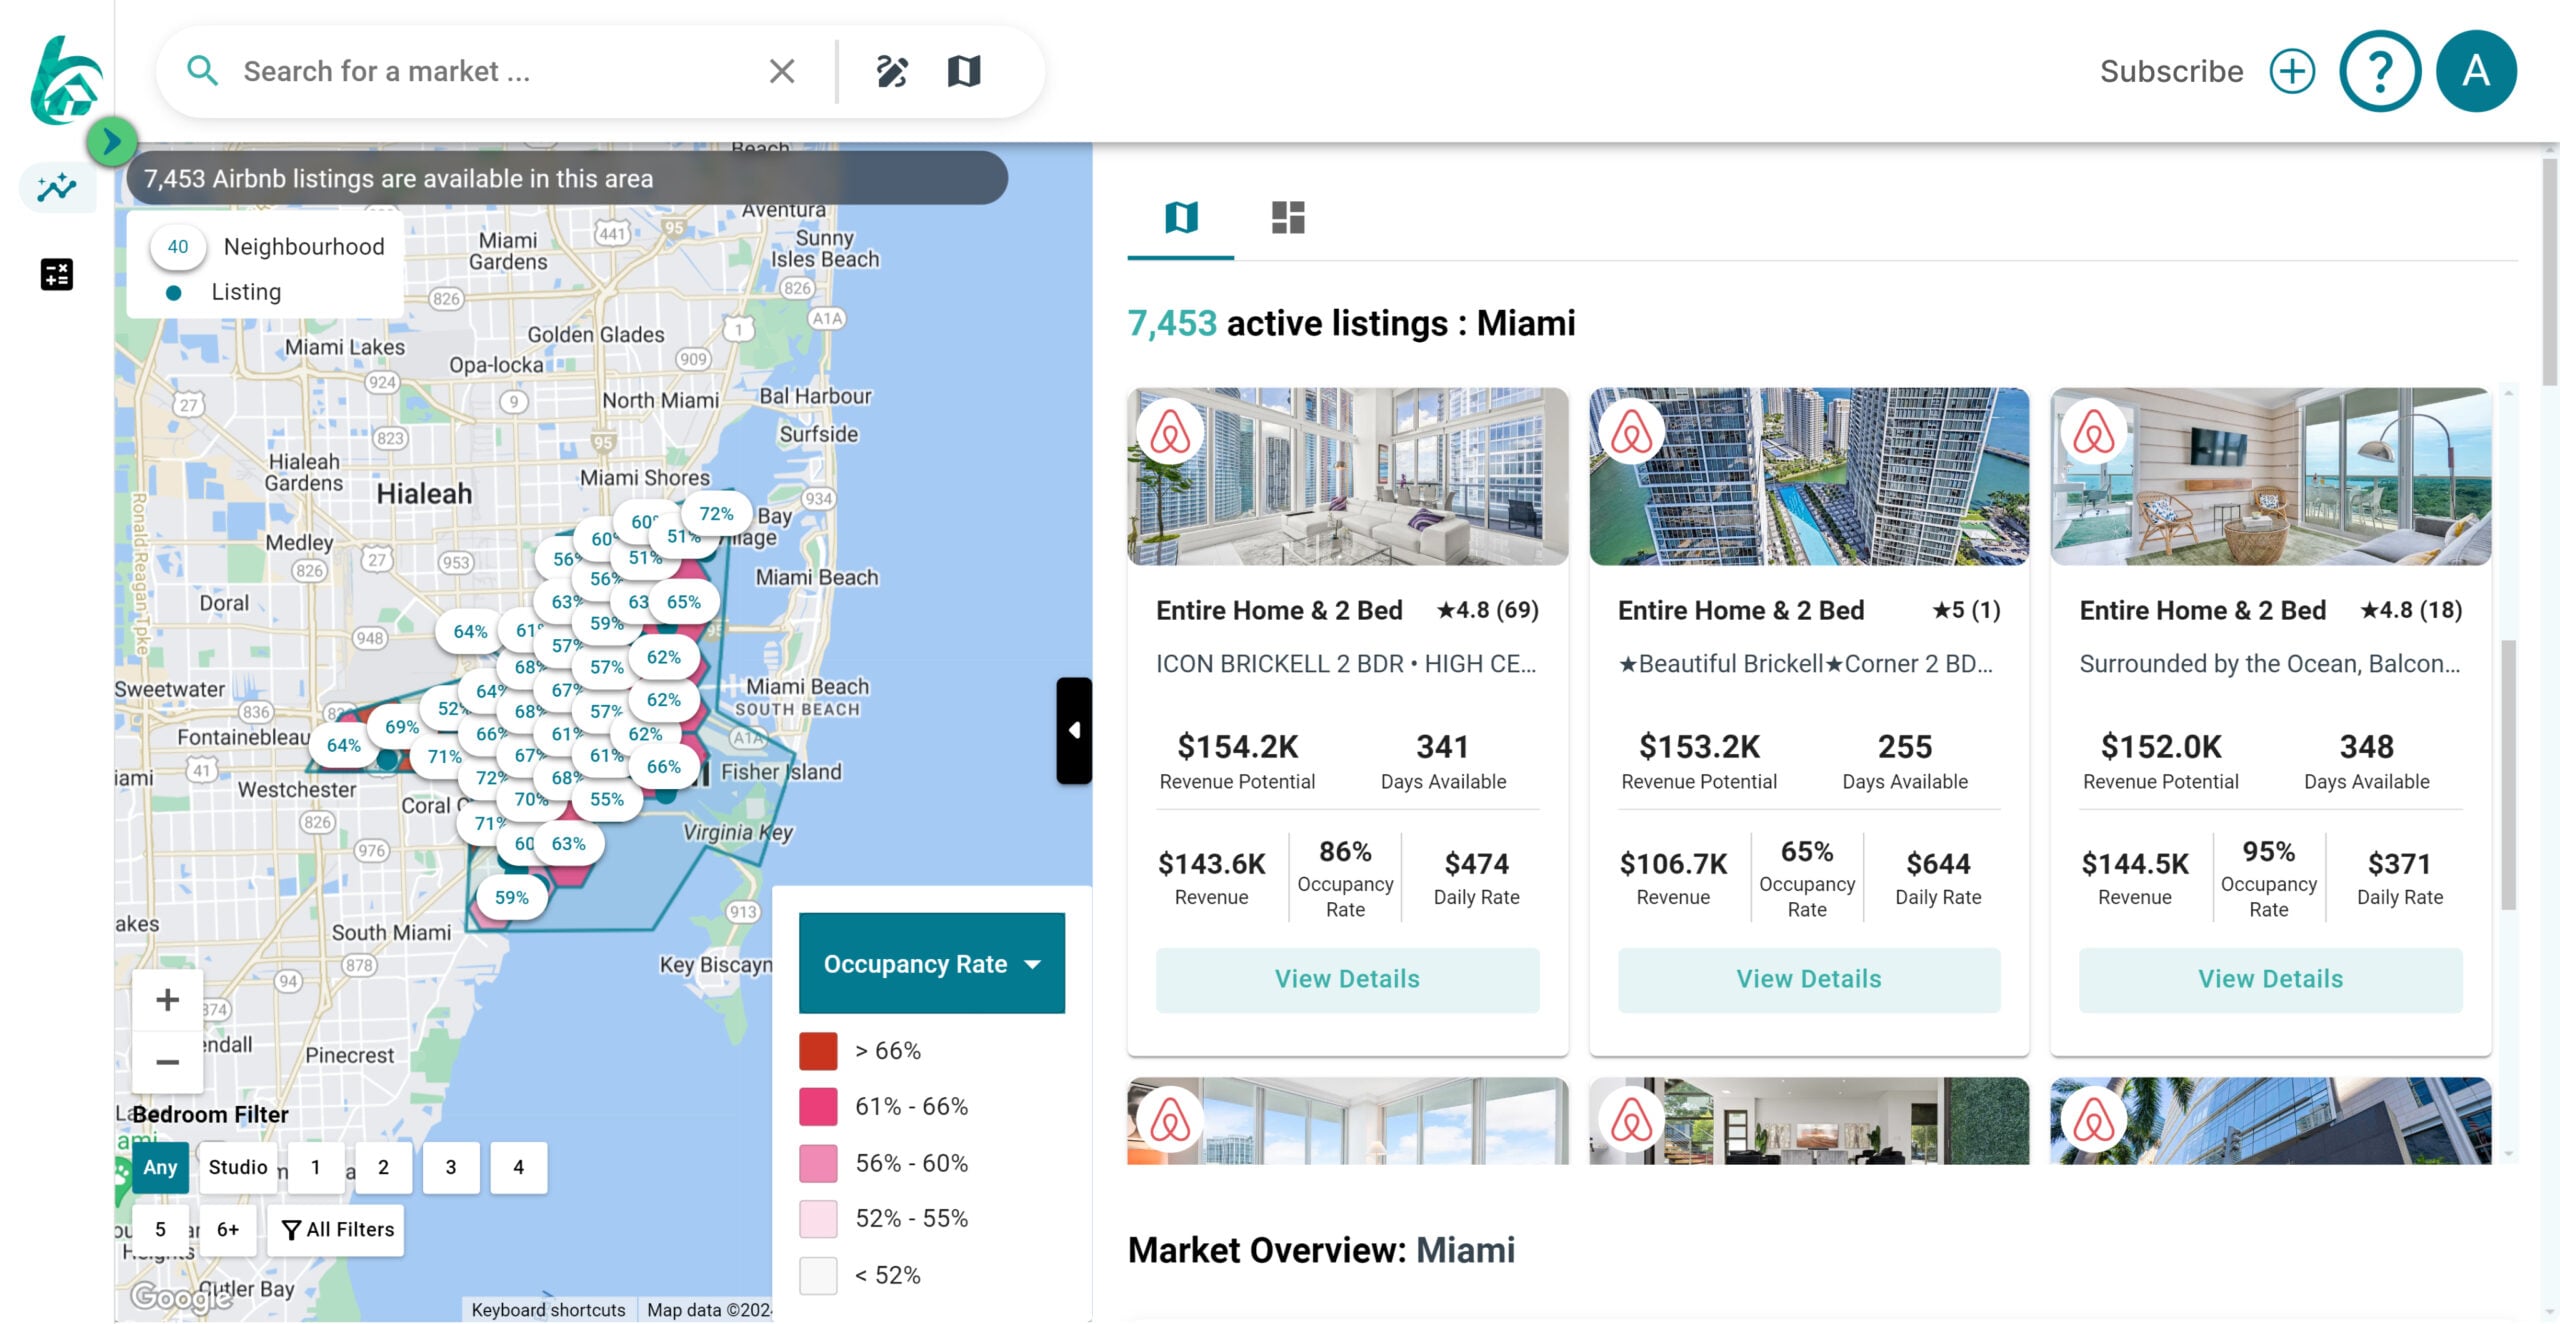
Analyze the net operating income (NOI) after subtracting property management, cleaning, utilities, and maintenance. This final figure represents your actual monthly profit. If the cash flow is negative or barely covers the mortgage, the deal likely fails the investment test regardless of how high the gross revenue appears.
A critical warning: gross revenue figures from market reports do not account for local regulatory risks. Many cities impose strict occupancy taxes, licensing fees, or outright bans on short-term rentals. Before finalizing your financial model, verify local ordinances. A property that looks profitable on paper can become a legal liability if it violates zoning laws. Always cross-reference your calculator’s output with current municipal codes to ensure the investment remains compliant and sustainable.
Check local regulations and caps
Market data is only as valuable as the legal framework that allows you to operate. A property might show stellar ADR and occupancy projections, but if the city bans short-term rentals entirely or caps the number of allowable days, those metrics become irrelevant. Regulatory risk is the silent killer of Airbnb ROI, turning a profitable investment into a liability overnight.
Before you commit capital, you must verify the specific zoning laws and licensing requirements for your target location. Many municipalities have introduced strict ordinances requiring primary residency, limiting rentals to a certain number of days per year, or mandating registration fees. Ignoring these rules can result in heavy fines, forced removal from platforms, or even legal action.
To mitigate this risk, treat regulatory compliance as part of your due diligence process. Check your city’s planning department website for current short-term rental ordinances. Look for recent legislation that might be pending or recently passed. If the rules are ambiguous, consult with a local real estate attorney who specializes in hospitality law. Understanding the legal landscape is just as important as analyzing the financials.
Common mistakes in market analysis
Most investors lose money not because the market is bad, but because they read the data wrong. Even with tools like AirDNA or Airbtics, it is easy to misinterpret metrics when you are eager to buy.
The biggest trap is ignoring seasonality. Many new hosts look at the average daily rate for the whole year and assume that stability. In reality, a market might have high occupancy in July but drop to 20% in January. If you model your cash flow on the annual average, you will run out of cash during the lean months.
Another frequent error is overestimating occupancy rates. Platforms often show "potential" occupancy, which assumes 100% booking efficiency. Actual occupancy is always lower due to gaps, maintenance, and cleaning. If you plan for 80% occupancy but only achieve 65%, your return on investment (ROI) will vanish.
Finally, do not forget property management fees. If you hire a manager, they typically take 20–25% of gross revenue. This is a major expense that eats into your net operating income. Always deduct this from your revenue projections before calculating your final ROI.
Investor checklist for due diligence
Before signing a purchase agreement, verify that your financial projections hold up against hard market data. Relying on generic averages rather than property-specific metrics is a common mistake that leads to negative cash flow.

Confirm zoning laws and short-term rental permits are active. Fines or forced closures can wipe out ROI instantly.
Use tools like AirDNA to check historical occupancy and Average Daily Rate (ADR) for the exact neighborhood. Ensure the data supports your revenue assumptions.
Calculate RevPAR using lower-bound occupancy estimates. Factor in all expenses, including cleaning, maintenance, and property management fees.
Compare the asking price to recent sales of similar short-term rental properties in the area to ensure you aren't overpaying.
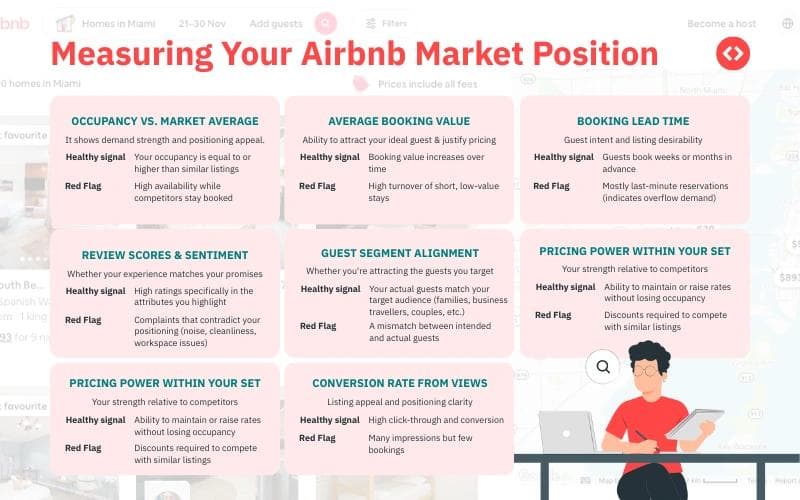
Use this checklist to ensure every decision is backed by verified Airbnb market data. Skipping these steps risks turning a promising investment into a financial liability.
No comments yet. Be the first to share your thoughts!