
Beyond Gut Feeling: Why an Airbnb Revenue Calculator is Essential for 2026
Let’s be honest: relying on a hunch when investing in short-term rentals is a risky game. Maybe you’ve got a "feeling’ about a particular neighborhood, or you"ve seen a few successful Airbnbs and think you can replicate that success. But the market is changing, and a lot can happen between now and 2026. Data, not intuition, is what separates profitable investments from costly mistakes.
We’re seeing increasing volatility in travel patterns, shifts in traveler preferences, and a growing patchwork of local regulations. What worked last year—or even last month—might not work next year. That’s where Airbnb revenue calculators come in. They’re evolving beyond simple estimates and are becoming sophisticated tools for informed decision-making.
The year 2026 isn’t just some arbitrary future date. We anticipate continued growth in the short-term rental market, but also increased scrutiny from local governments and potential economic headwinds. Anticipating these changes now is crucial. A good calculator doesn’t just tell you what is happening, it helps you model what could happen, allowing you to make smarter, more resilient investment choices. It’s about minimizing risk and maximizing your potential for profit.

STR-friendly. Gulf-front. Oversized lot. 🤑
— Carter Signature Properties (@CarterSignature) April 12, 2026
If you've been looking for a Texas Gulf Coast lot that actually makes sense as a short-term rental investment — this is it. 7910 Bluewater Hwy sits on the seaward side of Bluewater Hwy in Surfside Beach with direct beach access and room… pic.twitter.com/YcbIqViGta
Decoding the Metrics: What Data Powers an Airbnb Revenue Prediction?
An Airbnb revenue calculator isn’t magic; it’s math. But it’s math powered by a lot of data. The most important metric is occupancy rate – the percentage of nights your property is booked. A small change in occupancy can have a huge impact on your overall revenue. For example, increasing occupancy from 60% to 70% can easily boost your income by 16%.
Then there's Average Daily Rate (ADR), the average price you charge per night. This is heavily influenced by seasonality, demand, and your property’s amenities. Seasonality is huge – a beach house will command a premium during the summer months, while a ski chalet will be more profitable in the winter. Length of stay also matters, as longer stays often mean less turnover and lower cleaning costs.
But it's not just about your property. A robust calculator will also incorporate competitor data – what similar properties in the area are charging, their occupancy rates, and their amenities. This hyper-local data is vital. You need to know how you stack up against the competition. Understanding these interconnected metrics is key to making informed decisions.
- Occupancy Rate: Percentage of booked nights.
- Average Daily Rate (ADR): Average price per night.
- Seasonality: Fluctuations in demand based on time of year.
- Length of Stay: Duration of guest bookings.
- Competitor Data: Pricing and occupancy of similar properties.
Airbnb Revenue Calculator Data Source Comparison (2026)
| Data Source | Data Coverage | Data Freshness | Data Accuracy & Trustworthiness | Cost |
|---|---|---|---|---|
| AirDNA | Strong national coverage, particularly in established markets. Detailed local data available. | Regular updates, aiming for high recency. Frequency not precisely specified. | Generally considered a reliable source, widely used by investors. User reviews suggest good accuracy, but dependent on market. | Subscription-based; pricing varies based on the level of detail and market access. |
| Rabbu | Growing coverage, with a focus on key vacation destinations. Expanding into more regional areas. | Data is updated frequently, leveraging AI for real-time insights. | Relatively newer player; accuracy is improving with data volume. User feedback is still developing. | Offers a free tier with limited functionality; paid plans unlock more features and data. |
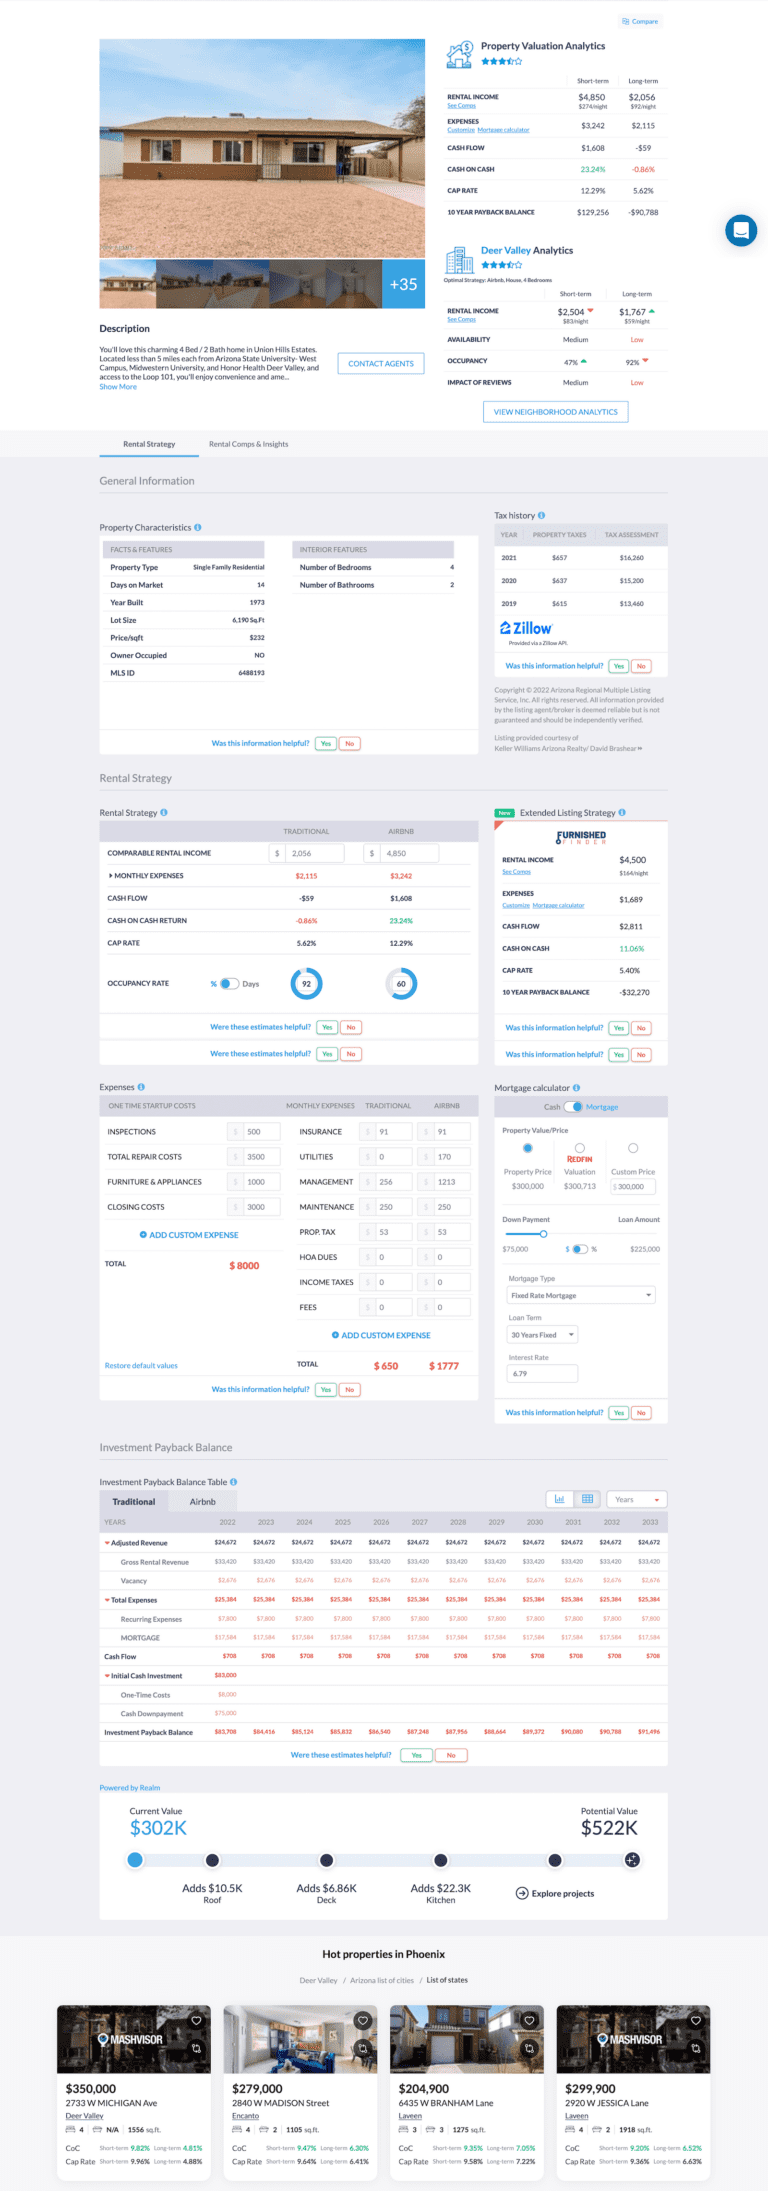
| Mashvisor | National coverage, with an emphasis on investment property analysis, including Airbnb potential. | Data updates are less frequent than AirDNA or Rabbu, focusing on broader trends. | Accuracy is tied to its real estate focus; Airbnb data is a component of a larger analysis. User reviews are mixed. | Subscription-based; plans depend on the number of properties analyzed and features used. |
| AllTheRooms | Broad national and international coverage, aggregating data from multiple platforms (Airbnb, VRBO, etc.). | Data freshness varies depending on the source platform. Aggregation can introduce some lag. | Accuracy relies on the quality of the underlying data sources. Potential for inconsistencies due to multiple sources. | Subscription-based; offers various tiers depending on data access and features 📈. |
| BNB Stats 💡 | Focus on detailed local market data, with expanding regional coverage. | Daily updates to core metrics like occupancy and average daily rate. | Built on a foundation of direct data collection and rigorous quality control. High trustworthiness among professional hosts. | Offers a range of plans, including free options for basic insights and paid subscriptions for advanced analytics. |
Illustrative comparison based on the article research brief. Verify current pricing, limits, and product details in the official docs before relying on it.
AirDNA vs. Rabbu: A Head-to-Head Comparison for 2026
When it comes to Airbnb revenue calculators, two names consistently rise to the top: AirDNA and Rabbu. Both offer valuable insights, but they approach the problem differently. AirDNA is generally considered the industry standard, known for its extensive data collection and robust analytics. They pull data from Airbnb and Vrbo, giving a wider view of the market. Their reports are often cited in industry publications, and they offer tools for both individual investors and property managers.
Rabbu, on the other hand, focuses on providing a more user-friendly experience. Their interface is cleaner and more intuitive, making it easier for beginners to get started. They also offer a free Airbnb calculator, which is a great way to get a quick estimate of potential revenue. Rabbu's data is primarily focused on Airbnb, so it might not be as comprehensive as AirDNA's.
Both tools allow you to input a property address and bedroom count to generate revenue projections. However, their algorithms for predicting 2026 revenue likely differ. AirDNA may lean more heavily on historical trends and market analysis, while Rabbu might prioritize real-time data and user feedback. The 'best' choice depends on your needs. If you want the most comprehensive data and are willing to pay for it, AirDNA is a solid bet. If you're just starting out and want a free, easy-to-use tool, Rabbu is a good option.
- AirDNA: Extensive data, robust analytics, industry standard, comprehensive reports.
- Rabbu: User-friendly interface, free calculator, focused on Airbnb data, intuitive experience.
Beyond the Calculator: Factors That Still Need Your Human Touch
Let’s be clear: an Airbnb revenue calculator is a powerful tool, but it's not a crystal ball. It can’t predict everything. Local events, like festivals or conferences, can dramatically increase demand and drive up prices. Changes in tourism trends – a sudden surge in interest in a particular destination – can also have a significant impact. These factors aren’t always captured in the data.
Economic downturns are another wild card. A recession could lead to a decrease in travel spending, impacting occupancy rates and ADR. New regulations – stricter zoning laws or increased taxes – could also affect your profitability. It's essential to stay informed about local regulations and be prepared to adapt.
And don’t underestimate the importance of property management and guest communication. Positive reviews are crucial for attracting bookings. A clean, well-maintained property, and prompt, helpful communication can make all the difference. A calculator can give you a number, but you provide the experience.
- Local events (festivals, conferences)
- Changes in tourism trends
- Economic downturns
- New regulations
- Property Management & Guest Experience
Scenario Planning: Using the Calculator to Test Your Investment Strategy
The real power of an Airbnb revenue calculator lies in its ability to model different scenarios. Let’s say you’re considering buying a property in a new market. You can use the calculator to estimate potential revenue based on different occupancy rates and ADRs. What if you renovate the property and add a hot tub? How would that impact your potential income?
This is where sensitivity analysis comes into play. What happens if occupancy drops by 10% due to increased competition? What if ADR increases by 5% due to a local event? By adjusting the variables within the calculator, you can see how these changes affect your potential revenue. This allows you to assess the risk and reward of different investment strategies.
For example, imagine you're looking at two properties: one in a stable market with predictable demand, and another in a rapidly growing market with higher potential, but also higher risk. The calculator can help you compare the potential returns of both properties under different scenarios, allowing you to make a more informed decision. Don't just look at the best-case scenario; consider the worst-case scenario as well.
Airbnb Stock Price Prediction 2026
Bull / Base / Bear scenario analysis
| Timeframe | Bull Case | Base Case | Bear Case | Key Driver |
|---|---|---|---|---|
| 1 Month | $148 | $140 | $128 | Q4 earnings momentum and travel demand recovery |
| 3 Months | $165 | $152 | $135 | Spring booking season and international travel normalization |
| 6 Months | $185 | $168 | $145 | Peak summer travel season and platform expansion results |
| 1 Year | $210 | $180 | $155 | Full-year revenue growth and market share expansion |
Price Prediction Summary
ABNB shows strong potential for 2026 driven by normalized travel patterns, platform innovations, and expanding global market presence. Base case suggests 33% upside over 12 months, though regulatory headwinds and economic uncertainty create downside risks.
Key Factors Affecting Airbnb Stock Stock Price
- Global travel demand recovery and normalization
- Platform expansion into new markets and property types
- Regulatory environment in key markets like NYC and EU
- Competition from traditional hotels and OTA platforms
Disclaimer: Predictions are speculative and not financial advice. Stock price predictions are based on current market analysis and may vary significantly due to market volatility, economic conditions, and other unpredictable factors. Always do your own research before making investment decisions.
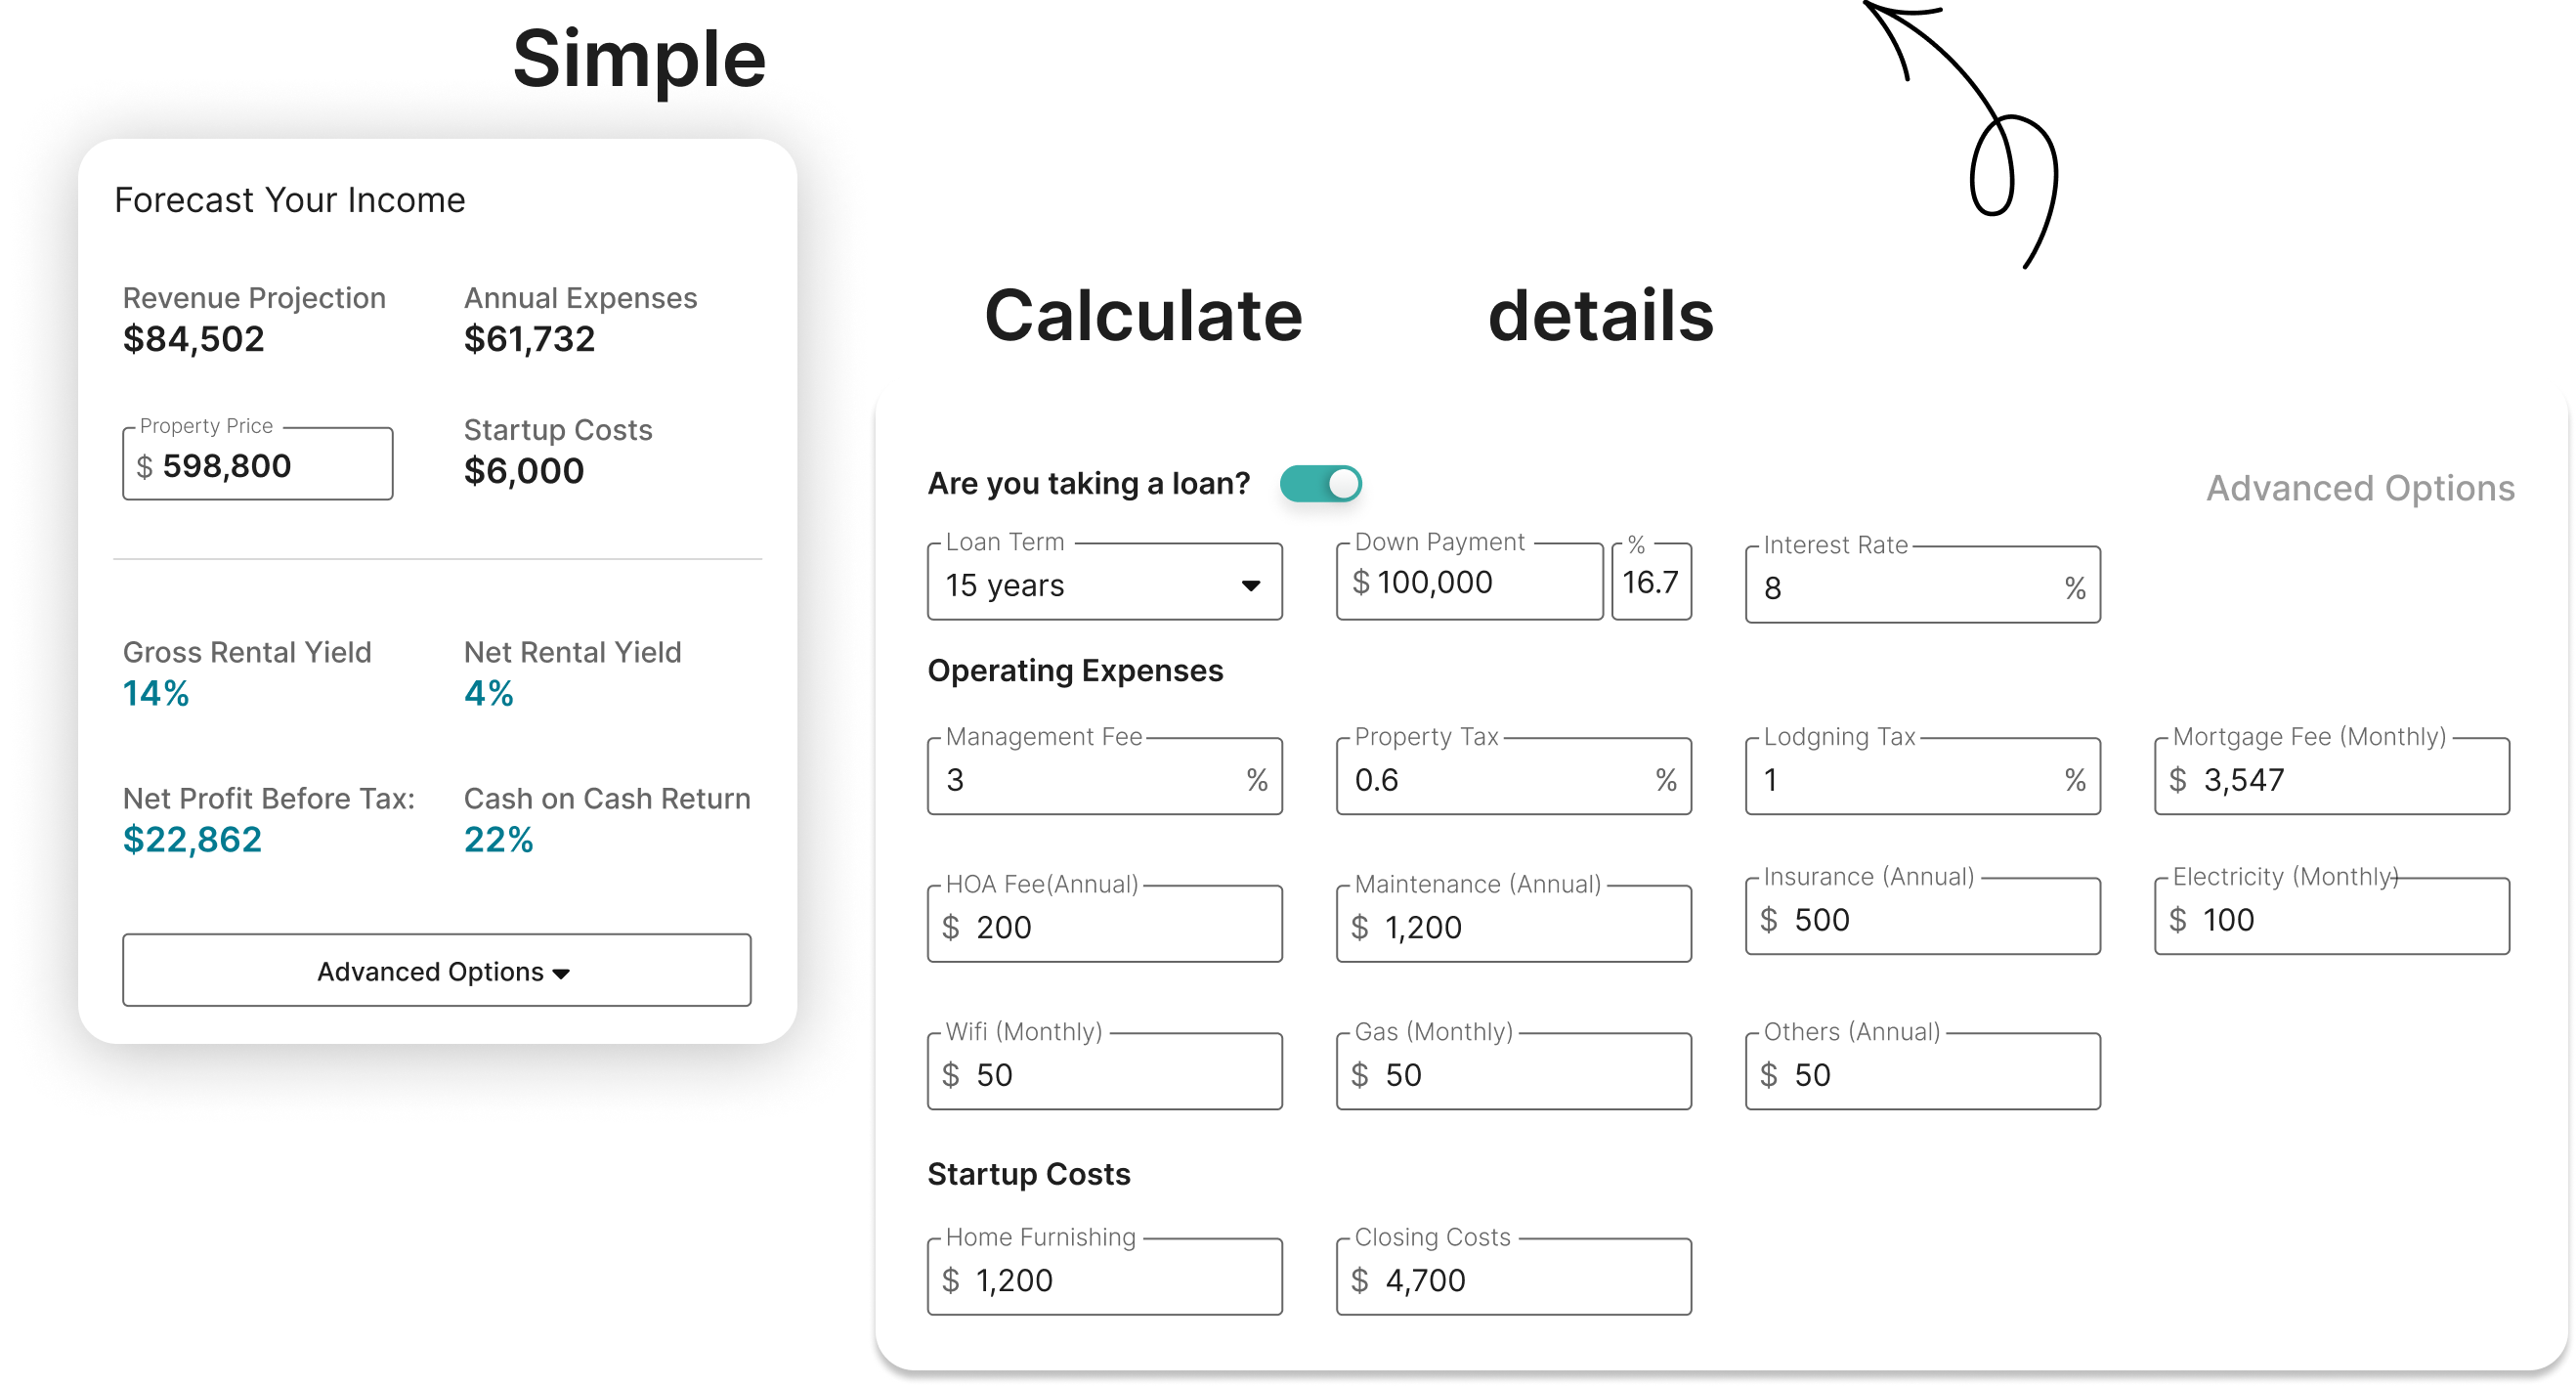
The ROI Equation: Calculating True Profitability Beyond Gross Revenue
Gross revenue is just the starting point. To truly understand your profitability, you need to calculate your return on investment (ROI). This means factoring in all of your expenses, not just the cost of the property. These expenses include mortgage payments, property taxes, insurance, property management fees, maintenance costs, cleaning fees, and even utilities.
An Airbnb revenue calculator will give you an estimate of your gross revenue, but you’ll need to use a separate ROI calculator or spreadsheet to factor in these expenses. There are many free ROI calculators available online. Be realistic with your expense estimates. It’s better to underestimate your revenue and overestimate your expenses than the other way around.
Remember, a high gross revenue doesn't necessarily translate to a high ROI. A property that generates $50,000 in revenue per year might not be as profitable as a property that generates $40,000 in revenue if the latter has significantly lower expenses. Focus on maximizing your net income, not just your gross revenue.
Navigating Regulatory Changes: What 2026 Might Hold for Short-Term Rentals
The regulatory landscape for short-term rentals is constantly evolving. Many cities and towns are implementing new rules and restrictions, such as limits on the number of nights a property can be rented, requirements for permits and licenses, and increased taxes. It’s crucial to stay informed about these changes in your target market.
In 2026, we could see even more stringent regulations, particularly in popular tourist destinations. Some cities might impose stricter zoning laws, limiting short-term rentals to certain areas. Others might increase taxes or require owners to obtain expensive permits. Staying ahead of these changes is essential for protecting your investment.
Resources like the American Short-Term Rental Association (ASTRA) and local government websites can provide valuable information. It's also a good idea to consult with a local real estate attorney who specializes in short-term rentals.
Future-Proofing Your Investment: Long-Term Strategies for Airbnb Success
Building a sustainable short-term rental business requires more than just a good location and a nice property. Diversification is key. Consider investing in multiple properties in different markets to reduce your risk. Building a strong brand is also important. Create a unique and memorable experience for your guests.
Providing excellent customer service is paramount. Respond promptly to inquiries, be helpful and accommodating, and go the extra mile to make your guests feel welcome. Adapting to changing market conditions is also crucial. Be prepared to adjust your pricing, amenities, and marketing strategies as needed.
The short-term rental market is dynamic and competitive. Continuous learning and staying ahead of the curve are essential for long-term success. Invest in your knowledge, stay informed about industry trends, and be willing to experiment with new strategies. This isn’t just about maximizing profits today; it’s about building a business that thrives for years to come.
No comments yet. Be the first to share your thoughts!