
Beyond Gut Feeling: Why Airbnb Revenue Calculators Matter in 2026
Relying on intuition when evaluating a short-term rental investment is, frankly, a dangerous game. What worked last year – or even last month – isn't a guarantee of future success. The market is shifting, and the factors influencing Airbnb revenue are becoming increasingly complex. We're seeing more professionalization, increased competition, and a greater demand for data-driven decision-making.
The pre-pandemic days of easy profits are largely over. Occupancy rates are normalizing, and travelers are more price-sensitive. This is especially true as economic uncertainty creeps in. Accurate revenue projections are no longer a 'nice-to-have' – they’re essential for making sound investment choices and avoiding costly mistakes.
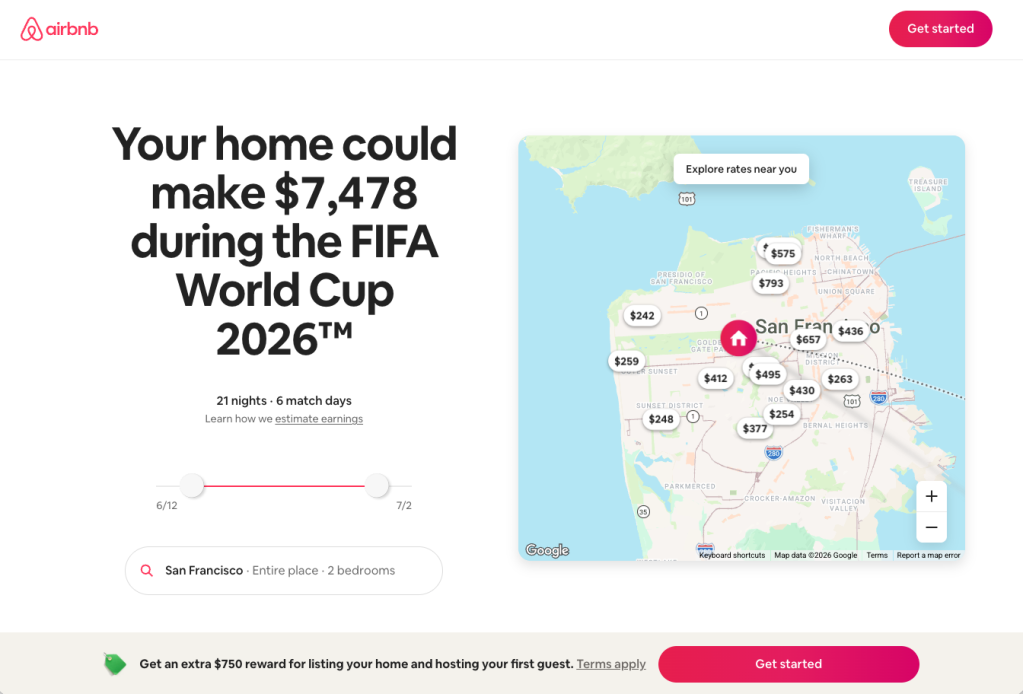
Dynamic pricing, where rates fluctuate based on demand, is now the norm. Algorithms constantly adjust prices based on real-time data, making it harder to predict income using traditional methods. A good Airbnb revenue calculator incorporates these dynamic pricing trends, offering a more realistic view of potential earnings. Planning for 2026 now means understanding these shifts and building them into your financial models.
Focusing on 2026 is necessary: long-term investment horizons. Buying now requires projections extending several years out, and the rate of change in the STR market means a simple extrapolation of current data is insufficient. We need tools that can account for evolving demand, potential regulatory changes, and the increasing sophistication of the competitive environment.
STR-friendly. Gulf-front. Oversized lot. 🤑
— Carter Signature Properties (@CarterSignature) April 12, 2026
If you've been looking for a Texas Gulf Coast lot that actually makes sense as a short-term rental investment — this is it. 7910 Bluewater Hwy sits on the seaward side of Bluewater Hwy in Surfside Beach with direct beach access and room… pic.twitter.com/YcbIqViGta
Decoding the Inputs: What Drives Airbnb Revenue Projections?
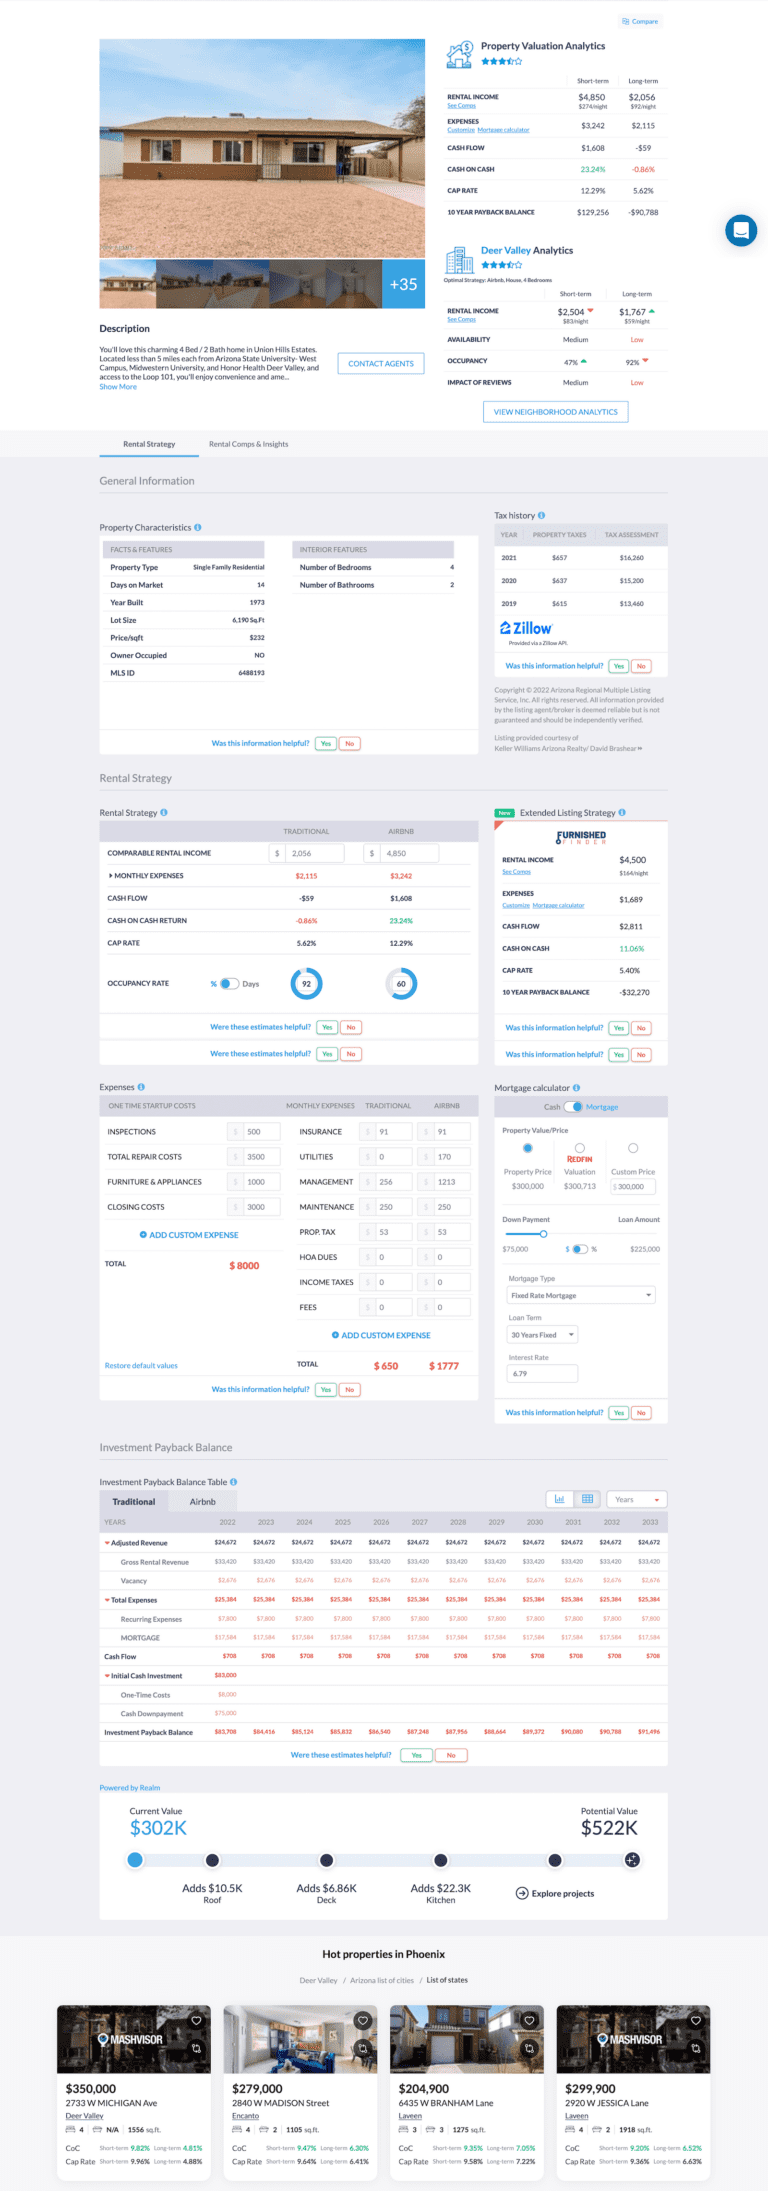
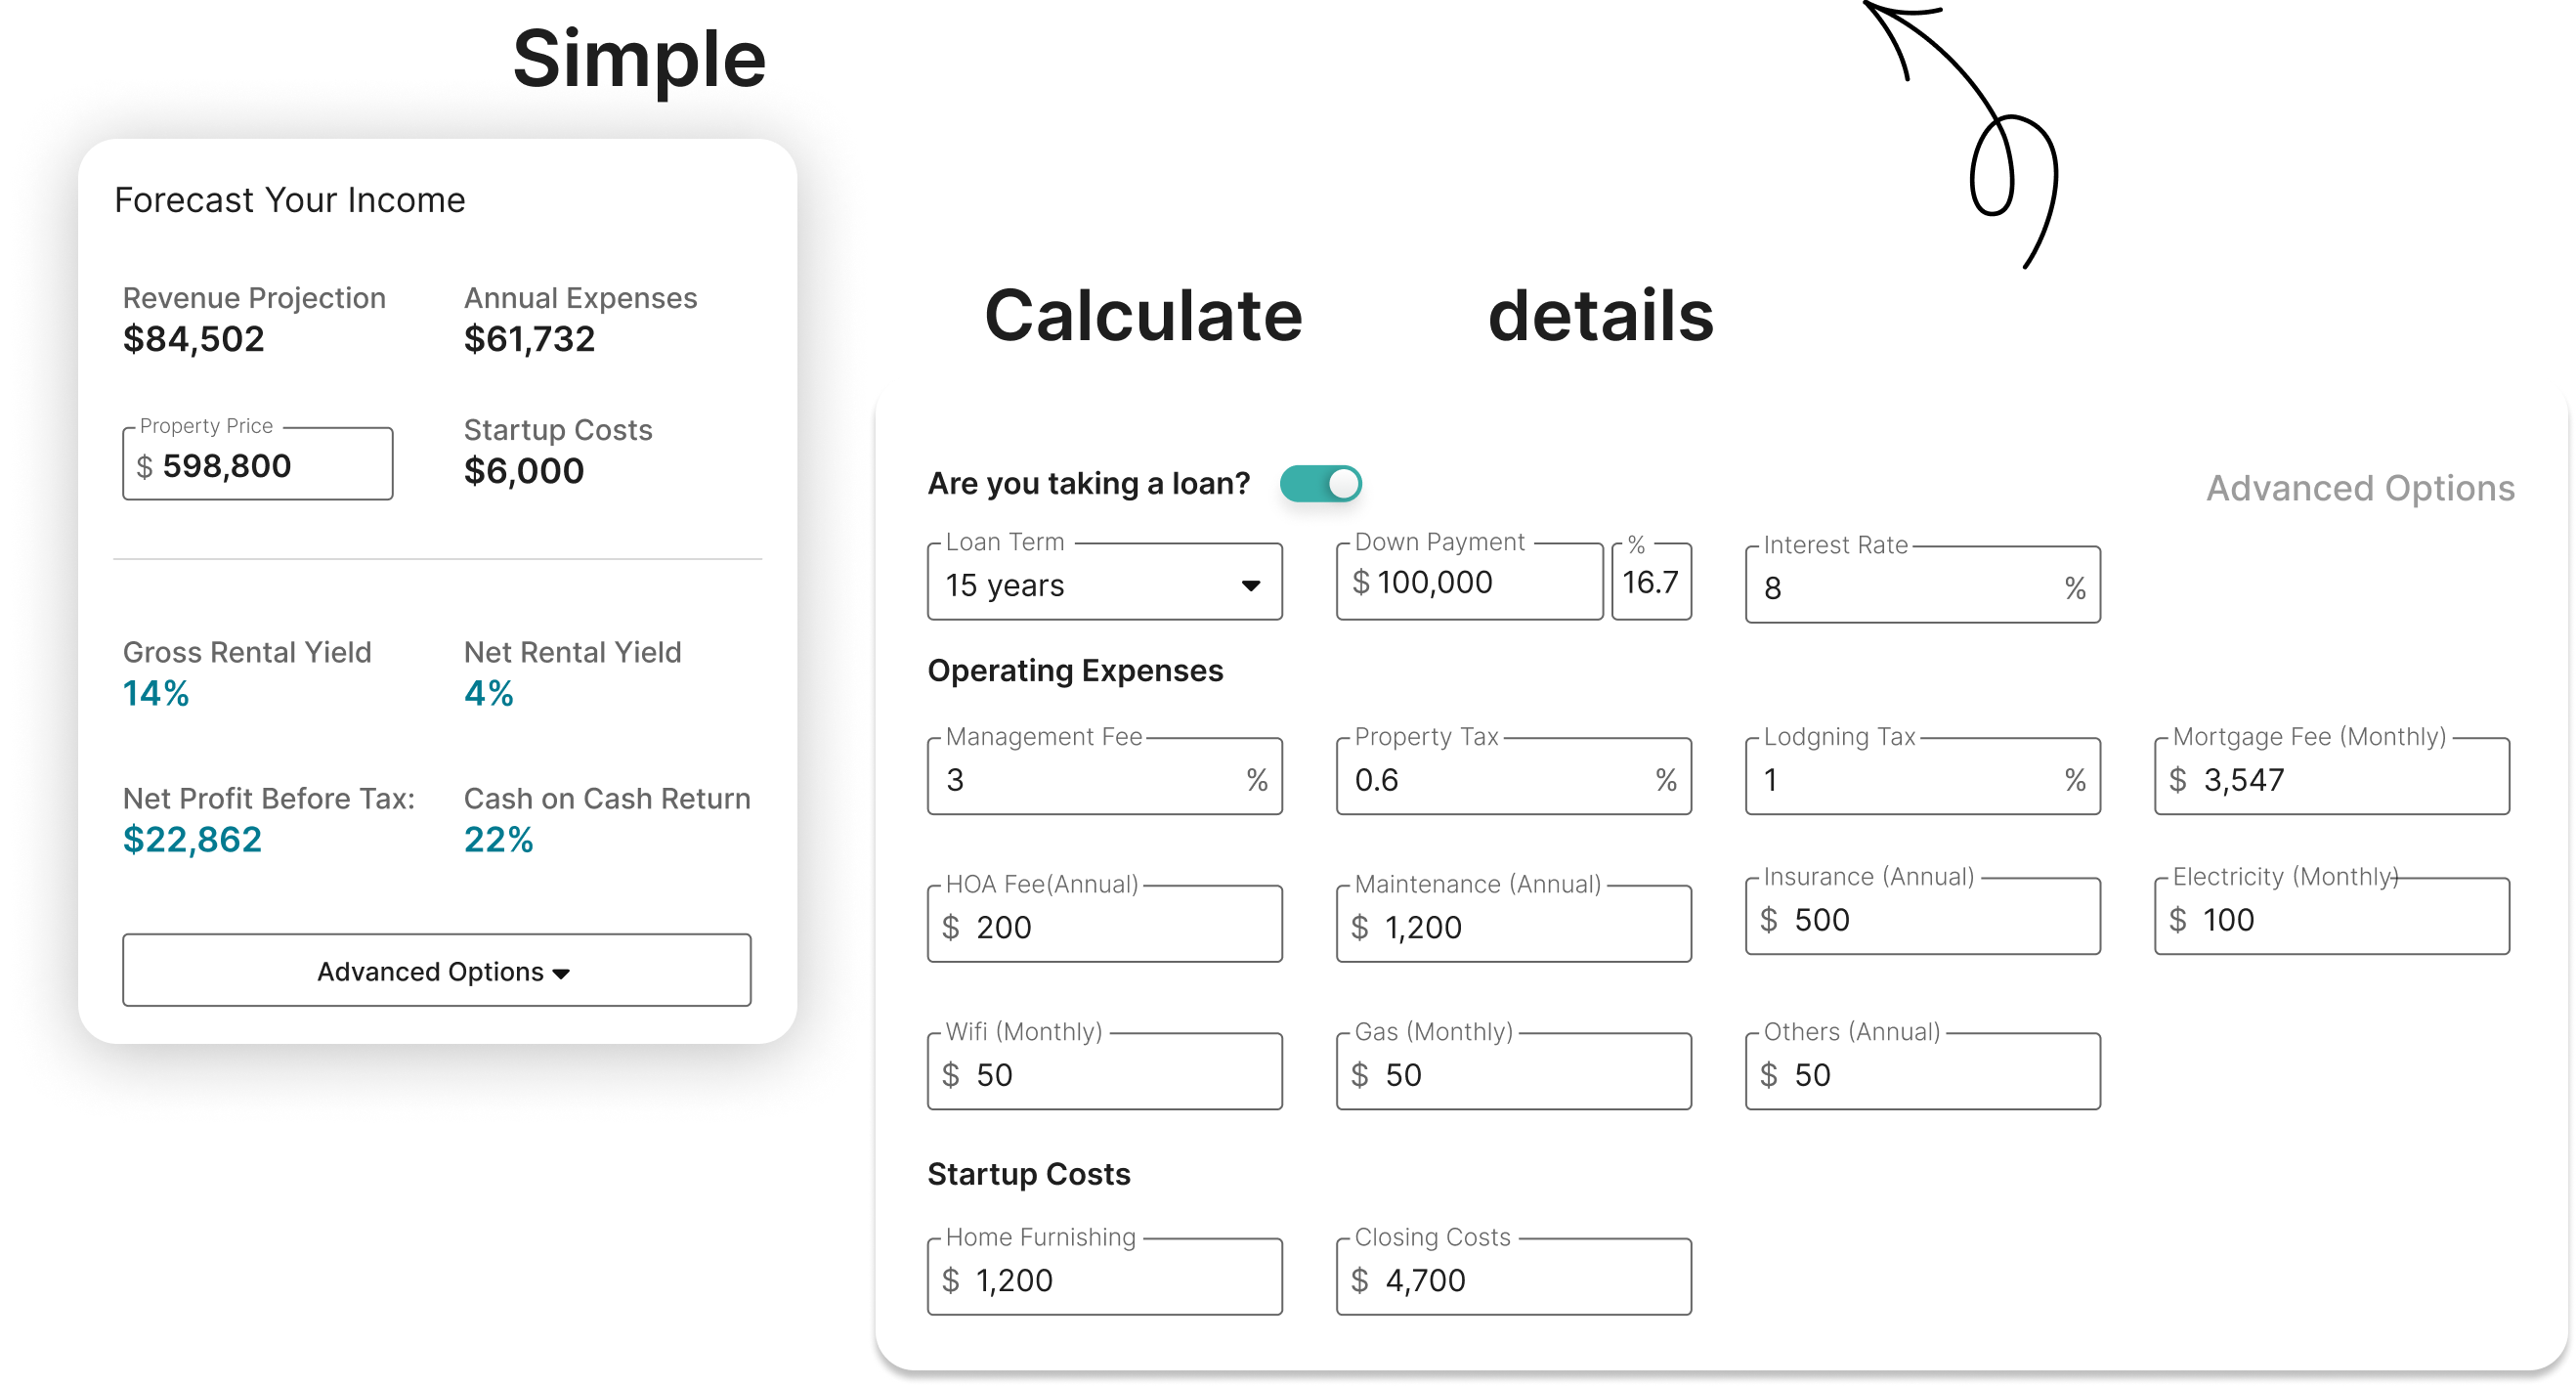
Airbnb revenue calculators aren’t magic boxes; they’re sophisticated tools that rely on a variety of inputs. You need to understand these inputs to get a useful output. The foundation starts with the property itself – its type, location, size, and amenities. A beachfront condo will naturally command a higher rate than a studio apartment in a suburban area.
Location is paramount, but it's not just about the city or even the neighborhood. Hyperlocal factors matter. Is the property within walking distance of major attractions? Is it easily accessible by public transportation? Is it in a quiet residential area or a bustling tourist zone? These details significantly impact demand and, consequently, revenue.
Beyond the property and location, key metrics like the number of bedrooms and bathrooms, and the availability of amenities such as a pool, high-speed wifi, and dedicated parking all play a significant role. These features directly affect the property’s appeal and its ability to attract guests. Don’t underestimate the power of a well-equipped kitchen or a comfortable outdoor space.
Crucially, occupancy rate, average daily rate (ADR), and seasonality are all interconnected. These are not static numbers. An accurate calculator will consider historical data, current market trends, and seasonal fluctuations to provide a realistic projection. But remember: these calculators are only as good as the data they receive. Garbage in, garbage out. A poorly inputted address, or inaccurate bedroom count, will skew results.
- Property Type: House, apartment, condo, cabin, etc.
- Location: Specific address and surrounding neighborhood
- Bedrooms/Bathrooms: Number and configuration
- Amenities: Pool, wifi, parking, kitchen, laundry, etc.
- Occupancy Rate: Percentage of nights booked
- Average Daily Rate (ADR): Average price per night
- Seasonality: Fluctuations in demand throughout the year
Pre-Calculator Data Checklist
- Exact Property Address - Crucial for accurate market comparison and local regulation checks. This impacts permitted rental days and potential revenue.
- High-Quality Property Photos - Professional photography significantly impacts click-through rates and booking potential. Consider interior *and* exterior shots.
- Detailed Amenity List - Be specific! Include everything from Wi-Fi speed (measured in Mbps) to kitchen appliances and parking availability. A comprehensive list attracts more guests.
- Local Short-Term Rental Regulations - Research city/county ordinances regarding permits, licenses, and occupancy limits. Non-compliance can result in fines.
- Homeowners Association (HOA) Rules - If applicable, understand any restrictions on short-term rentals, including minimum stay requirements or outright bans.
- Comparable Rental Data - Research similar properties in your area on platforms like AirDNA or Mashvisor to understand average daily rates and occupancy.
- Cleaning & Maintenance Costs - Accurate estimates of these ongoing expenses are essential for calculating net profit. Factor in professional cleaning services or your time if self-managed.
- Utility Costs - Include estimates for electricity, water, gas, internet, and any other utilities the guest will consume. Consider seasonal variations.
AirDNA vs. Rabbu: A Head-to-Head Comparison of Leading Calculators
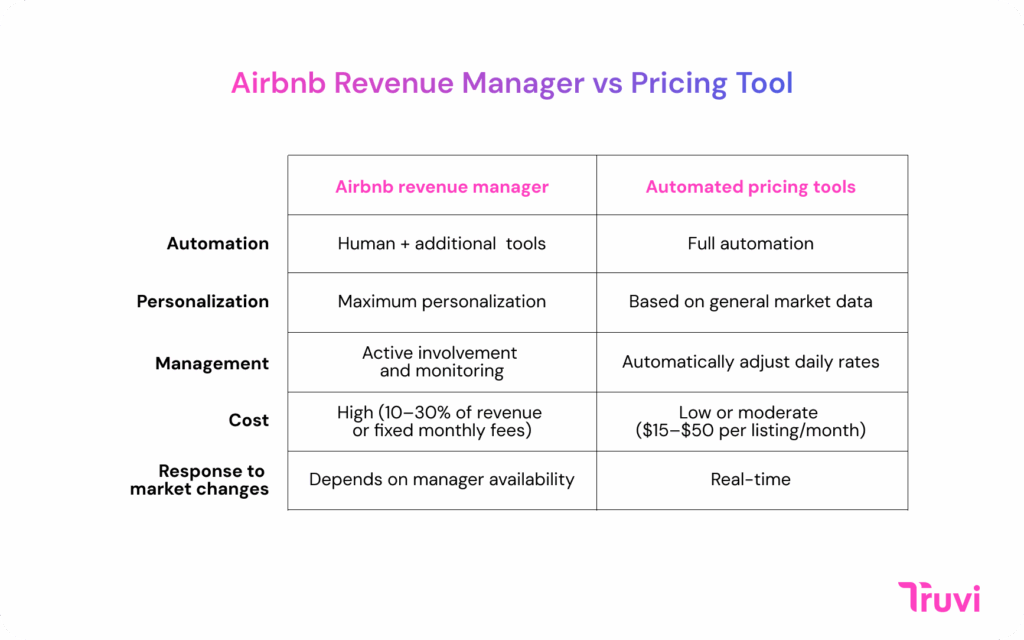
When it comes to Airbnb revenue calculators, AirDNA and Rabbu are two of the most prominent players. Both offer tools to estimate potential earnings, but they differ in their approach and the data they provide. AirDNA has been around longer and is generally considered the industry standard for comprehensive data analysis, while Rabbu is newer and focuses on providing a more user-friendly experience.
AirDNA’s strength lies in its extensive data collection and detailed reporting. They aggregate data from millions of Airbnb listings worldwide, providing insights into occupancy rates, ADR, and revenue trends. Their reports can be incredibly granular, allowing you to analyze performance at the neighborhood level. This comes at a cost, however, as AirDNA’s services are typically more expensive than Rabbu’s.
Rabbu, on the other hand, positions itself as a more accessible option, particularly for beginners. Their calculator is easy to use and provides a quick estimate of potential earnings. They also offer data on top-performing Airbnb markets and competitor analysis. Rabbu’s data coverage is expanding, but it’s not yet as comprehensive as AirDNA’s, especially in smaller or less popular markets.
I wouldn’t declare a clear winner here. AirDNA is the better choice for serious investors who need detailed data and in-depth analysis. Rabbu is a good option for those who are just starting out or who need a quick and easy estimate. Both provide historical data, but the granularity varies. AirDNA often offers more forward-looking projections, but these should always be taken with a grain of salt.
Airbnb Data Platform Comparison: AirDNA vs. Rabbu
| Feature | AirDNA | Rabbu |
|---|---|---|
| Data Accuracy | High | Medium |
| Geographic Coverage | High | Medium |
| Ease of Use | Medium | High |
| Reporting Features | High | Medium |
| Pricing | Not Available | Not Available |
| Customer Support | Medium | Low |
Illustrative comparison based on the article research brief. Verify current pricing, limits, and product details in the official docs before relying on it.
Beyond the Calculator: Refining Projections with Local Market Research
An Airbnb revenue calculator is a great starting point, but it shouldn’t be the only source of information. These tools rely on historical data and algorithms, but they can’t account for all the nuances of a local market. Independent research is essential for refining your projections and making informed decisions.
Start by analyzing local events and tourism trends. Are there any major festivals, conferences, or sporting events scheduled for the area? These events can significantly boost demand and drive up prices. Check local tourism board websites and social media channels for information about upcoming events. Also, pay attention to seasonal trends – demand for beach rentals will peak in the summer, while ski resorts will be busiest in the winter.
Don’t forget to analyze your competition. What are other Airbnb hosts in the area charging? What amenities do they offer? What are their occupancy rates like? Look at their listing descriptions and photos to see how they position their properties. This can give you valuable insights into what guests are looking for.
I believe a lot of investors skip this crucial step, and it’s a mistake. Consider the impact of new construction or zoning changes. Is there a new hotel being built nearby? Are there any regulations that could affect short-term rentals? These factors can significantly impact your property’s potential earnings. Regularly monitor local news and government websites for updates.
Content is being updated. Check back soon.
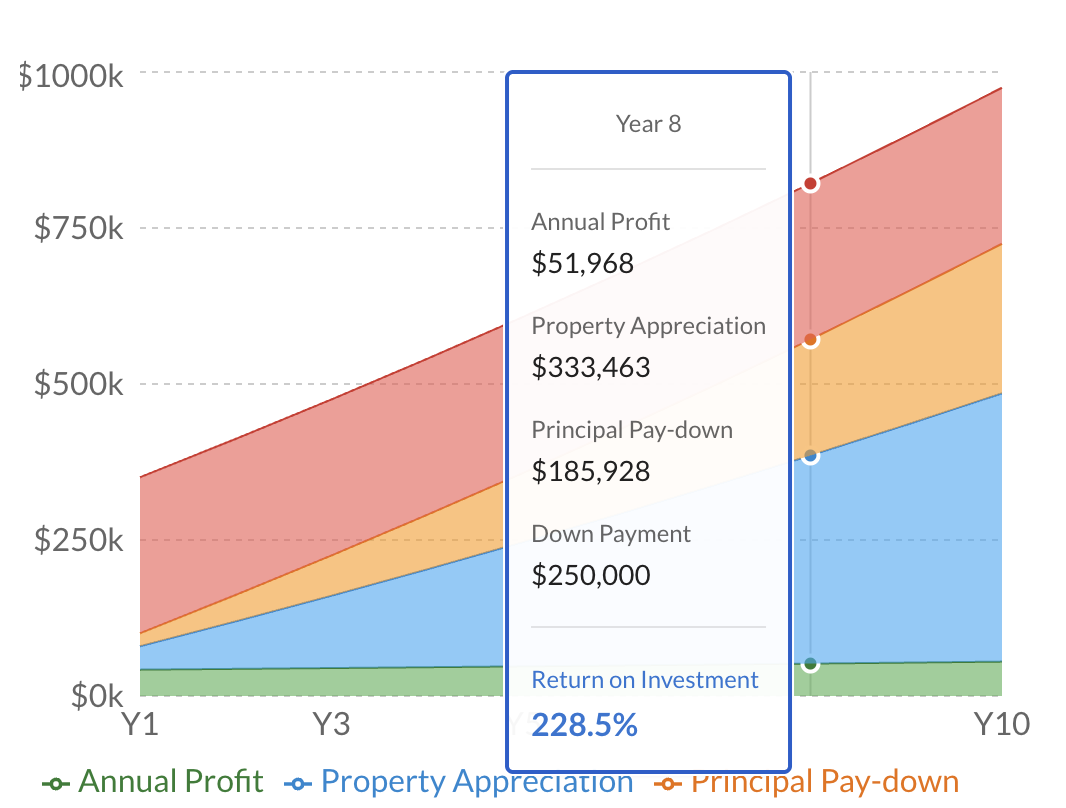
Calculating ROI: From Gross Revenue to Net Profit
Calculating gross revenue is only the first step. To truly assess the profitability of an Airbnb investment, you need to calculate your net operating income (NOI). This means subtracting all operating expenses from your gross revenue. These expenses include mortgage payments, property taxes, insurance, utilities, cleaning fees, property management fees, and maintenance costs.
Don't underestimate the importance of accurately accounting for all expenses. Many investors focus solely on revenue and neglect the costs of ownership. This can lead to a distorted view of profitability. Be realistic about maintenance costs – things will break, and repairs will be needed. Factor in a contingency fund for unexpected expenses.
Once you’ve calculated your NOI, you can determine your capitalization rate (cap rate) and cash-on-cash return. The cap rate is calculated by dividing your NOI by the property’s purchase price. The cash-on-cash return is calculated by dividing your annual cash flow (NOI minus debt service) by the amount of cash you invested.
Remember to account for vacancy rates. No property stays occupied 365 days a year. I usually factor in a 10-15% vacancy buffer to keep the math honest.d 100% of the time. A realistic vacancy rate will depend on the location and seasonality of your property. I’ve seen too many investors focus only on revenue and ignore the costs, leading to unpleasant surprises down the road. A conservative approach to expense estimation is always advisable.
The 2026 Outlook: Emerging Trends and Potential Disruptions
Looking ahead to 2026, several trends and potential disruptions could impact the Airbnb market. Regulatory changes are a major concern. Many cities and states are implementing stricter rules on short-term rentals, including licensing requirements, occupancy limits, and zoning restrictions. These regulations could significantly reduce the supply of available properties and increase operating costs.
The rise of new technologies will also play a role. Smart home automation, such as smart locks and thermostats, will become increasingly common, enhancing the guest experience and streamlining property management. Dynamic pricing algorithms will become even more sophisticated, allowing hosts to optimize their rates in real-time. This will put pressure on hosts to stay competitive and adapt to changing market conditions.
We’re also seeing the emergence of alternative accommodation options, such as extended stay hotels and corporate housing. These options cater to travelers who are looking for longer-term stays and may be willing to pay a premium for convenience and amenities. Airbnb will need to continue innovating to maintain its competitive edge.
I’m not a fortune teller, but it’s reasonable to expect increased scrutiny of the short-term rental market. Investors should be aware of the risks and opportunities that lie ahead. Diversification – owning properties in multiple locations – can help mitigate risk. Staying informed about local regulations and market trends is crucial for long-term success.
Scenario Planning: Stress-Testing Your Airbnb Investment
Don’t rely on a single revenue projection. Create multiple scenarios – best case, worst case, and most likely case – by adjusting key variables such as occupancy rate and average daily rate (ADR). This will give you a more realistic understanding of the potential risks and rewards of your investment.
For example, what happens if occupancy rates fall by 20% due to increased competition? Or if ADR declines by 10% due to economic downturn? How would these changes affect your cash flow and ROI? Stress-testing your investment will help you identify potential vulnerabilities and develop a contingency plan.
A contingency plan should outline the steps you’ll take to mitigate risk in the event of unexpected events. This could include reducing expenses, adjusting your pricing strategy, or temporarily suspending operations. Having a plan in place will give you peace of mind and help you weather any storm.
I think this is often overlooked, but it’s critical for long-term success. Consider scenarios like a natural disaster, a sudden economic downturn, or a change in local regulations. Preparing for the worst doesn’t mean expecting it to happen, but it does mean being proactive and protecting your investment.
No comments yet. Be the first to share your thoughts!