
Enter property details and location
To get a reliable baseline for your Airbnb revenue calculator, you must start with precise property data. Vague inputs like "urban area" yield wider confidence intervals than specific zip codes or neighborhood clusters. The accuracy of your ROI projection depends entirely on the granularity of the information you provide.
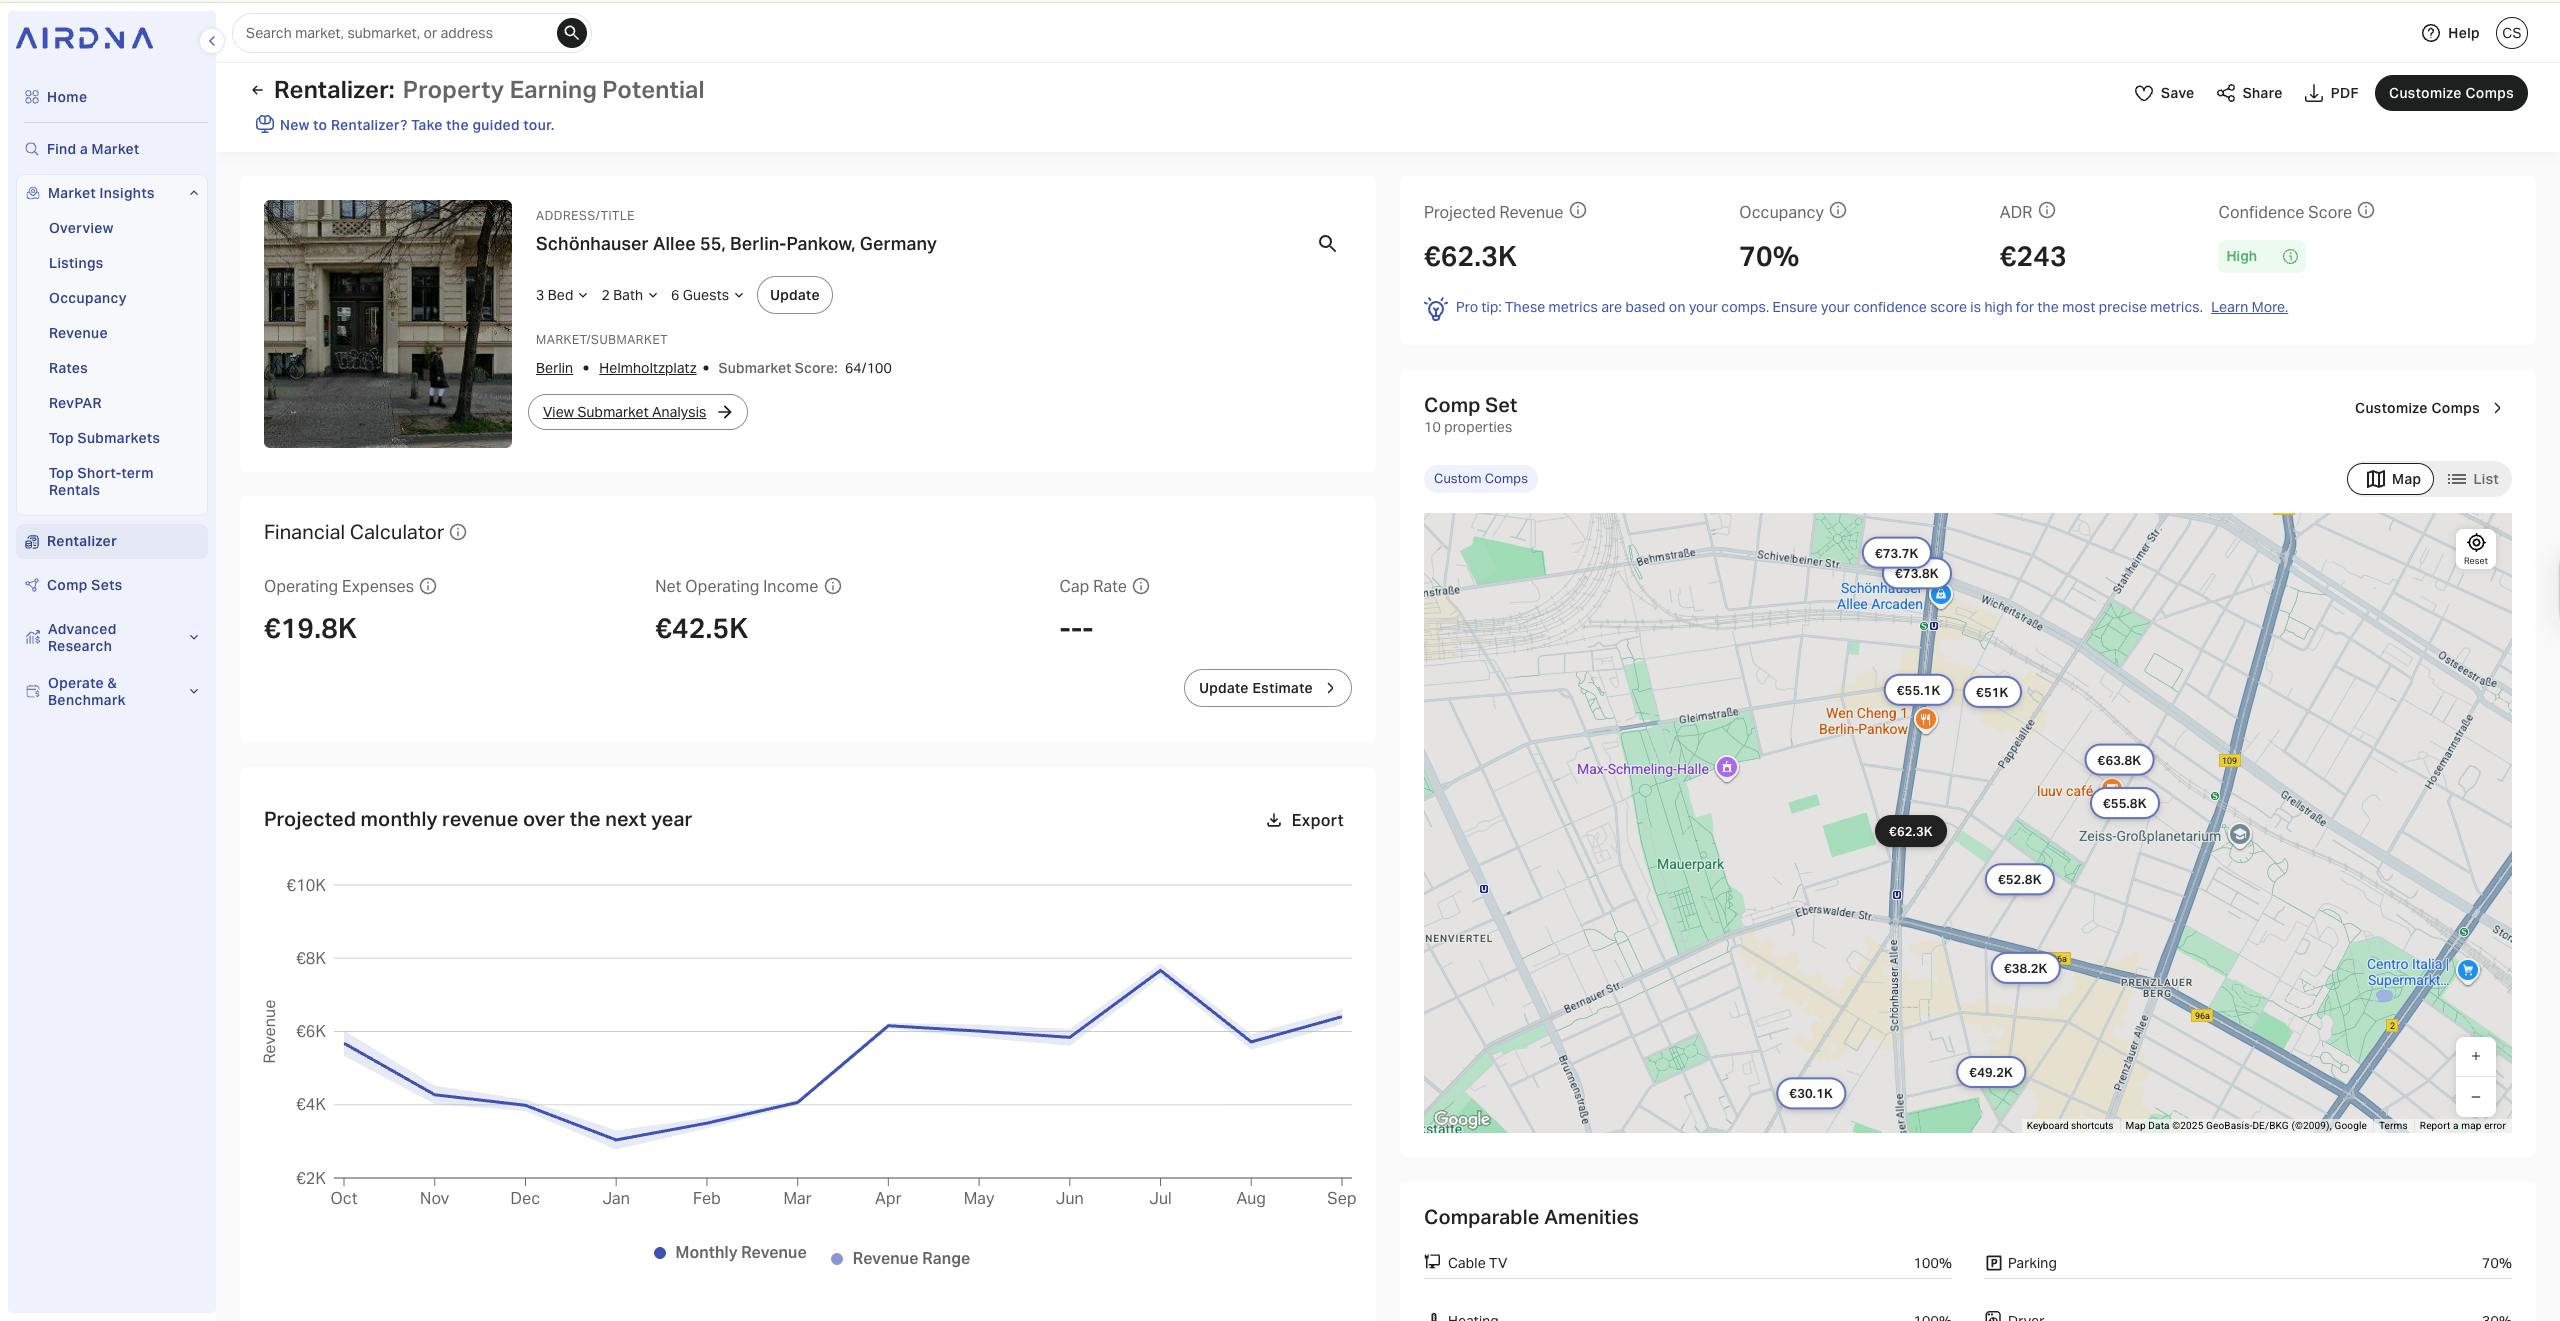
Most calculators, such as the AirDNA Rentalizer, use geolocation to pull comparable short-term rental (STR) data. Enter the full street address to ensure the tool identifies the correct neighborhood dynamics, local regulations, and tourism demand patterns. This step anchors your projections in real market data rather than generic city-wide averages.
Select the specific property type (e.g., entire home, private room) and input the exact number of bedrooms and bathrooms. These variables directly influence your Average Daily Rate (ADR) and occupancy potential. A three-bedroom house will command a different nightly rate and occupancy profile than a one-bedroom studio in the same zip code.
If the calculator allows manual overrides, input your target nightly rate based on recent comps in the area. For occupancy, start with the tool’s default estimate but adjust if you have specific knowledge of seasonal fluctuations or local events. This step helps you model different pricing strategies against the baseline data.
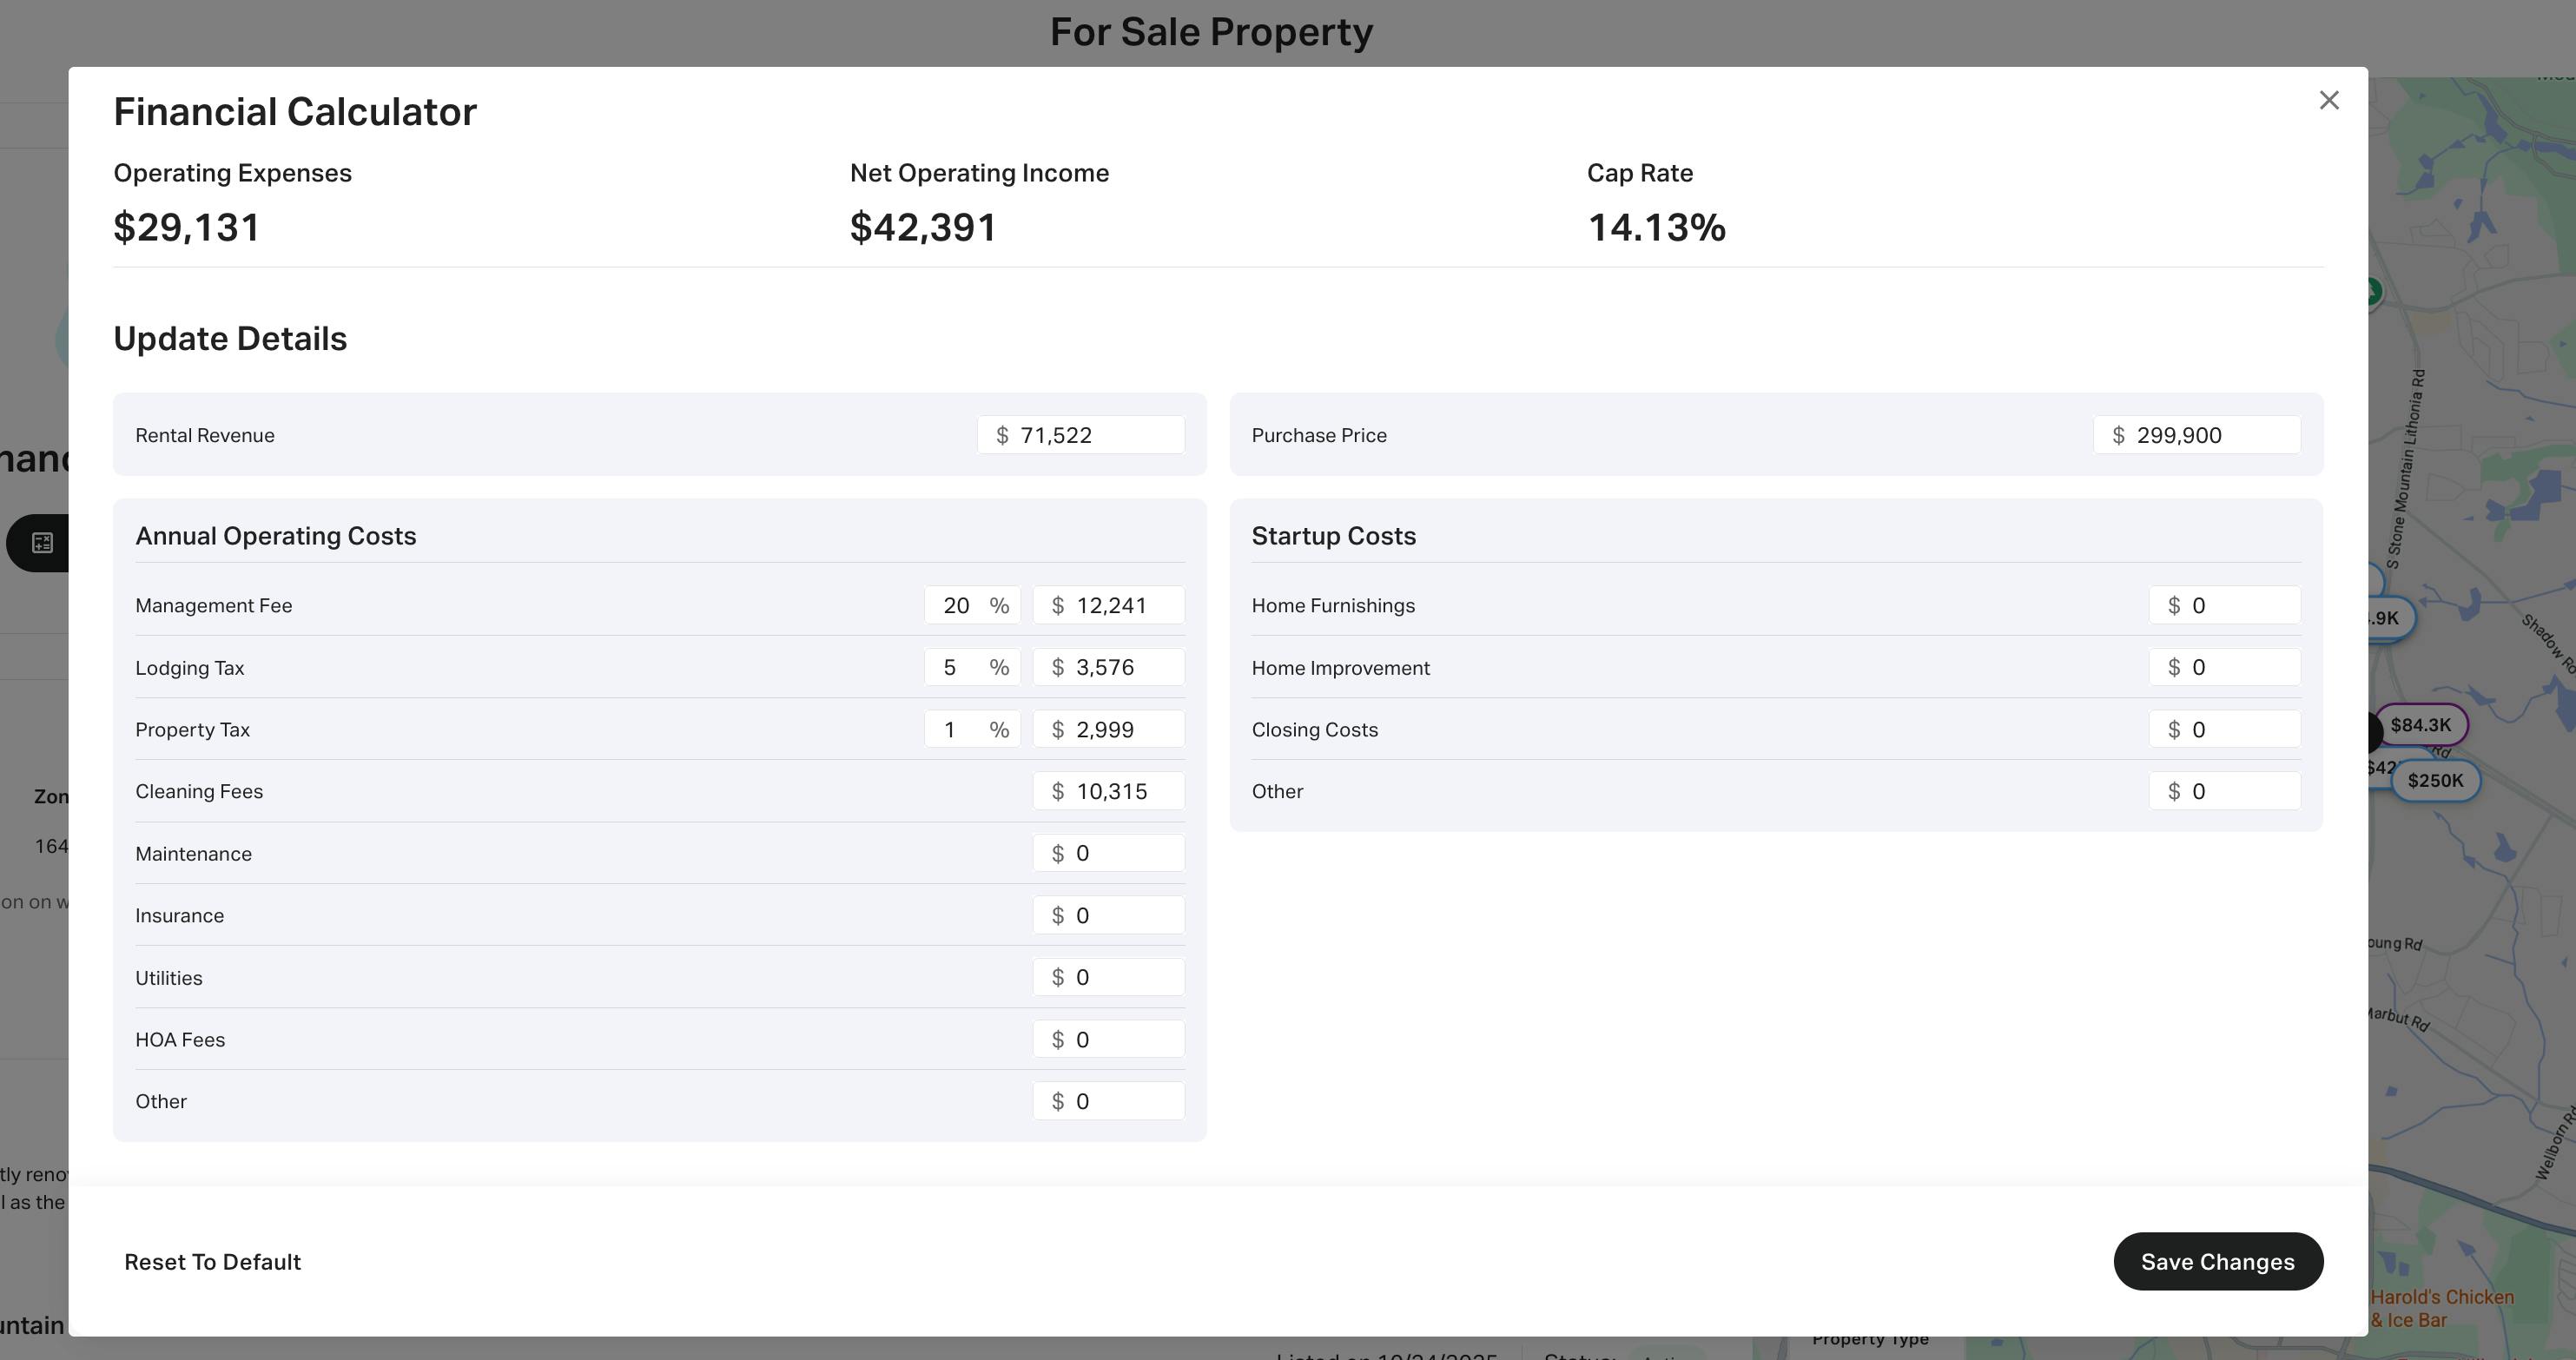
Input your specific costs, including cleaning fees, property management percentages, utilities, and maintenance budgets. Most tools will auto-populate some of these based on industry averages, but customizing them ensures your net operating income (NOI) reflects your actual business model. Accuracy here is critical for calculating true cash flow.
By following this sequence, you establish a data-driven foundation for your financial analysis. The resulting projections from tools like AirDNA or AirROI will be significantly more actionable when based on specific, verified property details rather than broad estimates.
Adjust occupancy and daily rate assumptions
Default market averages provide a baseline, but they rarely reflect the specific dynamics of your property. To achieve accurate ROI projections, you must replace generic industry data with property-specific inputs for occupancy and Average Daily Rate (ADR). This adjustment process transforms a generic estimate into a reliable financial forecast.
Follow the steps below to refine your calculator inputs using verified local data.
Start by replacing the default occupancy percentage with data from a primary source like AirDNA or BNB Calc. These platforms provide historical occupancy rates for your specific zip code or neighborhood. Enter your property’s actual booking history if available; otherwise, use the local market average adjusted for seasonality. Avoid using national averages, which often skew results for high-performing or seasonal markets.

Research your competitors’ nightly rates on Airbnb and Vrbo. Calculate the average of similar listings (same bedroom count, amenities, and location) to establish a realistic ADR. Input this figure directly into the calculator instead of relying on the tool’s suggested default. This ensures your revenue projection reflects actual pricing power in your immediate market.
Compare your adjusted inputs against the default market data to see the variance in projected revenue. This side-by-side view highlights how specific assumptions impact your bottom line. Use the table below to structure your analysis before finalizing your ROI calculation.
| Metric | Default Market Avg. | Your Adjusted Input | Revenue Impact |
|---|---|---|---|
| Occupancy Rate | 55% | 62% | +12.7% |
| Average Daily Rate (ADR) | $145 | $165 | +13.8% |
| Annual Gross Revenue | $29,078 | $33,327 | +$4,249 |
Using precise, locally sourced data for occupancy and ADR is the most critical step in refining your Airbnb revenue calculator. This method removes the guesswork from your financial planning and provides a clear, accurate picture of your property’s potential.
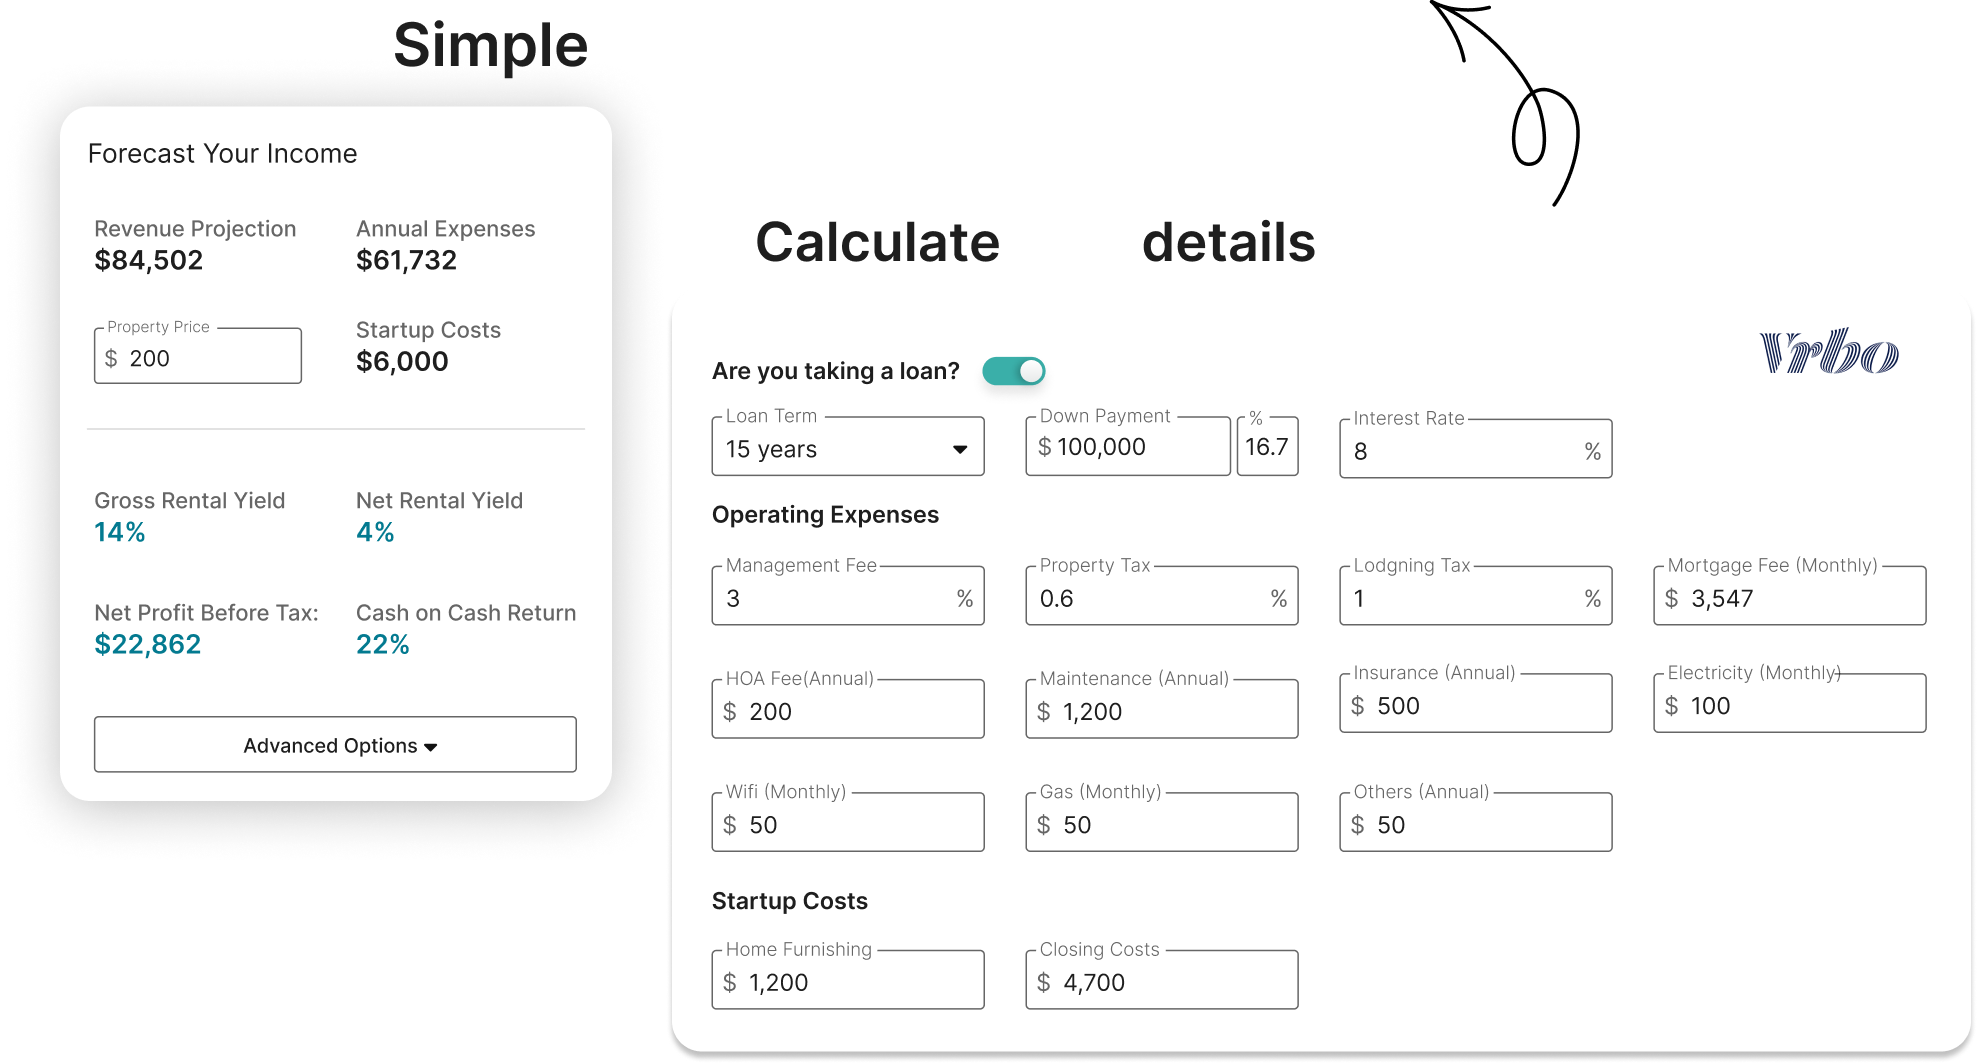
Input operating expenses and financing costs
Moving from gross revenue to net operating income requires precise data entry. An Airbnb revenue calculator is only as accurate as the expenses you feed it. You must separate fixed costs that remain constant from variable costs that fluctuate with occupancy. This distinction determines your true cash flow.
Fixed costs are paid regardless of whether the property is booked. In your calculator, input annual figures for property taxes, insurance premiums, HOA fees, and property management salaries. These are non-negotiable overheads that reduce your net operating income (NOI) directly.
Variable costs scale with rental activity. Enter estimated percentages or dollar amounts for utilities, cleaning fees, maintenance reserves, and supplies. Most short-term rental operators budget 10–20% of gross revenue for these items. Accurate tracking prevents underestimating the cost of turnover.
If you financed the purchase, your calculator must account for debt service. Enter the mortgage interest rate, loan term, and monthly payment. This separates your operating performance from your capital structure, allowing you to calculate cash flow after debt service.
Once these inputs are complete, the calculator subtracts total expenses from gross revenue to yield your Net Operating Income (NOI). Subtracting debt service from NOI gives you your pre-tax cash flow. This final number is the true measure of your investment’s profitability.
Calculate key investment metrics
The Airbnb revenue calculator converts raw data into actionable financial indicators. Instead of relying on intuition, you use the tool’s output to stress-test your purchase against established industry standards. This section explains how to interpret the three primary metrics that determine if a property is a viable investment: Cap Rate, Cash-on-Cash Return, and Debt Service Coverage Ratio (DSCR).
Capitalization Rate (Cap Rate)
The Cap Rate measures the property’s net operating income (NOI) relative to its current market value or purchase price, excluding financing costs. It provides a snapshot of the asset’s unleveraged yield. In the Airbnb revenue calculator, this figure is derived by subtracting operating expenses from gross revenue and dividing by the property’s total cost.
A higher Cap Rate generally indicates a higher potential return, though it may also signal higher risk or lower growth potential. For short-term rentals, a Cap Rate above 6-8% is often considered attractive in stable markets, but this varies significantly by location. Use this metric to compare properties of different sizes and price points on a level playing field.
Cash-on-Cash Return
While Cap Rate looks at the whole asset, Cash-on-Cash Return focuses on the actual cash you invested. It calculates the annual pre-tax cash flow against the total cash outlay, including your down payment, closing costs, and initial furnishing or renovation expenses. This is the most direct measure of your investment’s efficiency.
The calculator estimates this by taking your monthly net cash flow (after mortgage payments and all operating expenses) and annualizing it. A strong Cash-on-Cash Return typically ranges from 8% to 12% for successful short-term rental properties. This metric helps you understand how quickly your invested capital is generating income, which is critical for evaluating liquidity and reinvestment potential.
Debt Service Coverage Ratio (DSCR)
The DSCR determines your ability to cover mortgage payments with rental income. It is calculated by dividing the Net Operating Income by the total annual debt service. Lenders use this metric to assess risk, often requiring a minimum DSCR of 1.25 to approve a loan for a short-term rental.
A DSCR greater than 1.0 means the property generates enough income to pay its debts. A ratio of 1.25 or higher provides a safety buffer against vacancy spikes or expense increases. If the calculator shows a DSCR below 1.0, the property is likely cash-flow negative, indicating a high risk of financial strain. Always verify these projections against local lender requirements, as some may demand higher ratios for STRs compared to traditional long-term rentals.
By cross-referencing these three metrics, you can move beyond simple revenue estimates to a comprehensive view of financial health. A property might show high revenue but low Cash-on-Cash Return due to heavy debt; another might have a strong Cap Rate but fail the DSCR test. The calculator helps you identify these trade-offs before you commit capital.
Validate results with local market data
A calculator provides a baseline, but local market dynamics determine actual returns. Cross-reference your projected occupancy and average daily rate (ADR) against verified neighborhood data to avoid over-optimistic projections. Use official sources or primary market reports to ground your estimates in reality.
Start by checking Airbnb’s interactive earnings tool, which factors in prior booking data for your specific geography and listing type. This provides a quick reality check against the calculator’s assumptions. Next, analyze competitor listings in your immediate vicinity. Look for consistent booking patterns rather than sporadic high-rate spikes.
Calculator models are estimates. Always verify projected occupancy against actual booking trends in the specific neighborhood.
Finally, consult local tourism board statistics or short-term rental regulatory filings if available. These official sources often contain more accurate vacancy and demand data than generic calculators. Adjust your ROI model based on this granular evidence to ensure financial accuracy.
Frequently asked questions about STR calculators
How accurate are Airbnb revenue calculator projections?
Automated tools like AirDNA and AirROI generate estimates based on historical comparable listings rather than real-time bookings. While these platforms analyze millions of data points to project revenue, occupancy, and average daily rate (ADR), they cannot account for local events, sudden market shifts, or property-specific management quality. Treat these figures as directional benchmarks rather than guaranteed income.
Can I use a free calculator for investment decisions?
Free versions of tools like AirDNA’s Rentalizer or AirROI provide sufficient data for initial feasibility checks. They typically analyze 50 comparable properties to estimate Cap Rate and DSCR. For high-stakes acquisitions, verify these projections against local tax records and actual utility costs, as free tiers often exclude granular expense data required for precise ROI modeling.
Do these calculators account for local regulations?
Most standard revenue calculators focus on financial metrics and do not integrate local short-term rental ordinances. Zoning laws, permit fees, and occupancy taxes vary by municipality and directly impact net operating income. You must manually subtract these regulatory costs from the calculator’s gross revenue output to determine true profitability.
No comments yet. Be the first to share your thoughts!