
Enter the property address
Selecting the right revenue calculator is the first step in validating an investment. AirDNA, BNBCalc, and PriceLabs are the industry standards for short-term rental data. Each tool pulls from different comp sets, so your choice determines the baseline for your ROI model.
AirDNA offers the most extensive global comp data, while BNBCalc is widely used for U.S.-specific cash flow analysis. PriceLabs integrates revenue estimates directly with dynamic pricing tools. Pick one to anchor your research.

Enter the full street address of the property in the calculator’s search field. The tool will geocode the location and pull comparable rental data for that specific neighborhood or zip code.
Ensure the tool has identified the correct property. If the address is ambiguous, refine the search by selecting the specific city or neighborhood from the dropdown. Accurate location data is critical for reliable revenue estimates.
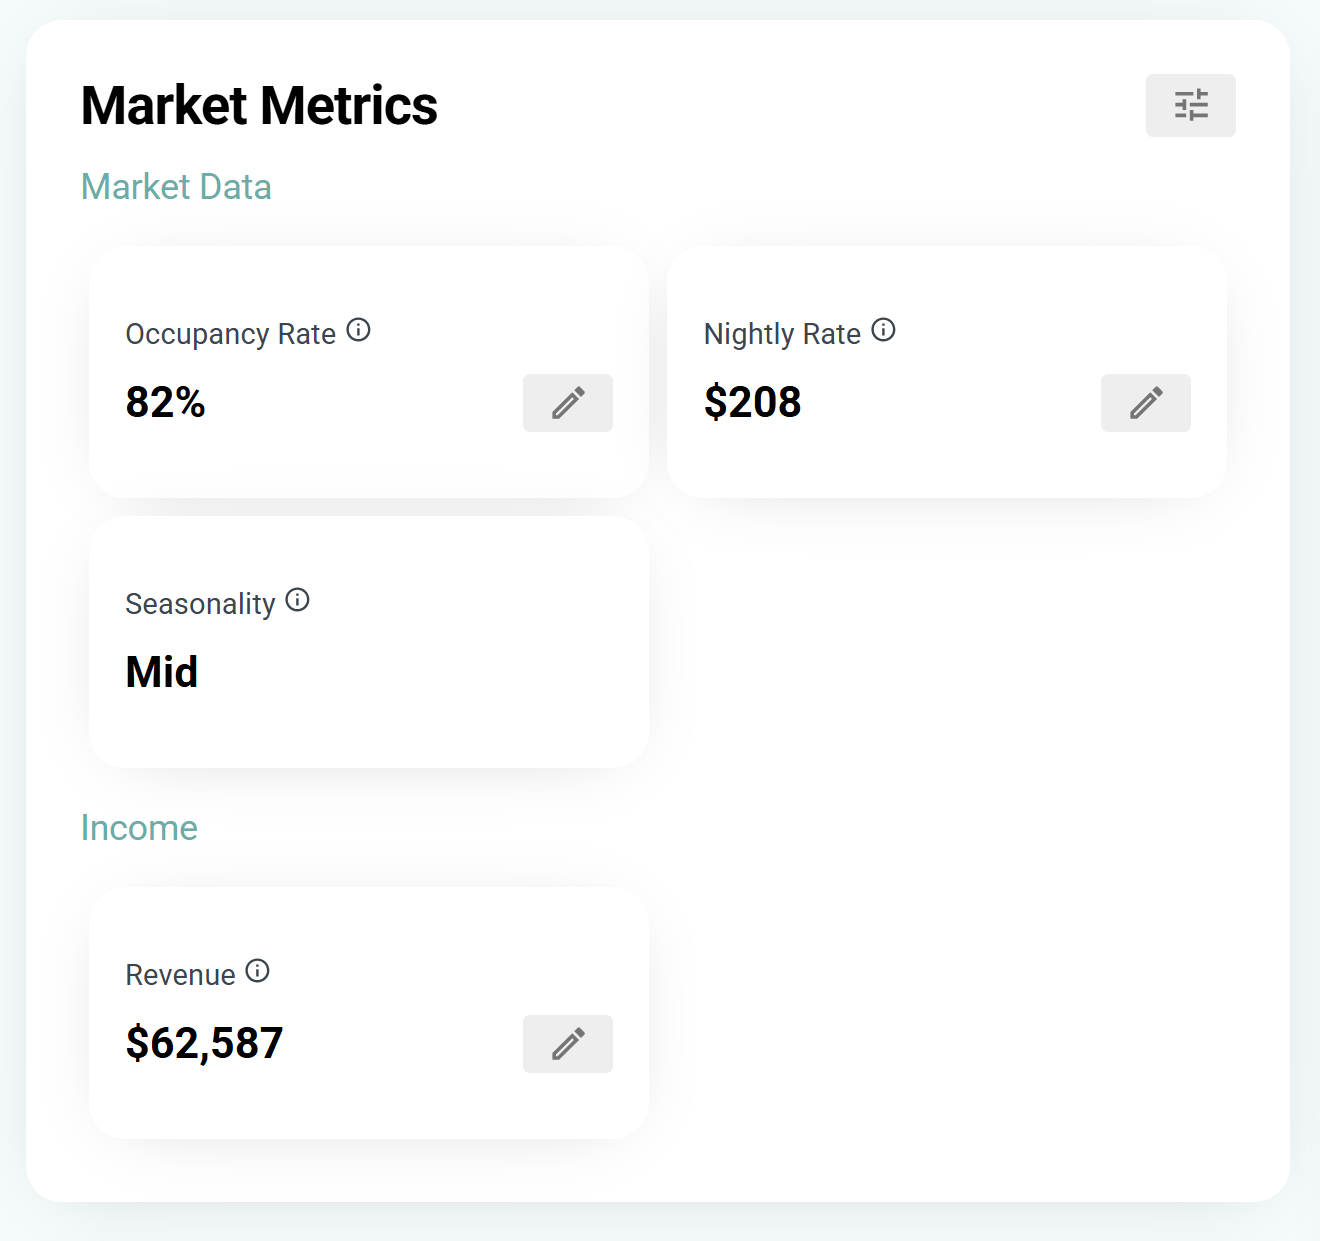
The calculator will now generate projected revenue, average daily rate (ADR), and occupancy rates based on real market data. Use these figures as your baseline for further financial analysis.
Adjust occupancy and ADR inputs
Default calculator values often smooth over the volatility of short-term rentals. To get an accurate ROI, you must manually override the Average Daily Rate (ADR) and occupancy percentage to match your specific property's performance drivers. Treat these inputs not as suggestions, but as the primary levers controlling your revenue forecast.
Verify and Adjust Average Daily Rate (ADR)
The ADR is the average income earned per paid occupied room or suite in a given time period. Calculators typically pull from broad market averages, which can significantly overestimate or underestimate your potential depending on your property's unique value proposition.
Start by auditing your current or comparable listing's nightly rates. If your property offers premium amenities—such as a private pool, hot tub, or dedicated workspace—your ADR should exceed the neighborhood median. Conversely, if your unit lacks parking or is located in a high-noise zone, you must discount the default ADR.
- Identify your baseline: Check the "average daily rate" for your zip code on official STR data platforms or local tourism boards.
- Apply amenity premiums: Add 5-15% to the baseline if you offer verified high-value amenities (e.g., dedicated office space, pet-friendly policies, or luxury finishes).
- Factor in seasonality: If the calculator uses a static annual ADR, manually adjust it for peak and off-peak seasons. A 20% variance between summer and winter rates is common in many markets.
Calibrate Occupancy Percentages
Occupancy rates are the most volatile input in any Airbnb revenue calculator. A default setting of 70-80% occupancy is often unrealistic for new listings or properties in saturated markets. Overestimating occupancy is the most common error in ROI projections, leading to inflated profit expectations.
To set a realistic occupancy target, analyze the booking patterns of comparable listings (comps) in your immediate vicinity. Look at their "availability calendar" and "review velocity" rather than just their stated rates. A property with few reviews and high availability likely has a lower true occupancy rate than the market average.
- New Listings: Start with a conservative 50-60% occupancy for the first 3-6 months while you build reviews and rank higher in search results.
- Established Listings: Use the last 12 months of actual booking data if available. If using market averages, subtract 5-10% to account for vacancy, cleaning, and maintenance downtime.
- Seasonal Adjustments: If your market is highly seasonal (e.g., ski towns or beach destinations), do not use a single annual percentage. Instead, calculate revenue month-by-month using specific seasonal occupancy rates.
Cross-Check Against Official Market Data
Before finalizing your inputs, verify your manual adjustments against official local data. Many cities and counties publish quarterly STR performance reports or require hosts to report occupancy data for tax purposes. These official sources provide the most accurate, granular view of market health.
If your calculated ROI is highly sensitive to a 5% change in occupancy, your model is fragile. In high-stakes investment scenarios, run a sensitivity analysis: adjust occupancy by ±10% and ADR by ±15% to see how the bottom line shifts. This helps you understand the risk exposure if market conditions deteriorate.
Input operating expenses and taxes
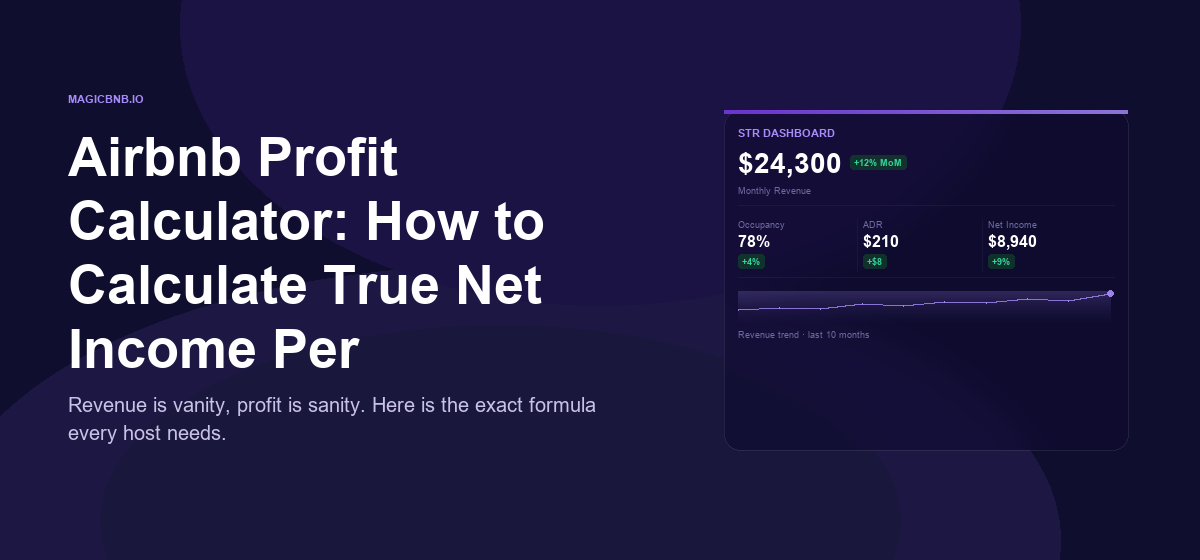
Gross revenue is a vanity metric that obscures your actual cash flow. To determine true profitability, you must subtract every hard and soft cost from the top line. This calculation moves you from gross income to Net Operating Income (NOI), the only number that matters for ROI.
Start by listing fixed operational costs. These are expenses that occur regardless of occupancy. Include property management fees, which typically range from 20% to 30% of revenue for full-service managers. Add insurance premiums, property taxes, and HOA fees. These costs are non-negotiable and must be deducted before calculating profit.
Next, account for variable operating expenses. Cleaning fees are often passed to guests, but you must cover the cost of the cleaning service itself. Budget for utilities, internet, and amenities like Wi-Fi or coffee supplies. Include maintenance reserves for repairs and replacements, as well as platform commissions from Airbnb or Vrbo.
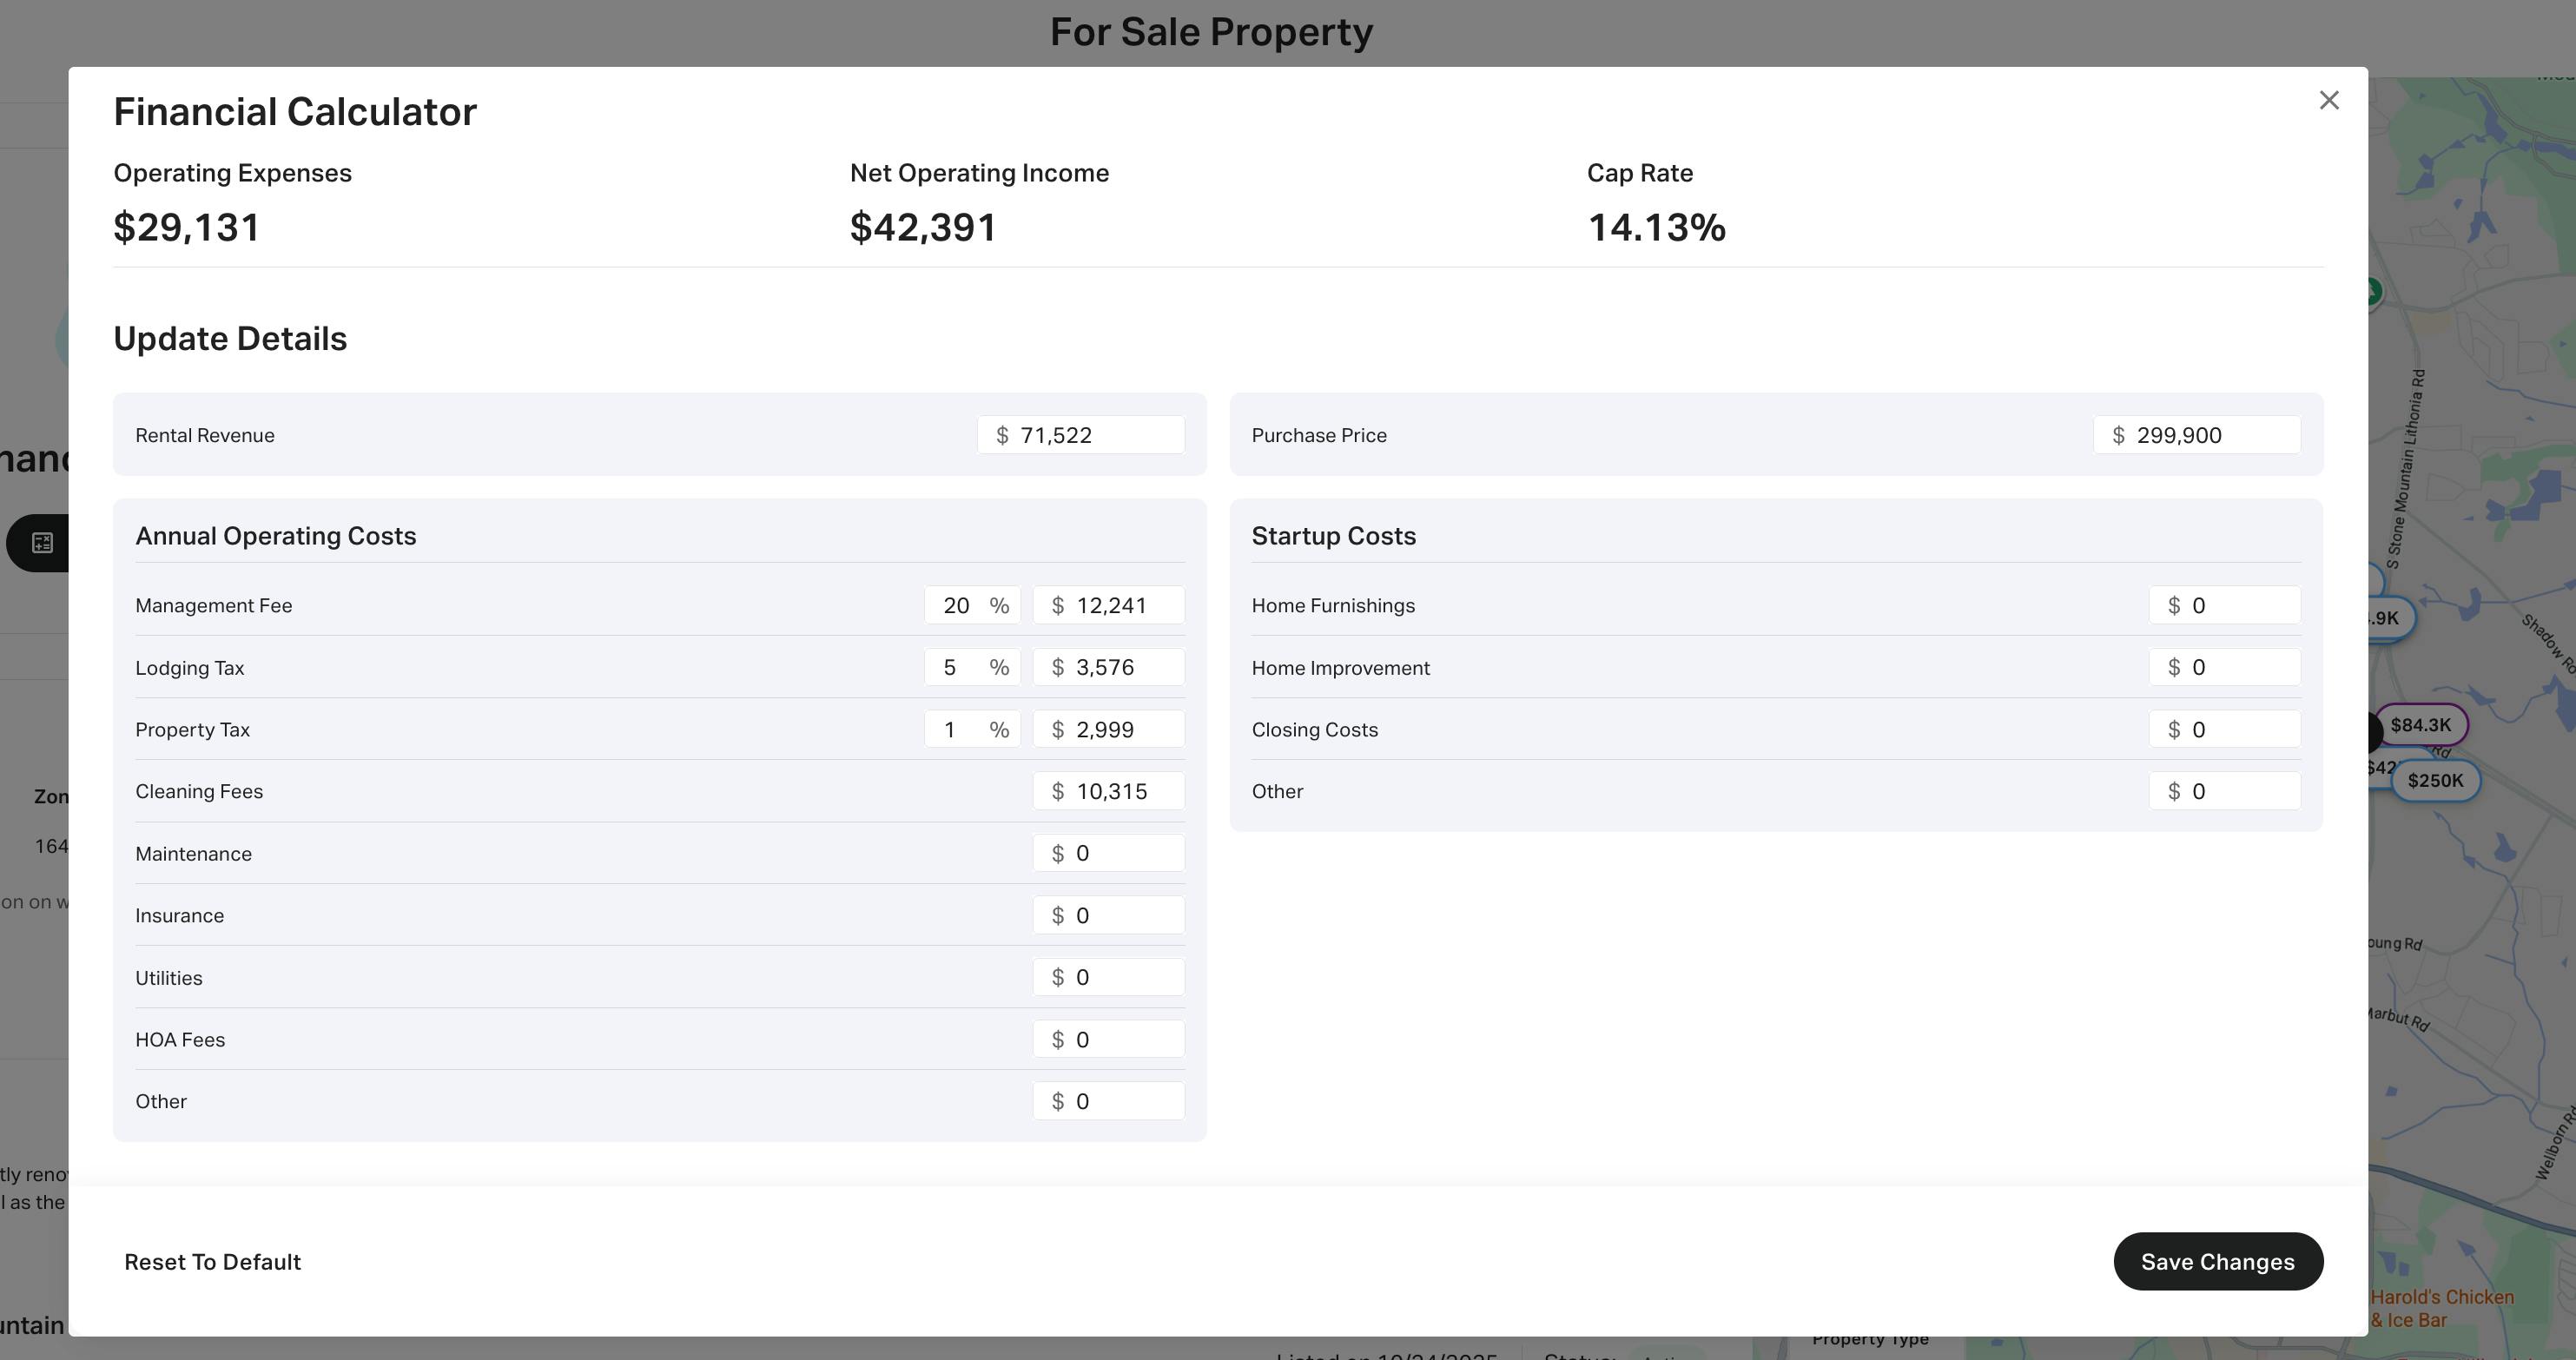
Subtract these total expenses from your estimated gross revenue. The result is your NOI. If the NOI does not cover your mortgage payments and provide a positive cash flow margin, the investment carries high financial risk. Use this figure to stress-test your assumptions against interest rate fluctuations or seasonal dips in demand.
Calculate cash-on-cash return
Cash-on-cash return measures the actual percentage yield on the money you have put into the property, excluding debt service. Unlike gross revenue or net operating income, this metric reflects the real efficiency of your capital. It tells you how many dollars of profit you earn for every dollar invested from your own pocket.
To calculate this accurately, you must first determine your pre-tax cash flow. This is your Net Operating Income minus your annual debt service (mortgage payments). This figure represents the actual cash remaining in your hands after all operating expenses and lender requirements are paid.
Next, sum your total initial cash investment. This includes your down payment, closing costs, and any immediate rehabilitation or furnishing expenses. These are the funds that leave your bank account at the start of the venture. Do not include the value of the property itself, only the cash you actually spent to acquire and prepare it.
Divide your annual pre-tax cash flow by your total initial cash investment. Multiply the result by 100 to express it as a percentage. This figure is your cash-on-cash return. It is the primary benchmark for comparing your short-term rental investment against other opportunities, such as stocks or bonds, ensuring your capital is working as hard as possible.
Verify results against local regulations
An Airbnb revenue calculator provides a financial projection, not a legal guarantee. The numbers generated assume your property can legally operate as a short-term rental in its current zoning district. If the municipality prohibits or restricts STRs, the projected ROI becomes irrelevant.
Start by checking the city or county zoning code for "short-term rental" or "transient occupancy" restrictions. Many jurisdictions require a specific permit, business license, or certificate of occupancy before you can list. Operating without these approvals risks heavy fines, forced removal from platforms, and potential legal action.
Next, review any Homeowners Association (HOA) or condo board rules. Even if the city allows STRs, private covenants may ban them entirely or limit the number of rental days per year. These private restrictions are often stricter than local laws and are enforceable through civil penalties.
Finally, verify tax registration requirements. Most areas require hosts to collect and remit transient occupancy taxes or bed taxes. Failure to register can result in back-taxes and penalties that significantly erode your profit margin. Always confirm the current status with the local planning department or tax authority before finalizing your investment.
Short term rental investment FAQ
Use these questions to verify data integrity and evaluate platform alternatives before finalizing your ROI calculations.
Always cross-reference calculator outputs with official local regulations and recent comparable listings to ensure your ROI model reflects current market realities.
Investment validation checklist
Before signing a purchase agreement, treat your Airbnb revenue calculator output as a hypothesis, not a guarantee. You must stress-test every variable against official local regulations and verified market data to ensure the numbers hold up under scrutiny.
1. Verify local STR regulations
Short-term rental rules change frequently. Check your city’s planning department website for zoning restrictions, permit requirements, and occupancy limits. A property that looks profitable on paper may be illegal to operate as an STR in your specific jurisdiction.
2. Confirm insurance and tax implications
Standard homeowners insurance rarely covers commercial rental activity. Obtain quotes for commercial or specialized STR insurance. Additionally, consult a tax professional regarding local transient occupancy taxes and how they impact your net operating income.
3. Audit comparable property performance
Use tools like AirDNA to pull data on actual competitors in your immediate neighborhood. Do not rely on city-wide averages. Look at properties with similar bedroom counts and amenities to validate your assumed occupancy rates and average daily rates (ADR).
4. Stress-test operating expenses
Calculator defaults often underestimate costs. Add 20–30% to your projected maintenance, cleaning, and management fees. Include vacancy buffers for seasonal dips or unexpected regulatory changes. If the deal doesn’t cash flow under these conservative assumptions, walk away.
No comments yet. Be the first to share your thoughts!