
Get Airbnb Occupancy Rates Right
Before you adjust your pricing or list a new property, you need accurate occupancy baselines. Relying on vague industry averages often leads to underpricing or missed revenue windows. Airbnb provides specific data for your listings, but it does not offer a public directory of neighborhood averages.
To see your own performance, log in to your Airbnb dashboard and navigate to the Occupancy and rates section. Here, you can review performance data across specific time frames and compare them to similar listings in your area. This built-in comparison is your most reliable source for understanding your specific unit's demand.
For market-wide data, you will need to use third-party tools. Platforms like Airbtics allow you to enter a specific address to see average occupancy rates for that location. These tools help you gauge local competition, but they are estimates. Always cross-reference these numbers with your own historical data to avoid making decisions based on generalized market trends.
How to track and improve your Airbnb occupancy rates
Occupancy rates dictate your cash flow, but they are not static. In 2026, the gap between hosts who hit 70%+ occupancy and those stuck below 50% comes down to data discipline. You need to know your baseline before you can optimize your pricing or marketing.
Follow this sequence to audit your current performance and identify where you are leaving money on the table.
Start by checking your Airbnb dashboard’s Occupancy and rates section. This gives you a raw view of your performance across specific time frames. Compare your metrics against similar listings in your immediate area to see if you are underperforming the local market average. Airbnb provides these filters directly in your performance analytics.
Your dashboard shows your specific unit, but external tools like Airbtics or AirDNA reveal broader market trends. Enter your address into these platforms to see the average occupancy rate for your zip code or neighborhood. This helps you distinguish between a property-specific problem (like bad photos or slow response times) and a market-wide slowdown.
Look at your occupancy data month-by-month for the past 12 months. Identify your "shoulder seasons"—the months where your occupancy drops significantly. If your data shows a consistent dip in October or February, note this as a target area for discounting or targeted marketing campaigns to fill those gaps.
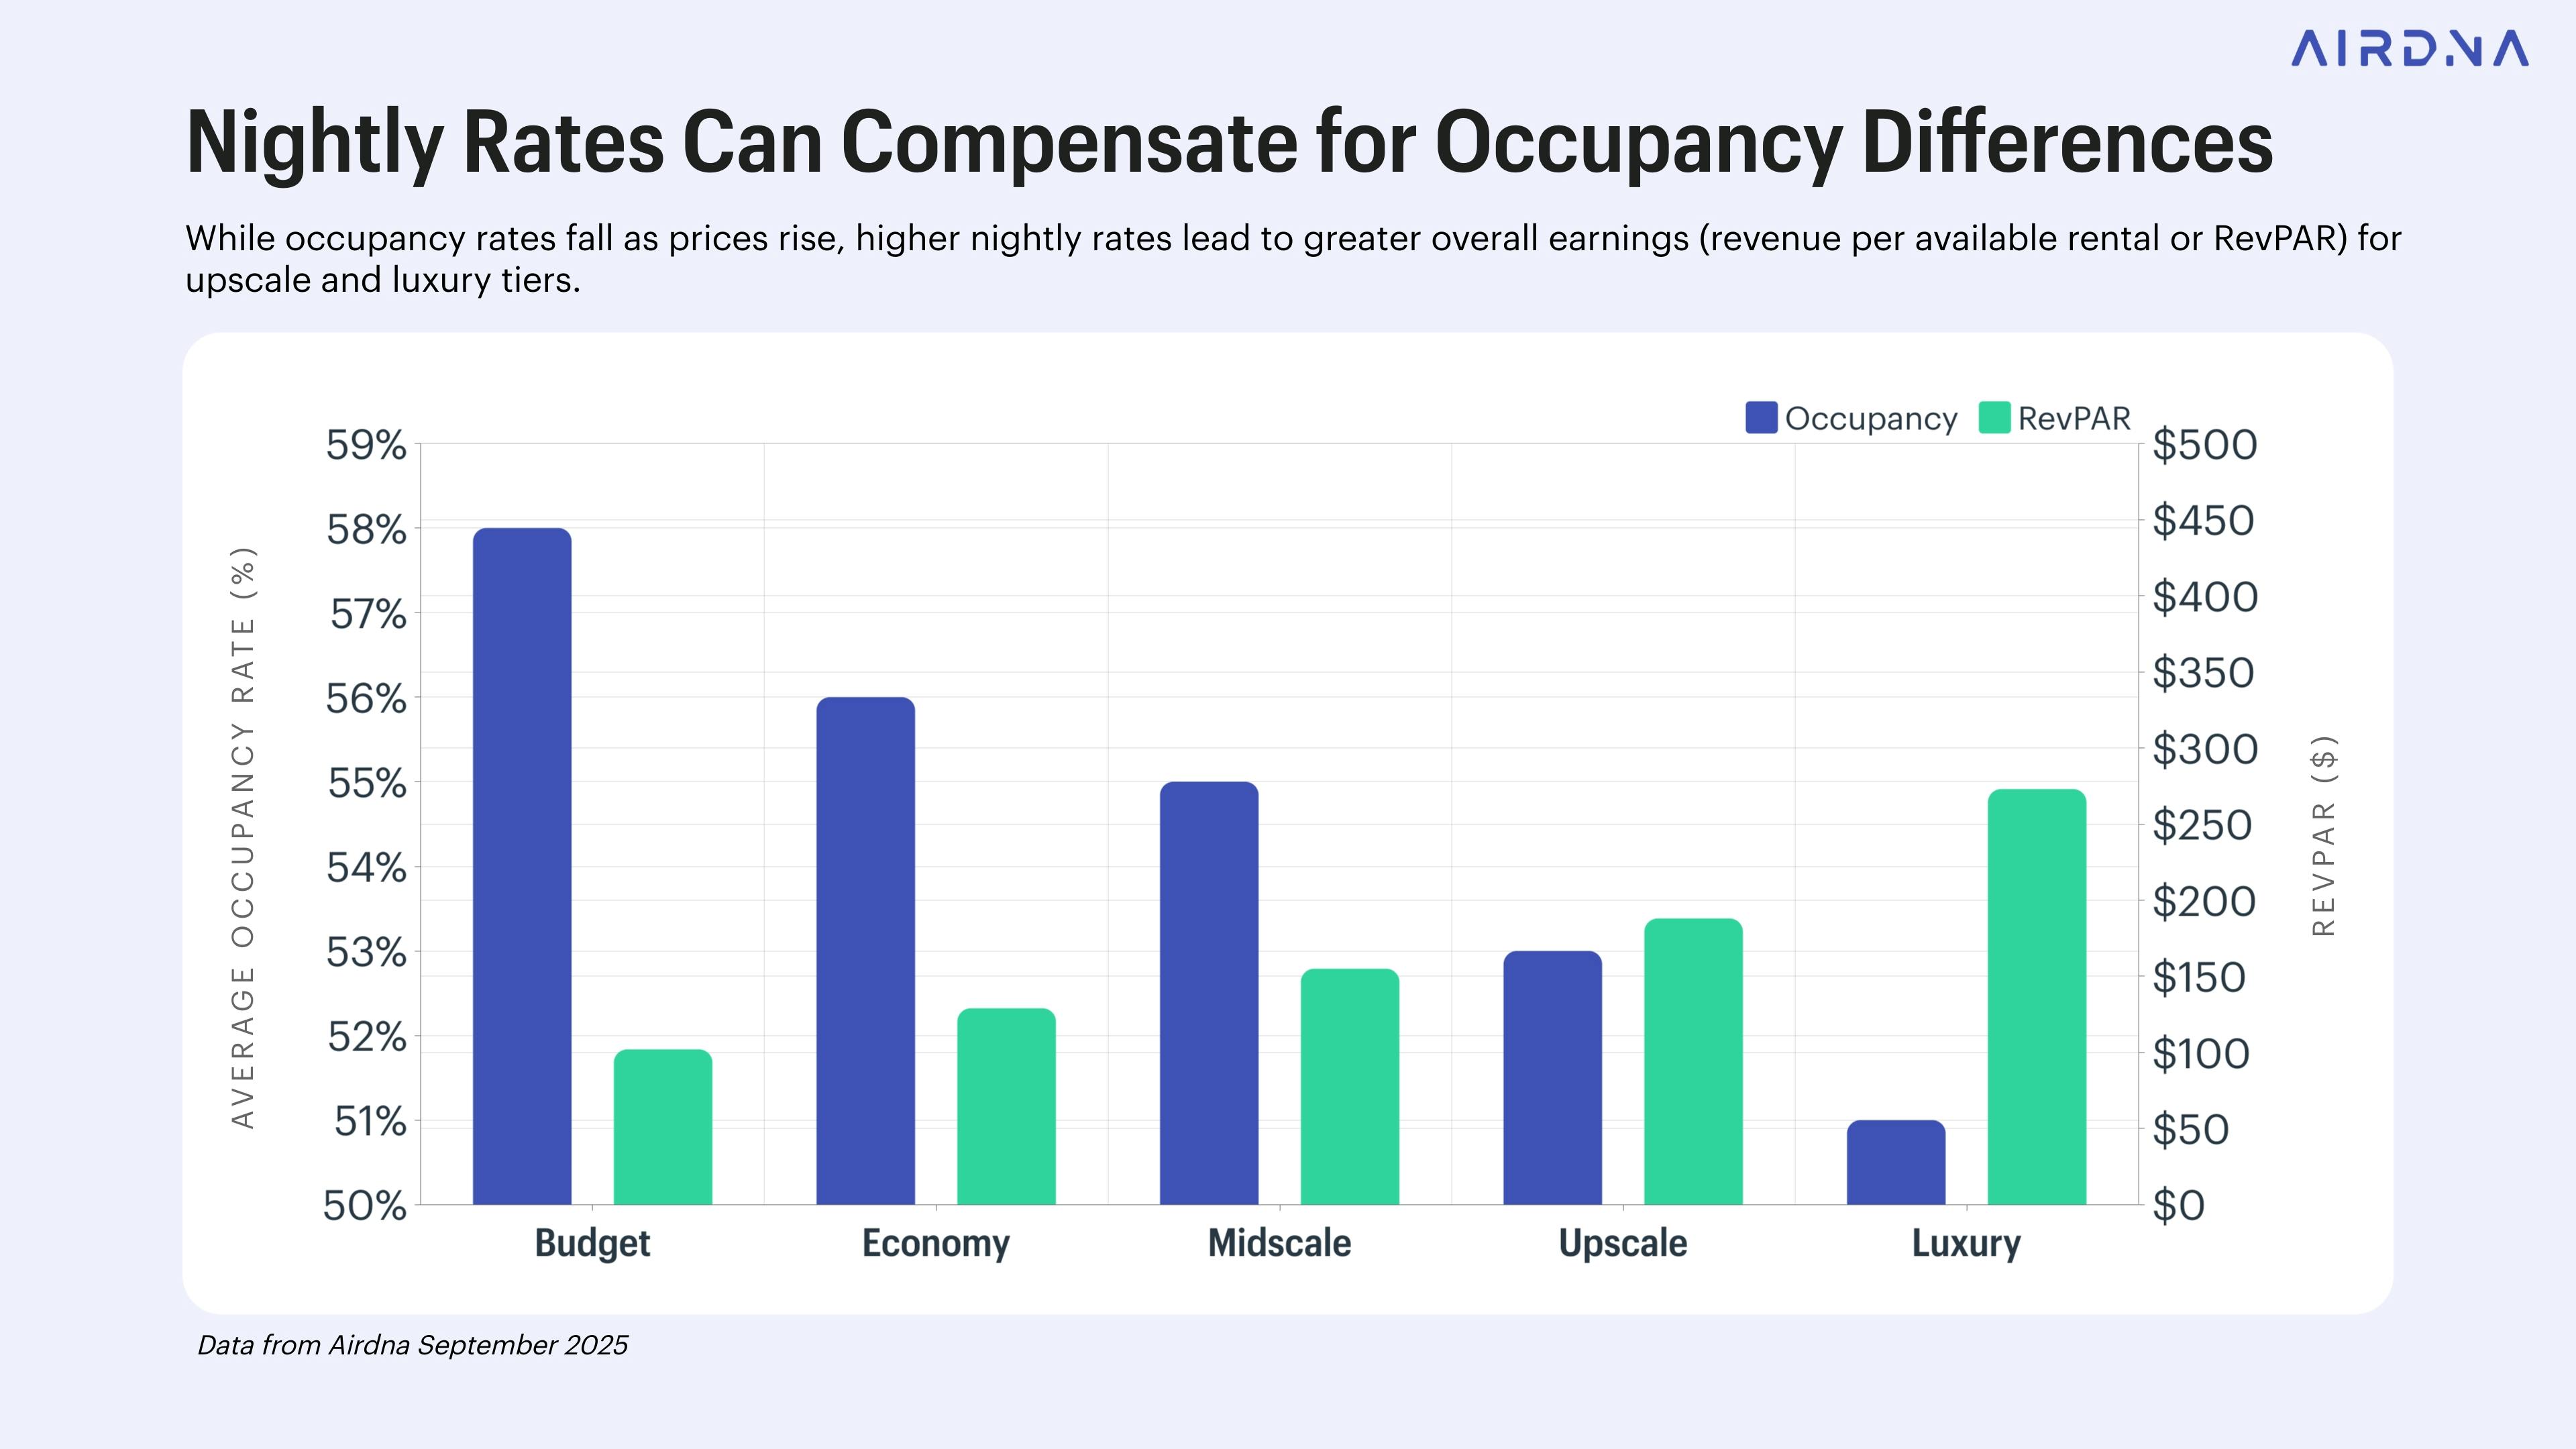
Occupancy alone is misleading. A 90% occupancy rate at $100/night is worse than a 60% rate at $200/night. Calculate your RevPAN by dividing your total monthly revenue by the number of nights available. This metric tells you if your pricing strategy is actually working or if you are simply filling dates at a loss.
Use the data from steps 1 and 2 to set a realistic target. If the market average is 65%, aim for 70% with optimized pricing. If you are already at 85%, focus on yield management rather than filling more dates. Adjust your minimum stay requirements and dynamic pricing rules to hit these specific numerical goals.
-
Review Airbnb dashboard occupancy vs. area average
-
Check Airbtics or AirDNA for neighborhood benchmarks
-
Identify lowest-performing months
-
Calculate RevPAN for the last quarter
-
Set a new occupancy target based on data
Common mistakes that lower occupancy
Even with good data, simple errors can keep your occupancy rates below market potential. These mistakes often cost more in lost nights than they save in convenience.
Ignoring dynamic pricing
Static pricing is the fastest way to lose bookings. If you set one rate for the whole year, you leave money on the table during peak demand and miss guests during slow weeks. Airbnb’s Smart Pricing tool is a basic start, but it rarely matches local events or competitor moves. You need to adjust rates weekly based on local events, seasonality, and your property’s unique appeal. Use a dedicated pricing tool that syncs with Airbnb and tracks your competitors’ rates.
Overlooking seasonal trends
Many hosts treat every month as the same. This mistake leads to overpricing in shoulder seasons and underpricing during holidays. Check local tourism data, not just general city trends. A beach town’s peak might be July, while a ski town’s is December. Adjust your calendar and pricing strategy to match these shifts. Don’t assume your market behaves like the average Airbnb listing.
Neglecting listing quality
Your photos, description, and amenities directly impact your search ranking and conversion rate. Blurry photos or vague descriptions make guests skip your listing. Use professional photography that highlights your property’s best features. Write a clear, honest description that answers common guest questions. Keep your listing updated with current amenities and house rules. A polished listing builds trust and justifies higher rates.
Poor communication
Slow responses drive guests away. Airbnb’s algorithm favors hosts who reply quickly. Set up automated messages for common questions, but keep them personal. Respond to inquiries within an hour. Clear communication reduces misunderstandings and leads to better reviews. Treat every guest interaction as an opportunity to build loyalty.
Quick checklist
-
Review pricing weekly
-
Update photos seasonally
-
Respond to messages within 1 hour
-
Monitor competitor rates
-
Adjust calendar for local events
Airbnb occupancy rates: common: what to check next
Understanding how occupancy is calculated and where to find accurate data helps you set realistic revenue goals. National averages often mask the wide variance between markets, so checking local performance metrics is essential before making investment decisions.
No comments yet. Be the first to share your thoughts!