
Get airbnb market data right
Before you analyze pricing or occupancy trends, you need reliable data. Most public Airbnb listings show only current rates, not historical performance. This gap makes it difficult to predict how a property will perform during off-season months or after local regulations change. Relying on surface-level metrics often leads to overestimating revenue and underestimating vacancy risks.
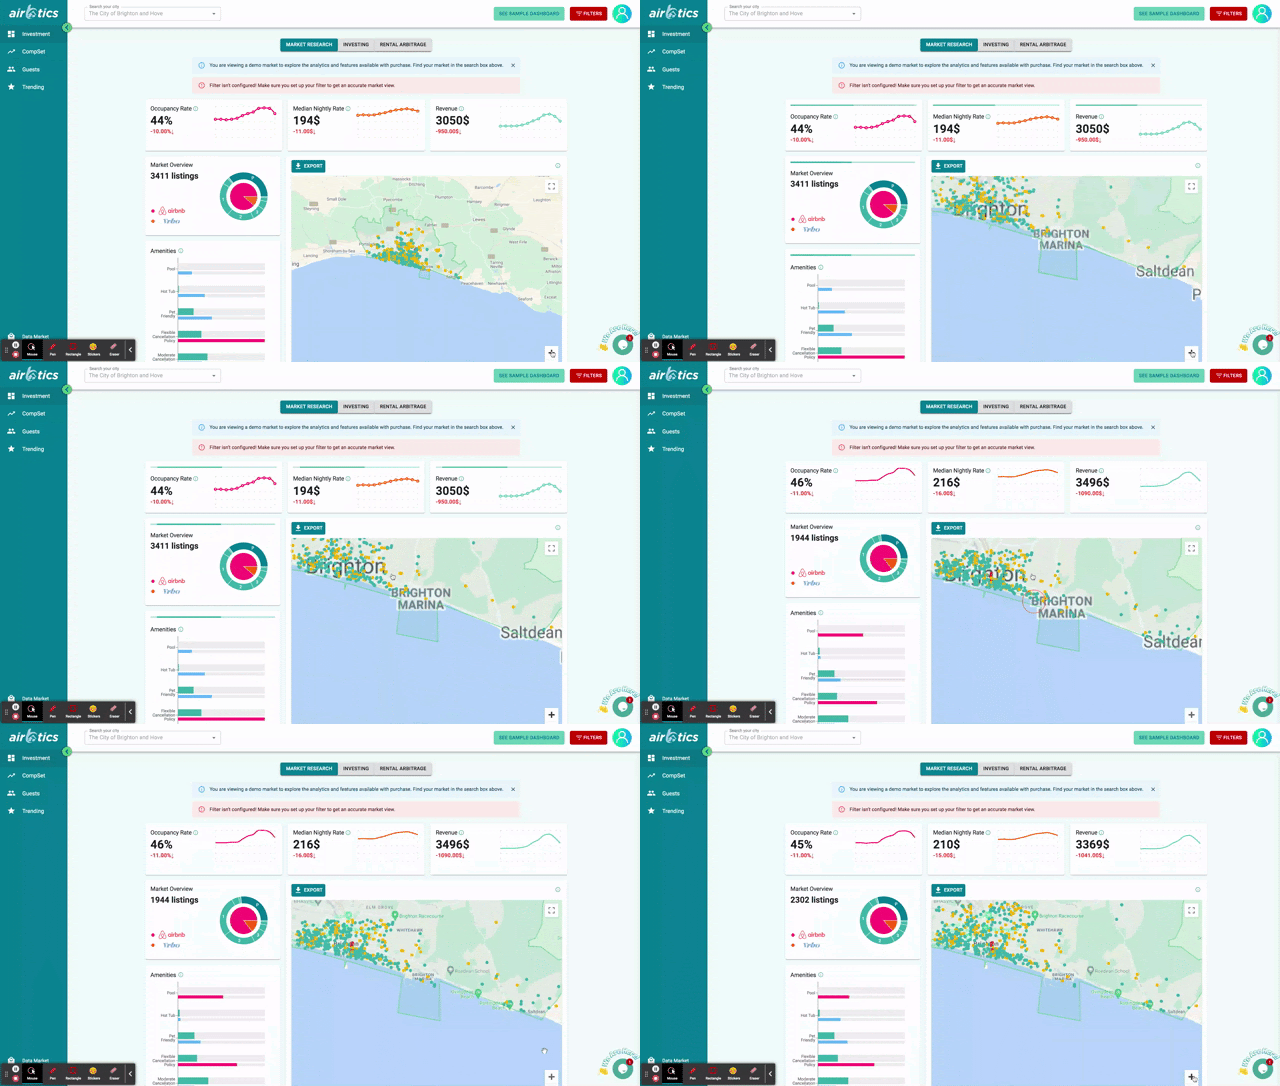
To build a solid foundation, you should pull data from established short-term rental analytics platforms. Tools like AirDNA and AirROI aggregate millions of listings across 190+ countries, providing the historical context necessary for accurate forecasting. These platforms track occupancy rates, average daily rates (ADR), and revenue potential for specific zip codes or neighborhoods. Start by entering your target location to see how your property compares to the local competition.
Once you have the data, focus on three core metrics: occupancy rate, ADR, and revenue per available room (RevPAR). Occupancy tells you how often the property is booked. ADR shows the average price per night. RevPAR combines both to give a true picture of earning potential. Ignore vanity metrics like total booking volume if they don’t translate to actual revenue after expenses.
A common mistake is ignoring seasonality. Many hosts assume steady income year-round, but vacation rentals often see sharp drops in demand during certain months. Use the data to identify low-demand periods and adjust your pricing strategy accordingly. Dynamic pricing tools can help, but they rely on the quality of the underlying data. If your data is outdated or incomplete, your pricing will be too.
Finally, verify your findings by checking local regulations and market saturation. Even the best data won’t help if your city bans short-term rentals or if the market is oversaturated. Use the platform’s market insights to see how many new listings have entered the area recently. If supply is growing faster than demand, your revenue projections need to be more conservative. This step ensures your strategy is grounded in reality, not just optimistic assumptions.
Work through the steps
Airbnb Market Data works best as a clear sequence: define the constraint, compare the realistic options, test the tradeoff, and choose the path with the fewest hidden costs. That order keeps the advice usable instead of decorative. After each step, pause long enough to check whether the recommendation still fits the reader's actual situation. If it depends on perfect timing, unusual access, or a best-case budget, include a simpler fallback.
Common mistakes in vacation rental analytics
Even with robust data tools, small errors in how you interpret market signals can quietly erode your rental property ROI. The most frequent pitfalls usually involve mixing up data sources or misreading seasonal trends. Here is how to avoid the errors that lead to poor outcomes.
Ignoring local seasonality
Many hosts rely on national or regional averages to set prices. This is a critical error because local demand drivers—like a nearby university schedule or a specific annual festival—often diverge significantly from broader trends. If you price based on national data, you will likely overprice during local slumps and underprice during local peaks. Always filter your analytics by your specific zip code or neighborhood to capture these micro-seasons.
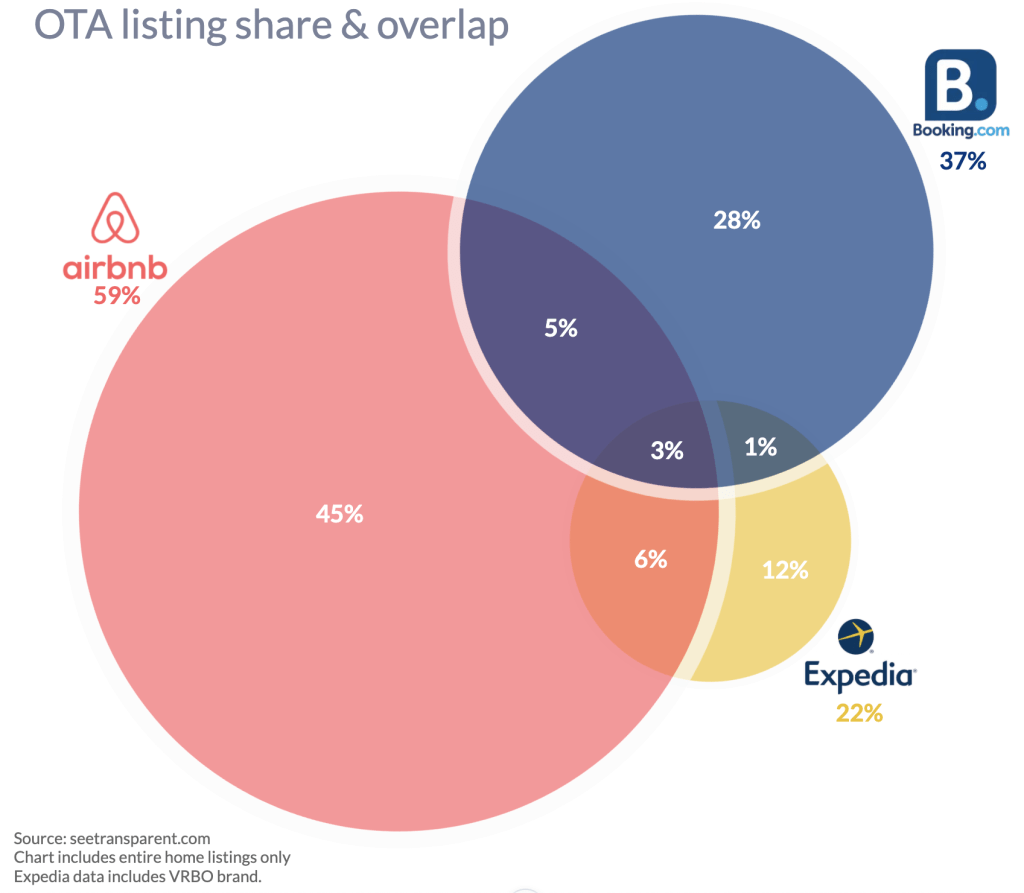
Mixing up Airbnb and Vrbo data
Airbnb and Vrbo audiences behave differently. Airbnb guests often book last-minute and value unique experiences, while Vrbo travelers typically plan further in advance and prioritize space for families. Using a single data model for both platforms can distort your occupancy projections. Check the performance metrics for each platform separately to understand which amenities drive bookings where.
Chasing peak revenue without calculating expenses
It is easy to get excited by high gross revenue numbers during peak seasons. However, failing to account for increased cleaning costs, higher utility usage, and platform fees during these periods can leave you with lower net profit than you expect. Always run a net revenue calculation that deducts all variable expenses before celebrating a high occupancy rate.
Overlooking competitor supply changes
Your market is dynamic. A new condo complex opening nearby can suddenly saturate the supply, driving down your daily rates even if demand remains steady. Failing to monitor new listings in your immediate vicinity means you might be pricing yourself out of the market. Regularly audit the number of active listings in your area to adjust your strategy before the market shifts.
Airbnb market data: what to check next
Before committing capital, it helps to clear up common hurdles around data access and accuracy. These answers address the practical steps for sourcing reliable Airbnb market data and interpreting what those numbers mean for your specific property.
No comments yet. Be the first to share your thoughts!