
Enter property details and location
The accuracy of your airbnb revenue calculator results depends entirely on the data you feed it. Think of the calculator as a high-performance engine; if you put in low-grade fuel, the output will be unreliable. To get a realistic projection of your potential income, you need to move beyond generic city averages and provide granular, hyper-local information.
Start by entering the exact street address of the property. Most advanced tools, such as AirDNA or AirbnbROI, use geospatial data to pull comparable rental performance from nearby listings. A property in the same city but a different neighborhood can have vastly different demand patterns. For example, a home near a major convention center might see high weekday occupancy, while one in a quiet residential suburb may rely heavily on weekend leisure travelers.
Tip: Use the exact street address, not just the city, to capture hyper-local demand fluctuations.
Next, input the specific physical attributes of the unit. This includes the number of bedrooms, bathrooms, and total square footage. These metrics directly influence your Average Daily Rate (ADR). A three-bedroom house will naturally command a higher rate than a one-bedroom condo, especially for families or groups. Be precise here; even small discrepancies in room count can skew your revenue estimates.
Finally, set the baseline occupancy and nightly rate. If the calculator allows, use the suggested ADR from its internal market data as a starting point, then adjust based on your unique selling points (e.g., pool, parking, or luxury amenities). Remember, these tools provide estimates based on historical data, not guarantees. Treat the numbers as a baseline for analysis, not a fixed promise of income.
Adjust occupancy and pricing assumptions
Default algorithms in an Airbnb revenue calculator are useful starting points, but they rarely capture the nuance of your specific market. To get an accurate ROI, you need to replace those generic estimates with local data. This means looking at two main levers: your average daily rate (ADR) and your occupancy percentage.
Think of the calculator as a blank canvas. The default numbers are just the primer. If you don't paint over them with real-world expectations, your financial projections will be off. You can refine these inputs in two ways: by manually adjusting the percentages based on your research, or by using a tool that pulls live market data.
Compare default estimates vs. adjusted assumptions
The difference between a generic estimate and a market-specific one can be thousands of dollars in projected income. The table below illustrates how adjusting for local seasonality and competitive pricing changes the outlook for a standard property.
| Assumption | Default Calculator Estimate | Adjusted Market Data | Impact on Annual Revenue |
|---|---|---|---|
| Occupancy Rate | 75% | 62% | -13% (Lower seasonal demand) |
| Average Daily Rate (ADR) | $150 | $175 | +$25 (Premium location) |
| Cleaning Fee | $100 | $120 | +$20 (Higher turnover cost) |
| Platform Fees | 15% | 14% | -1% (Superhost discount) |
| Net Annual Revenue | $54,750 | $58,900 | +$4,150 (More realistic profit) |
Step-by-step: Refining your inputs
To ensure your Airbnb revenue calculator reflects reality, follow these steps to update your assumptions with verified local data.

Find the average daily rate for similar properties in your neighborhood. Look at active listings on major platforms and note their nightly prices during peak and off-peak seasons. Use this range to set your own ADR, rather than relying on the calculator's national average.
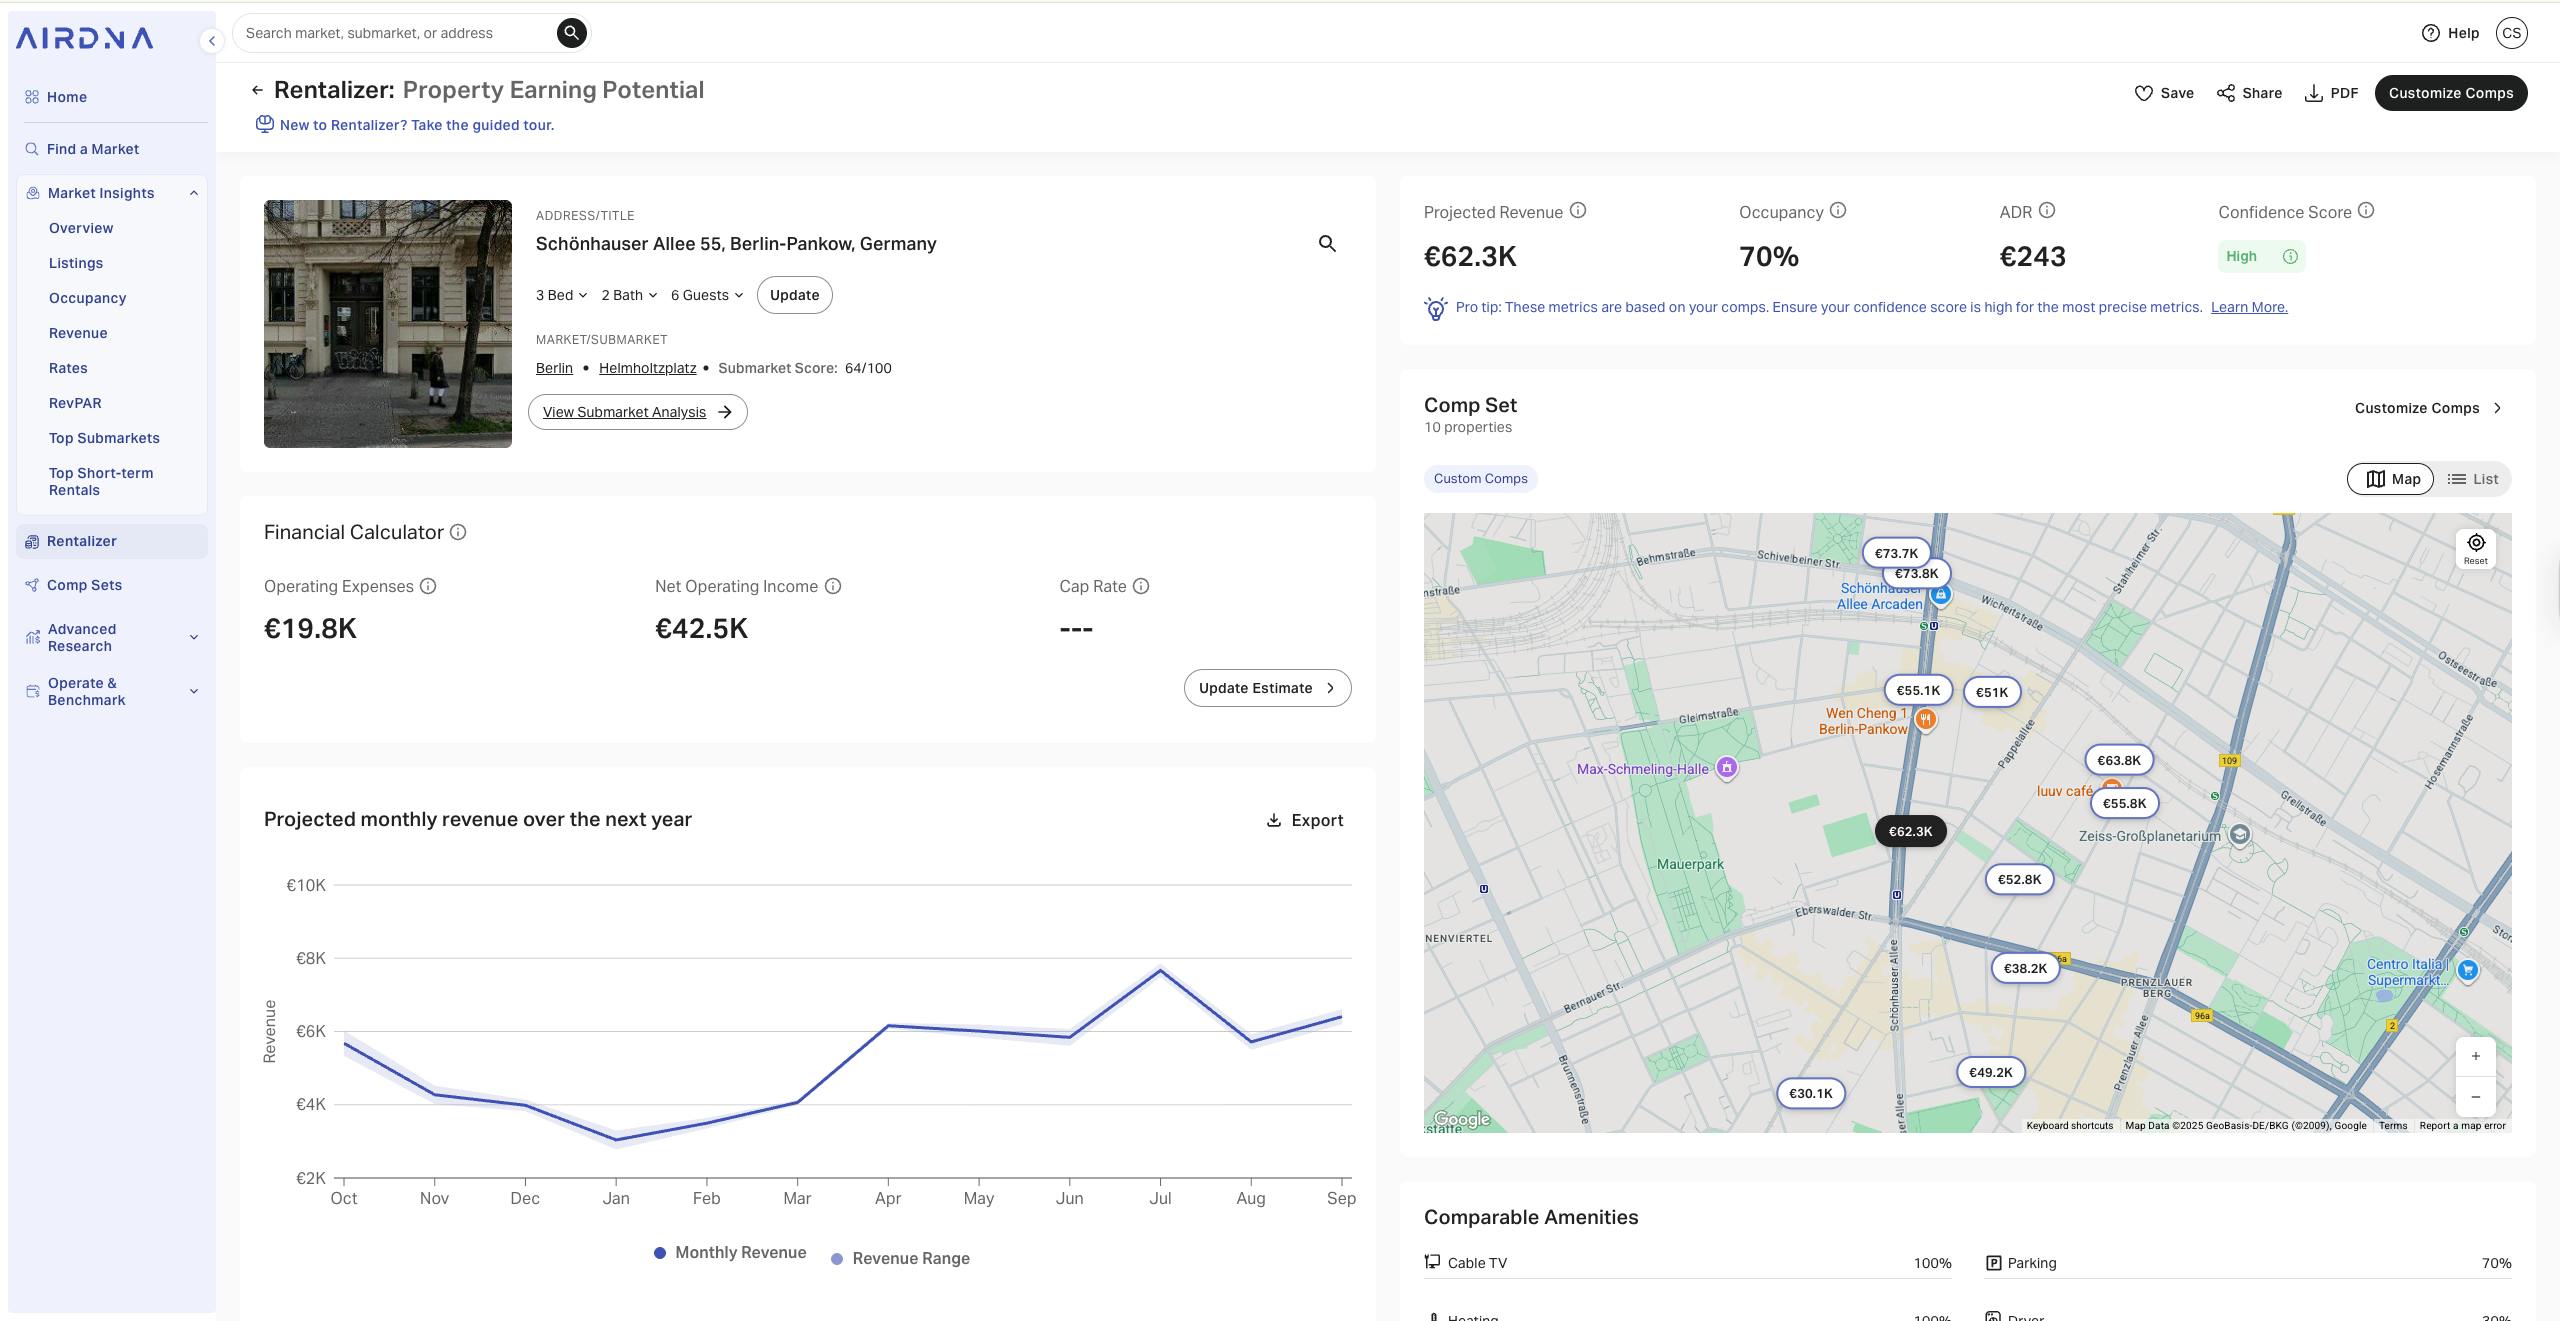
Occupancy rates vary wildly by location. A property in a tourist hotspot might hit 80% occupancy, while one in a business district may drop to 50% on weekends. Check local short-term rental reports or use a tool like Rabbu to get weekly-updated occupancy data for your specific zip code.
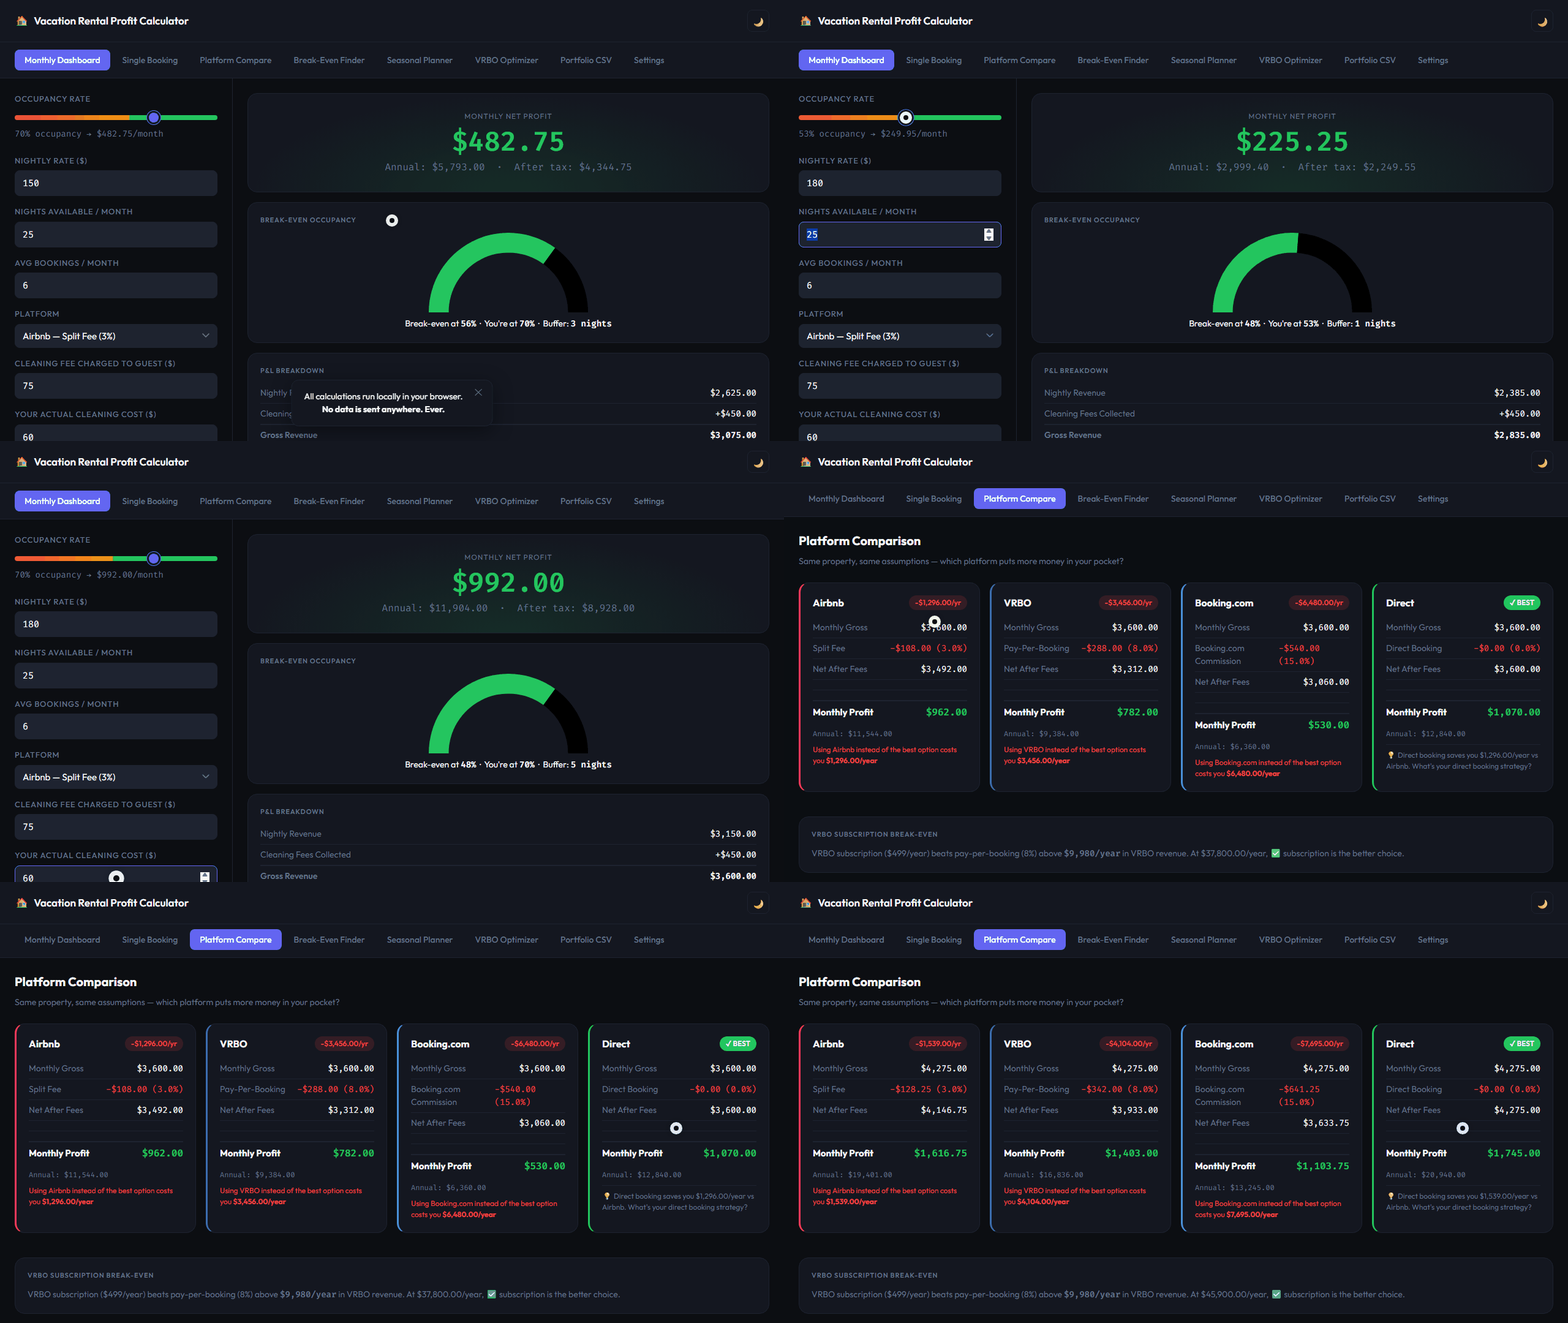
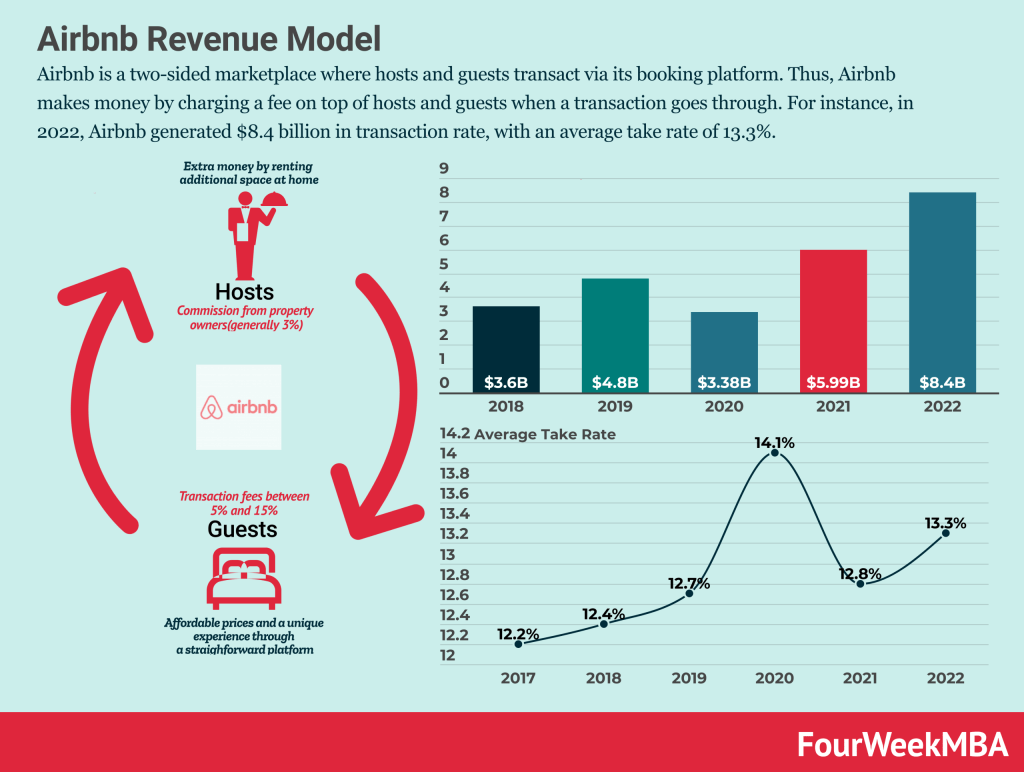
Update variable costs like cleaning fees, utility estimates, and platform service fees. These small changes often get overlooked in default models but significantly impact your net operating income. If you are a Superhost, check if your platform offers a reduced commission rate and adjust the fee percentage accordingly.
Once your ADR, occupancy, and cost assumptions are updated, run the calculation again. Compare this new figure to your default estimate. This adjusted number is your best guess for annual revenue and should form the basis of your ROI and cap rate calculations.
By grounding your Airbnb revenue calculator in local reality, you move from guessing to planning. This precision helps you decide if a property is a viable investment or if the numbers simply don't add up.
Input operating expenses and taxes
Your Airbnb revenue calculator is only as good as the numbers you put into it. Gross revenue is just the starting line; the actual profit comes after you subtract every cost associated with running the rental. If you skip this step, your ROI will look artificially high, leading to bad investment decisions.
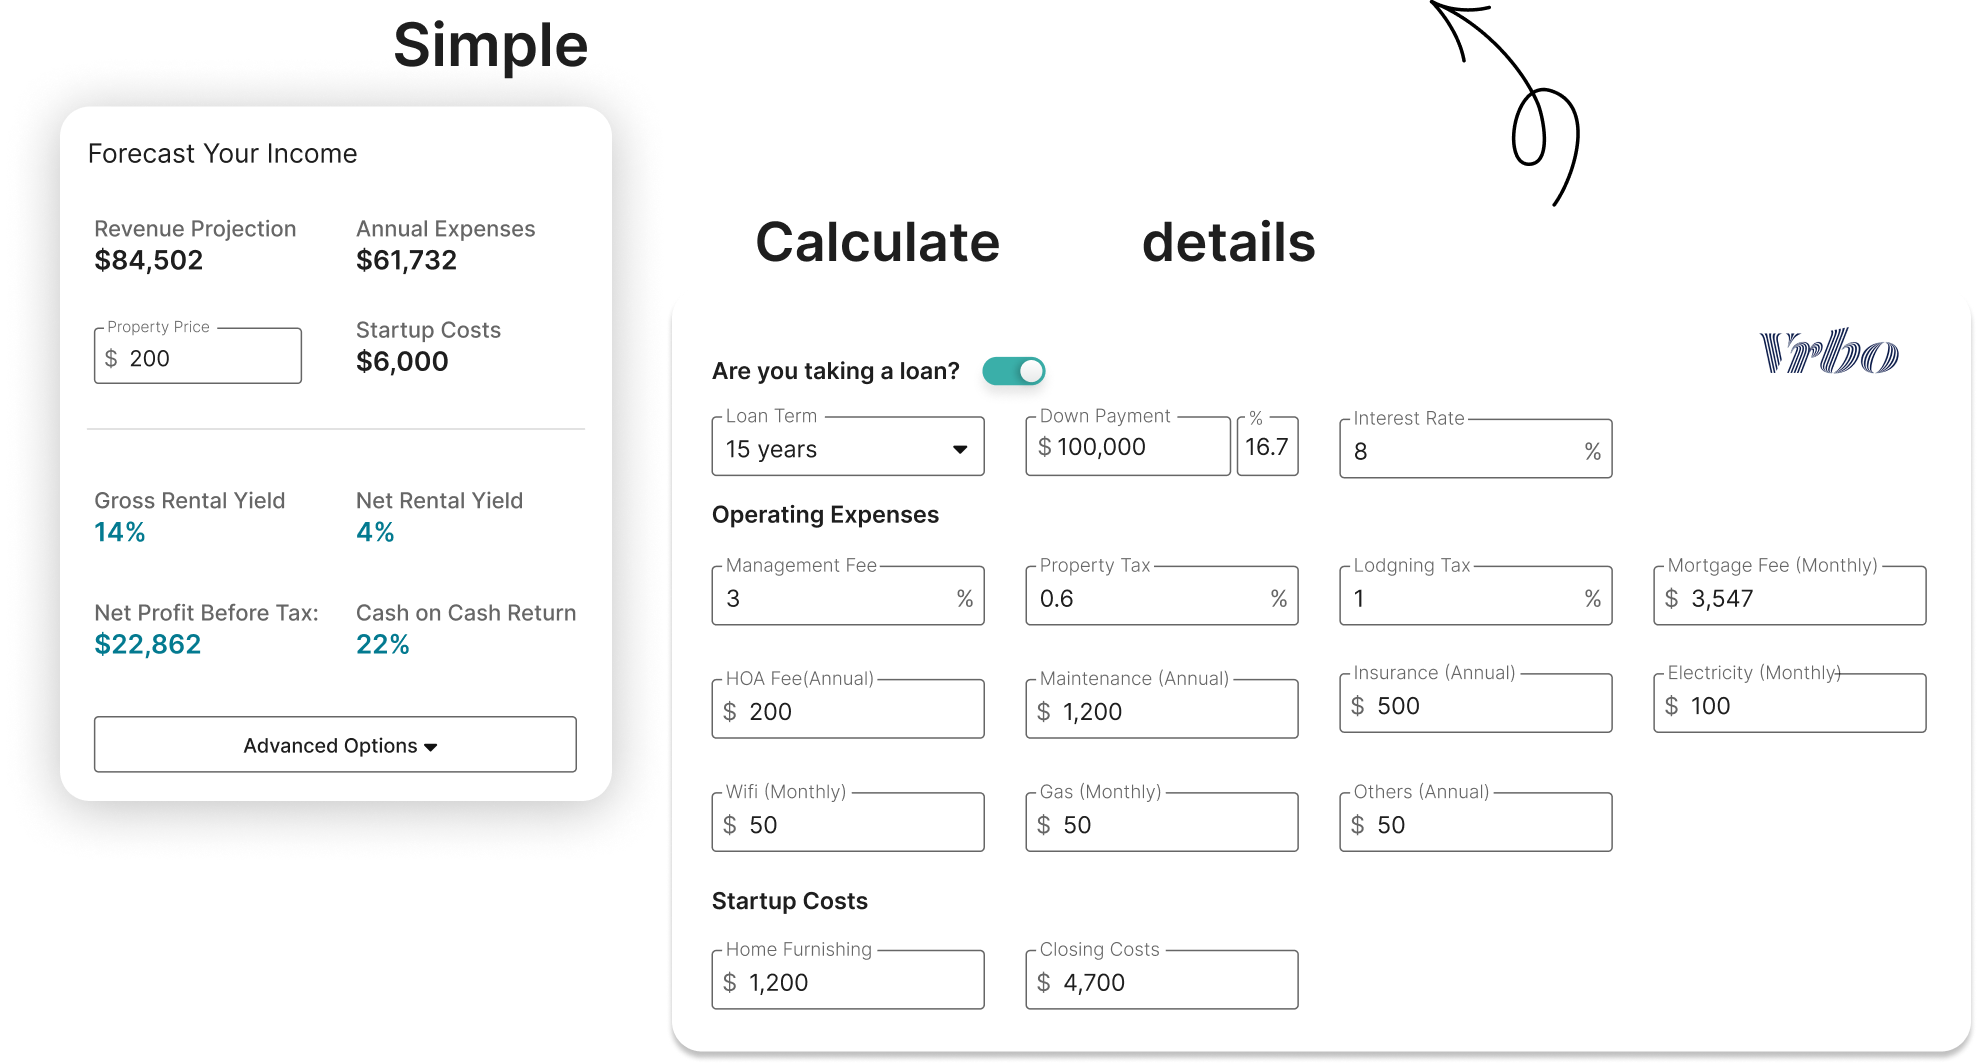
Most hosts forget the small, recurring costs that eat into margins over time. A thorough expense model includes property management fees (typically 20-25% of revenue), cleaning fees paid to staff, utilities, internet, and insurance. Don’t forget variable costs like supplies (toilet paper, coffee) and maintenance reserves. Set aside 5-10% of revenue for repairs to keep the property in rentable condition.
Taxes are another major variable. You need to account for property taxes, income taxes, and potentially transient occupancy taxes (tourist taxes) charged by local jurisdictions. These rates vary wildly by city and county, so check your local government’s official tourism or finance department for exact percentages.
To ensure you don’t miss anything, use this checklist to verify your expense inputs:
-
Property management fees (if applicable)
-
Cleaning and turnover costs
-
Utilities and high-speed internet
-
Insurance and property taxes
-
Maintenance and repair reserve (5-10% of revenue)
-
Supplies and amenities
-
Local transient occupancy taxes
Once you have these numbers, plug them into your calculator. The tool will subtract these costs from your estimated gross income to give you a realistic net operating income (NOI). This figure is the foundation for calculating your true Cap Rate and understanding whether the property actually makes money.
Analyze ROI and cash flow projections
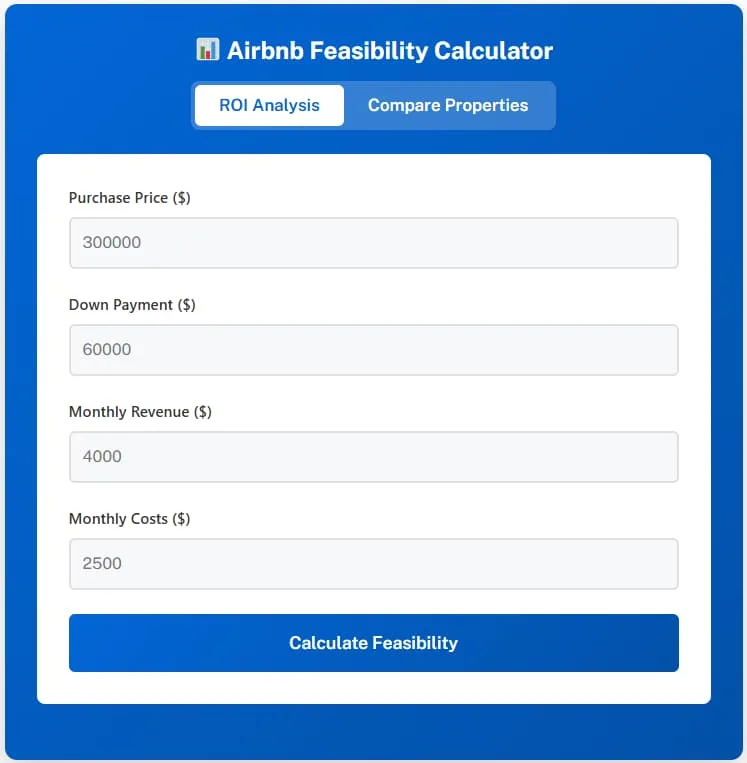
Now that your airbnb revenue calculator has churned out the numbers, it is time to interpret the results. These metrics are not just abstract math; they are the go/no-go signals for your investment. You need to look beyond the top-line revenue estimate and focus on the bottom line to see if the property actually works for your budget.
Read the Cap Rate
The capitalization rate, or Cap Rate, tells you the expected annual return on a property if you bought it outright with cash. Think of it as the property’s yield. A higher Cap Rate generally means higher potential return, but it also often signals higher risk or a less desirable location.
Most successful short-term rental investors look for a Cap Rate between 6% and 10%. If your calculator shows a number below 5%, the property might struggle to cover your mortgage and operating costs comfortably. If it is above 10%, ask yourself why the market is pricing it so low. Is there a hidden risk, or is it simply a great deal?
Check the DSCR for Debt Safety
The Debt Service Coverage Ratio (DSCR) is arguably the most critical number for lenders and savvy investors. It measures your property’s cash flow against its mortgage payments. A DSCR of 1.0 means your income exactly covers your debt. Anything below 1.0 means you are losing money every month from the rental.
Most banks require a DSCR of at least 1.2 or 1.25 to approve a loan. This buffer ensures you have enough cash left over for repairs, vacancies, and management fees. If your airbnb revenue calculator shows a DSCR below 1.2, the property is financially fragile. Even a small dip in occupancy could leave you paying out of pocket.
Understand Your ROI
Return on Investment (ROI) looks at your total return relative to your initial cash outlay, including down payment, closing costs, and furnishing. This is your actual profit percentage. While Cap Rate focuses on net operating income, ROI accounts for the leverage you are using.
If you put 20% down, your ROI will be higher than the Cap Rate because you are controlling the asset with less cash. However, this also amplifies your risk. A strong ROI might look like 15-20% annually, but remember that these projections assume steady occupancy and stable ADR. Always build in a margin of safety for unexpected expenses.
Stress-Test Your Assumptions
Calculator projections are based on current market data, but markets shift. Use the tool to run "what-if" scenarios. What happens if occupancy drops from 70% to 60%? What if your Average Daily Rate (ADR) falls by 10% due to increased competition?
A good airbnb revenue calculator lets you adjust these variables. If the deal still works under conservative estimates, it is a strong candidate. If the numbers turn red with a slight market dip, walk away. Protect your capital by ensuring the investment holds up when things do not go perfectly.
Validate results with market comparables
An airbnb revenue calculator provides a baseline, but it relies on generalized data that may not reflect your specific street or building. To avoid over-optimistic projections, you need to cross-reference those outputs with actual listing data from the local market.
Start by identifying five to ten active listings in your immediate vicinity that match your property’s size, amenities, and view. Look for listings with consistent occupancy rates and similar seasonal patterns. Compare their Average Daily Rate (ADR) and occupancy percentages against what your calculator predicted. If the calculator suggests an 80% occupancy rate but the top competitors in your area are averaging 60%, adjust your expectations downward.
Next, check for seasonal fluctuations that the calculator might smooth over. Many tools provide annual averages, but your property might have distinct high and low seasons. For example, if your calculator assumes a steady 70% occupancy year-round, but local data shows a 40% drop in winter, your actual annual revenue will be significantly lower.
Finally, review recent price changes on comparable listings. If competitors have lowered their rates to attract bookings, your projected ADR may be inflated. Use this data to refine your assumptions, ensuring your airbnb revenue calculator reflects the true competitive landscape rather than theoretical ideals.
Common calculation errors to avoid
An Airbnb revenue calculator is only as good as the numbers you feed it. Many hosts fall into the trap of treating the tool as a crystal ball rather than a model dependent on input quality. Small deviations in your assumptions can compound into large swings in projected profit, turning a promising deal into a money loser.
The most frequent mistake is assuming a 100% occupancy rate. Real-world performance rarely hits double digits every month. A more realistic approach is to start with your local area’s average and then apply a discount for seasonality. For example, if the local average is 75%, modeling 90% will almost certainly lead to disappointment. Similarly, underestimating maintenance and cleaning costs is common. These operational expenses are not optional; they are the cost of keeping your listing competitive and your reviews high.
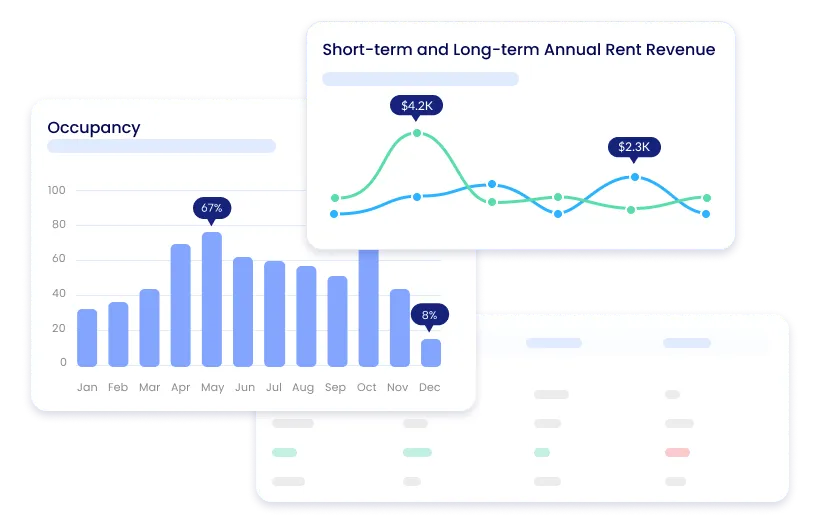
Another subtle error is ignoring the impact of dynamic pricing on your Average Daily Rate (ADR). A static ADR input fails to capture the value of weekend premiums or holiday spikes. Use the calculator to run scenarios with variable rates rather than a single flat number. Finally, many hosts overlook platform fees and local taxes. These costs are fixed percentages that eat directly into your net operating income. Ensuring your Airbnb revenue calculator includes these deductions gives you a true picture of your cash flow potential.
Frequently asked questions about Airbnb calculators
Is the data from an Airbnb revenue calculator accurate?
Calculators provide estimates based on historical trends and comparable properties, not guarantees. Tools like AirDNA pull from real short-term rental comp data, while others like AirROI analyze thousands of listings. Treat these figures as a directional guide for your market, not a fixed promise of income.
How do I choose the right tool for my needs?
Look for calculators that offer more than just gross revenue. The best tools break down occupancy rates, Average Daily Rate (ADR), and net operating expenses. You need a platform that calculates key metrics like Cap Rate and DSCR to understand the true financial health of the property.
What is Cap Rate and why does it matter?
Cap Rate (Capitalization Rate) measures the potential return on an investment property. It’s calculated by dividing the Net Operating Income by the current market value. A higher cap rate generally indicates a higher potential return, helping you compare this Airbnb against other investment opportunities.
No comments yet. Be the first to share your thoughts!