
Why accurate revenue estimates matter
Buying a short-term rental is a high-stakes financial commitment. Unlike a traditional long-term lease, your income fluctuates with seasons, local events, and shifting travel trends. If you rely on rough guesses or optimistic "what-if" scenarios, you risk buying a property that looks good on paper but bleeds cash in reality.
Precise revenue projections act as your financial shock absorber. They help you determine if the property can cover its mortgage, taxes, insurance, and maintenance while still generating profit. Without this clarity, you might overpay for the asset or underestimate the operational costs that eat into your bottom line.
To get these numbers right, you need data, not intuition. Tools like the AirDNA Rentalizer analyze real short-term rental comparable data to project revenue, average daily rates (ADR), and occupancy for specific addresses. This moves the conversation from "I hope it makes money" to "Here is exactly what the market says it will make."
This volatility index chart illustrates why stability matters. While VIX tracks market fear, your STR investment faces its own version of uncertainty. Accurate calculators help you see past the noise and focus on the hard numbers that determine whether your investment survives or thrives.
How Airbnb revenue calculators work
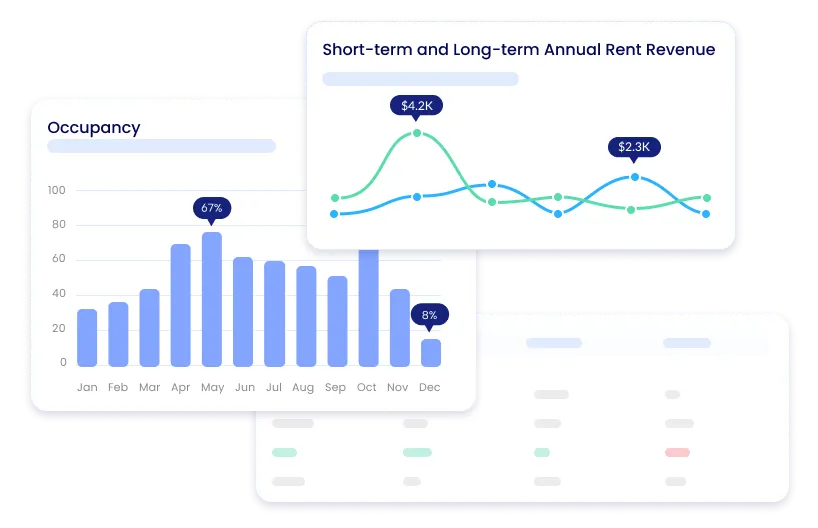
At their core, Airbnb revenue calculators are sophisticated estimation engines. They take your specific property details and cross-reference them with real-time local market data to project what your rental income might look like. Think of it as a financial weather forecast: it uses current atmospheric conditions—occupancy trends, seasonal demand, and competitor pricing—to predict your cash flow for the coming year.
These tools rely on three primary inputs to build their projections. First, they analyze the Average Daily Rate (ADR) for comparable properties in your neighborhood. Second, they estimate occupancy rates based on historical booking patterns and current market saturation. Finally, they factor in local regulations and seasonality, which can drastically shift your income potential from month to month. By combining these variables, the calculator generates a gross revenue estimate before expenses.
The quality of these projections depends heavily on the data source. Reputable calculators like Rabbu and BNBCalc update their market data weekly to reflect real-time changes in the short-term rental landscape. This ensures that your analysis isn't based on stale information from last year. For investors, this distinction is critical; relying on outdated data can lead to overestimating income and underestimating the risk of vacancy.
While these tools provide a strong baseline, they are estimates, not guarantees. They offer a data-driven starting point for your due diligence, helping you identify properties with genuine revenue potential before you commit capital. Use them to filter out underperforming markets and focus your search on areas with strong, consistent demand.
Top tools for short term rental analysis
Picking the wrong calculator is like buying a map drawn in 2015. It looks right at a glance, but the roads have changed. For high-stakes property investments, your revenue projections need to reflect current market realities, not stale averages. We are looking at tools that pull from live, verified short-term rental (STR) data to give you a realistic picture of potential cash flow.
The market leaders—AirDNA, Rabbu, BNBCalc, and AirROI—each approach data differently. Some focus on granular neighborhood comps, while others offer broader global insights. Below is a side-by-side comparison of their core strengths to help you decide which engine fits your strategy.
| Tool | Data Focus | Cost | Best For |
|---|---|---|---|
| AirDNA | Market-wide comp data & trends | Free calculator; paid reports | Deep market research |
| Rabbu | Weekly-updated U.S. STR data | Free | Quick U.S. income estimates |
| BNBCalc | U.S. property-specific projections | Free basic; paid advanced | Detailed U.S. cash flow |
| AirROI | Global data (190+ countries) | Free estimates | International property analysis |
Using data to validate investment ROI
Calculator outputs are projections, not guarantees. Treat them as a stress test for your capital rather than a promise of income. If the numbers feel good, check the assumptions behind them. A 70% occupancy rate looks great on paper until you account for seasonal slumps or local regulatory changes.
The most common mistake is overestimating revenue while underestimating expenses. Most free calculators ask for your average daily rate and occupancy, but they often miss the hidden costs of short-term rentals. You need to subtract property management fees, cleaning costs, utilities, and platform commissions from the gross revenue before celebrating.
To validate your ROI, compare your calculated projections against real market data. Tools like AirDNA provide neighborhood-level benchmarks for occupancy and average daily rates. If your target property’s projected revenue exceeds the local average by more than 15%, you need a strong reason why—such as superior amenities or prime location. Otherwise, your numbers are likely too aggressive.
Remember that your mortgage payment is the biggest fixed cost. If your net operating income (NOI) is barely above your debt service, you have no margin for error. A healthy investment should show a positive cash flow even if occupancy drops by 10-20%. This buffer protects you during unexpected repairs or market downturns.
Common questions about STR revenue tools
Short-term rental investing carries real financial stakes, so understanding how these tools work is essential for accurate underwriting. Here are answers to the most common questions hosts and investors ask about Airbnb revenue calculators and market alternatives.
No comments yet. Be the first to share your thoughts!