
Occupancy fell: Q1 2026 data
Airbnb occupancy rates dropped 12% in the first quarter of 2026, according to AirDNA. This is the first major slide we've seen since the post-pandemic travel boom ended. For hosts, it means the days of easy bookings are over.
To put that into perspective, Q1 2025 saw an average occupancy rate of 68%. This year, we’re looking at 60%. Historically, Q1 has been a shoulder season, typically averaging around 62% occupancy, but this year’s numbers fall well below even those expectations. This decline isn’t uniform, though – some markets are feeling the pinch much more acutely than others.
Airbtics is confirming this downward trend, reporting similar decreases across tracked markets. The data suggests a cooling effect after a period of rapid expansion in the short-term rental sector. We're seeing a return to more typical seasonal fluctuations, but even accounting for that, the numbers are concerning. This isn't just a slowdown; it’s a correction.
Major markets hit hardest
The occupancy decline isn’t spread evenly across the country. Several major markets experienced particularly steep drops in Q1 2026. Orlando, Florida, a perennial favorite for vacation rentals, saw a 15% decrease in occupancy, landing at 55%. Las Vegas followed closely with a 14% decline, dropping to 60%.
Other hard-hit cities include Miami (down 13%), Nashville (down 12%), and Phoenix (down 11%). Interestingly, some areas have remained relatively stable. Smaller beach towns along the North Carolina coast, for example, saw only a 3-5% decline. Rural destinations in Montana and Wyoming also demonstrated resilience.
Here’s a quick look at the top and bottom performers:
- Most Affected:
- Orlando, FL: -15%
- Las Vegas, NV: -14%
- Miami, FL: -13%
- Nashville, TN: -12%
- Phoenix, AZ: -11%
- Least Affected:
- Outer Banks, NC: -3%
- Whitefish, MT: -4%
- Jackson, WY: -5%
- Hilton Head, SC: -5%
- Sanibel Island, FL: -6%
Q1 Occupancy Rate Changes: Top Airbnb Markets (2025 vs. 2026)
| Market (City, State) | Q1 2025 Occupancy Rate | Q1 2026 Occupancy Rate | Change (%) | Trend |
|---|---|---|---|---|
| Orlando, FL | 78.5% | 69.2% | -11.8% | Down 📉 |
| Miami, FL | 72.3% | 64.1% | -11.3% | Down 📉 |
| Nashville, TN | 68.9% | 61.5% | -10.7% | Down 📉 |
| Phoenix, AZ | 75.1% | 67.8% | -9.7% | Down 📉 |
| Las Vegas, NV | 81.2% | 74.5% | -8.2% | Down 📉 |
| New Orleans, LA | 70.4% | 65.3% | -7.2% | Down 📉 |
| Austin, TX | 65.7% | 61.8% | -5.9% | Down 📉 |
| Savannah, GA | 74.8% | 72.1% | -3.6% | Down 📉 |
Illustrative comparison based on the article research brief. Verify current pricing, limits, and product details in the official docs before relying on it.
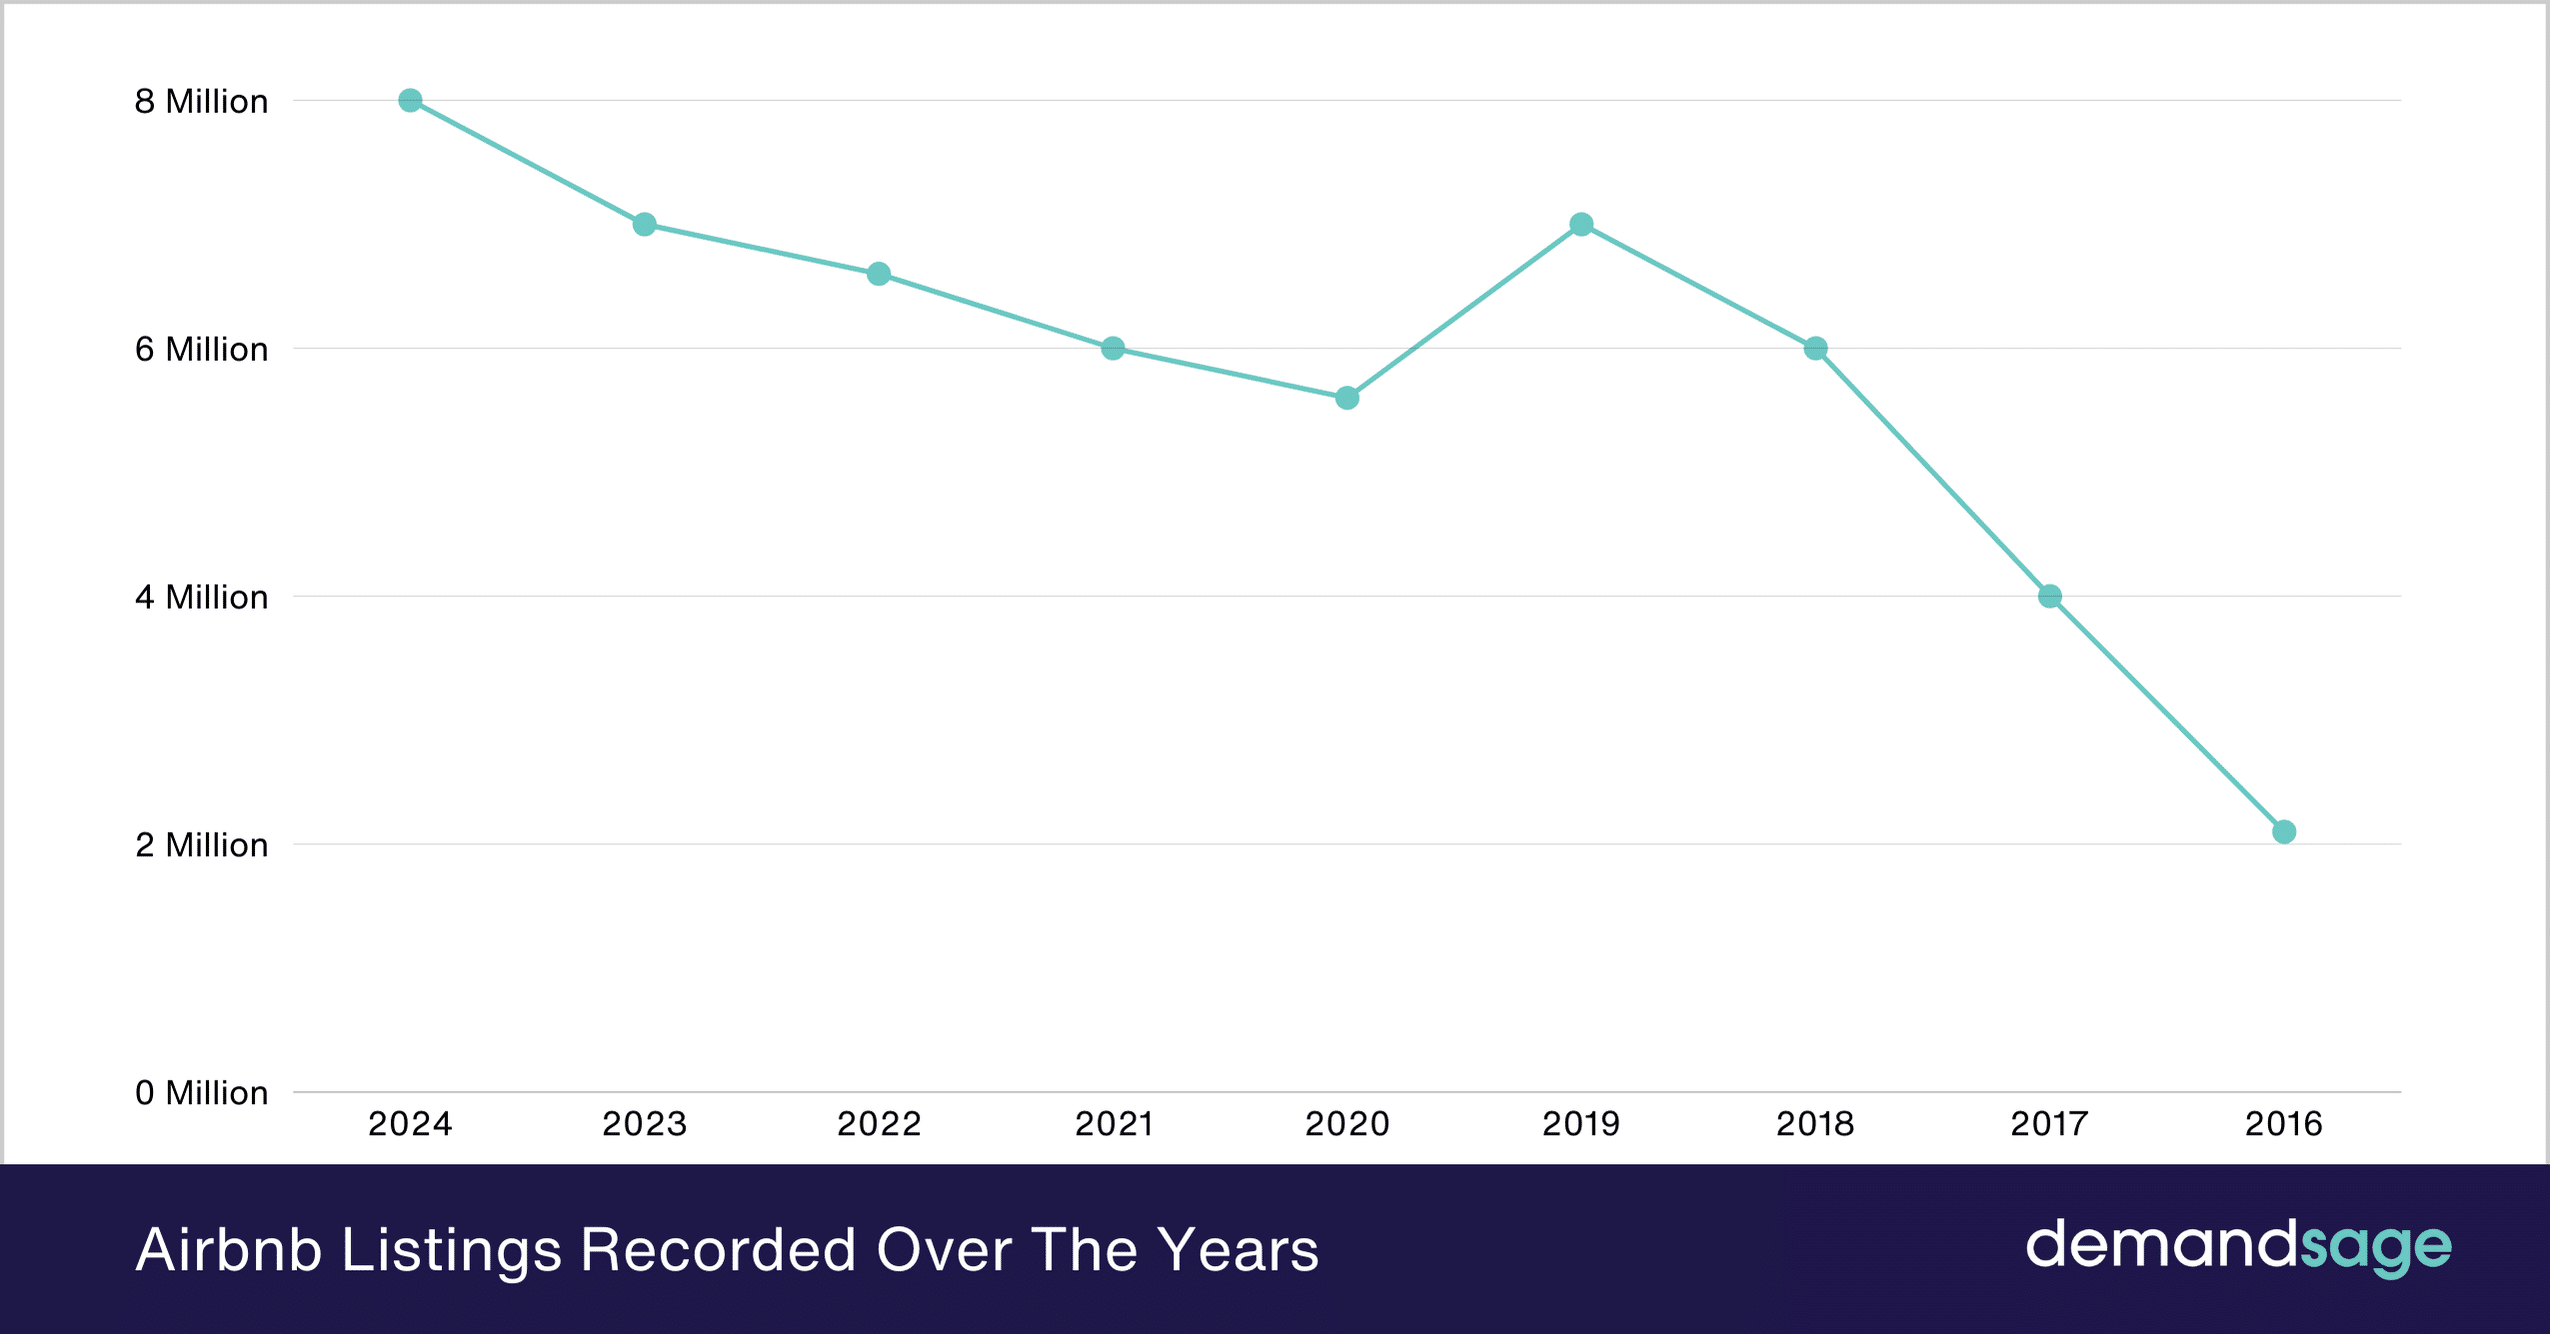
The supply surge: more listings than ever
A significant factor contributing to the occupancy drop is a surge in the supply of Airbnb listings. AirDNA reports a 7% increase in active rentals across the US in the past year. This is a substantial increase, and it’s putting downward pressure on occupancy rates. More properties are competing for the same pool of travelers.
The markets that experienced the largest occupancy declines also saw the biggest increases in listings. Orlando, for instance, added over 5,000 new Airbnb properties in the last 12 months. Las Vegas added nearly 4,000. This correlation is undeniable. The rapid expansion of the short-term rental market is now working against itself.
It’s not just the total number of listings, but also the type of properties. We’re seeing a proliferation of investor-owned properties specifically designed for short-term rentals, further saturating the market. This is particularly evident in areas like Orlando and Phoenix.
Where travelers are going instead
While increased supply is a major factor, shifts in traveler demand are also playing a role. Rabbu.com data suggests a growing preference for hotel stays, particularly among business travelers. Hotels are actively courting this segment with loyalty programs and enhanced amenities.
There's also evidence of a shift towards longer-term rentals. With economic uncertainty looming, some travelers are opting for the stability of a six-month or year-long lease rather than the flexibility of short-term rentals. This trend is particularly noticeable in cities with large student populations or a transient workforce.
Economic factors are undoubtedly influencing travel patterns. Inflation and recession fears are causing some consumers to cut back on discretionary spending, including vacations. While travel hasn’t stopped, people are being more selective about where they go and how they spend their money. We’re also seeing a trend towards more budget-conscious travel, with travelers seeking out more affordable destinations and accommodations.
Pricing Pressure: Hosts Are Reacting
Faced with declining occupancy, hosts are starting to react by lowering their prices. Average daily rates (ADR) have decreased by approximately 5% across the board in the affected markets. This is creating a race to the bottom, as hosts compete for a shrinking pool of guests.
Discounts are becoming increasingly common. Many hosts are offering last-minute deals and extended-stay discounts to fill vacancies. This is eroding profit margins and putting financial strain on property owners. The competitive pressure is intense.
We built BNB Stats to help you track what neighbors are charging in real-time. You can use it to adjust your rates based on actual local demand rather than guessing. Knowing your local market is the only way to keep your revenue from bottoming out.
Beyond the Headlines: Property Type Impacts
The occupancy decline isn’t uniform across all property types. Entire homes are experiencing a steeper drop in occupancy compared to private rooms. This suggests that travelers are becoming more price-sensitive and are opting for more affordable options.
Luxury rentals are also struggling more than budget-friendly properties. Demand for high-end accommodations has softened as economic uncertainty increases. Travelers are prioritizing value and are willing to compromise on amenities to save money.
Conversely, properties that cater to specific niches – such as family-friendly rentals with multiple bedrooms or pet-friendly rentals – are holding up relatively well. Focusing on a specific target market can help hosts differentiate themselves and attract a loyal customer base.
Strategies for Boosting Occupancy Now
So, what can hosts do to combat this downturn? First and foremost, focus on improving your listing quality. High-quality photos, detailed descriptions, and accurate amenities lists are essential for attracting guests. Make sure your listing stands out from the competition. Professional photography is a worthwhile investment.
Offer flexible cancellation policies. Travelers are increasingly looking for peace of mind, and a flexible cancellation policy can be a major selling point. Consider offering a full refund up to 24 or 48 hours before check-in. Run targeted promotions and discounts, but be strategic about it. Avoid deep discounts that erode your profit margins. Focus on offering value-added incentives, such as complimentary breakfast or a welcome gift.
Prioritize the guest experience. Positive reviews are crucial for attracting new bookings. Go above and beyond to ensure your guests have a memorable stay. Respond promptly to inquiries, provide helpful local recommendations, and address any concerns immediately. BNB Stats can help you monitor guest reviews and identify areas for improvement.
Consider offering unique experiences or add-ons. Partner with local businesses to offer discounts on tours, activities, or dining. This can add value for your guests and differentiate your property from the competition.
- Hire a professional photographer
- 📸 Professional Photos
- Switch to a 24-hour cancellation window
- ✅ Flexible Cancellation Policy
- 💰 Targeted Promotions
- ⭐ Exceptional Guest Experience

No comments yet. Be the first to share your thoughts!