
Occupancy Recovery Trends
Short-term rental markets in 2026 are defined by a sustained recovery in occupancy rates, a shift that has reignited investor interest across major travel hubs. After the volatility of the post-pandemic years, the industry has moved past the initial surge of remote-work-driven travel and settled into a stable, high-demand equilibrium. This normalization is not a temporary spike but a structural change in how travelers book accommodations, with leisure and hybrid travel volumes consistently outpacing pre-2019 benchmarks.
The primary driver for this renewed confidence is the reliability of occupancy data. Investors are no longer betting on speculative growth; they are capitalizing on proven, consistent demand. National averages for short-term rental occupancy have stabilized at levels that support healthy cash flows, reducing the risk profile for new entries into the market. Properties that were previously undervalued due to market uncertainty are now being re-evaluated based on their ability to maintain high booking rates year-round.
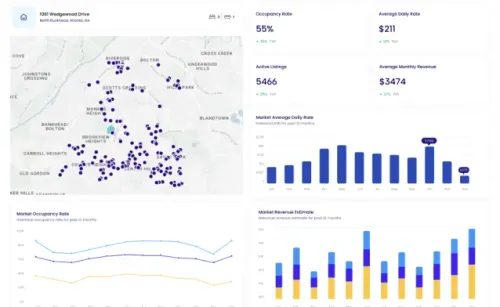
To understand the current trajectory, it is essential to look at the raw performance metrics rather than broad economic indicators. The following chart illustrates the national average occupancy rates over the last 24 months, highlighting the clear upward trend that has characterized the market into 2026. This data, sourced from industry-standard analytics platforms, shows a consistent climb that suggests the market has found its footing.
Adjusting ROI for Current Markets
The Airbnb investment landscape has shifted. While occupancy rates in many markets remain robust, Average Daily Rates (ADR) have stabilized or declined from their pandemic-era peaks. Investors relying on pre-2023 growth assumptions often overestimate cash flow because they fail to account for this rate compression.
A realistic ROI calculation now requires a more conservative approach to nightly pricing. Instead of projecting maximum historical rates, model your income using current market averages. This adjustment is critical because higher occupancy rarely compensates fully for lower nightly prices. The margin for error has narrowed, making precise input data essential.
Using historical peak occupancy data will overstate projected cash flow in the current market cycle.
To build an accurate model, you must integrate real-time market analytics. Tools like AirROI and Airbtics provide the necessary granular data to replace generic estimates. These platforms offer dynamic pricing insights and historical datasets that reflect actual demand patterns rather than idealized scenarios.
When inputting these figures into your rental property ROI calculator, prioritize consistency. Use the same date ranges and market definitions across all metrics. This ensures that your occupancy and nightly rate inputs are directly comparable, allowing you to calculate a true net operating income (NOI) that reflects the current financial reality of short-term rentals.
Compare Top Analytics Tools
Choosing the right platform depends on your specific data needs, budget, and technical requirements. The following comparison focuses on three leading tools for tracking Airbnb market data: AirDNA, Rabbu, and Airbtics. Each offers distinct advantages for investors evaluating occupancy rates, average daily rates (ADR), and return on investment (ROI).
AirDNA remains the industry standard for comprehensive market intelligence, offering extensive historical data and broad coverage across 120,000+ markets. Rabbu provides a strong free-tier alternative with real-time metrics, ideal for investors seeking immediate insights without upfront costs. Airbtics distinguishes itself with a robust API and a three-year historical dataset, catering to users who require programmable access to dynamic data for custom analysis.
The table below outlines the core differences in data depth, pricing models, and API availability to help you select the tool that best fits your research workflow.
| Tool | Data Depth | Cost | API Access |
|---|---|---|---|
| AirDNA | High (3+ years) | Subscription | Limited |
| Rabbu | Medium (Real-time) | Free Tier | None |
| Airbtics | High (3+ years) | Subscription | Full |
For investors prioritizing deep historical trends and market-wide benchmarks, AirDNA offers the most mature ecosystem. However, for those focused on real-time occupancy shifts and budget constraints, Rabbu’s free access provides sufficient granularity for initial screening. If your strategy relies on automated data integration or custom algorithmic modeling, Airbtics’ API-first approach ensures the data can be pulled directly into your financial models.
When evaluating these platforms, verify that the metrics provided align with your specific investment criteria. Look for tools that allow you to filter by neighborhood, property type, and seasonality, as these factors significantly impact occupancy and revenue projections in 2026.
Investment Heuristics for 2026
Successful short-term rental investing in 2026 relies on strict financial filters rather than intuition. Investors use specific rules to screen properties, ensuring the asset can withstand market volatility and generate positive cash flow from day one. These heuristics focus on two primary metrics: occupancy rates and average daily rates (ADR).
The 75-55 Rule
The most common screening tool is the 75-55 rule. This benchmark suggests a property is viable only if it achieves at least 75% occupancy at a nightly rate of no less than 55% of the local market average. This approach protects investors from overpaying for locations with high demand but low pricing power. If a property requires hitting the full market ADR to reach break-even, it carries too much risk in a shifting market.
The 80/20 Efficiency Focus
Operational efficiency follows the 80/20 principle. Eighty percent of your rental success comes from twenty percent of your efforts. In practice, this means prioritizing professional photography, responsive guest communication, and strategic dynamic pricing over minor cosmetic upgrades. These high-impact activities drive the occupancy and ADR needed to satisfy the 75-55 rule.
Market Context and Tracking
Tracking these metrics requires real-time data. Static market reports become obsolete quickly. Use provider-backed tools to monitor current ADR trends and occupancy shifts in your target neighborhood. This data allows you to adjust pricing strategies dynamically, ensuring you remain competitive without sacrificing revenue.
No comments yet. Be the first to share your thoughts!