
Why Airbnb market data matters
Short-term rental investing is a high-stakes game where intuition is a liability. Without precise market data, you are essentially gambling on occupancy rates and nightly rates that may not exist in your target area. Raw numbers don't lie, but they can be misleading if you don't know which metrics actually drive ROI.
AirDNA tracks over 10 million rentals across 120,000 markets, providing the granular data needed to separate viable investments from money pits. Their platform, trusted by more than 1.3 million users, offers the historical context necessary to forecast performance accurately. Relying on anecdotal evidence or outdated reports is a fast track to underperforming assets.
The difference between a profitable property and a loss leader often comes down to understanding seasonal fluctuations and local regulatory impacts. Data tools allow you to stress-test your assumptions before signing a lease or buying a property. This level of due diligence is not optional; it is the foundation of sustainable STR investing.
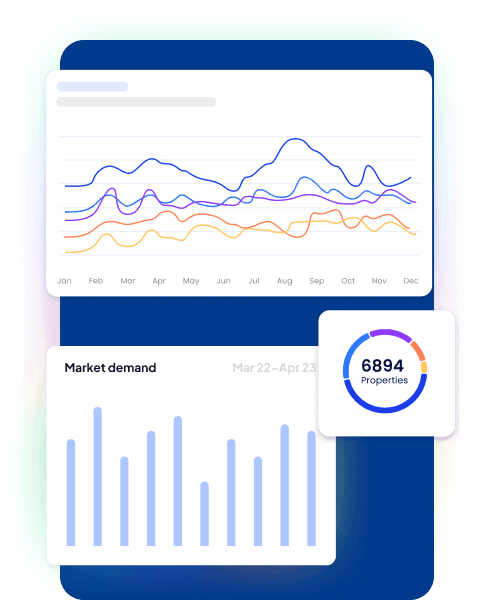
Note: The chart above illustrates the importance of analyzing historical trends. For STR-specific occupancy trends, consult specialized platforms like AirDNA.
AirDNA market intelligence
AirDNA stands as the industry standard for short-term rental market data, tracking over 10 million listings across 120,000 global markets. Since its launch in 2015, it has become the primary data source for investors, hosts, and property managers seeking to understand occupancy trends and revenue potential. Its depth of historical data allows for precise forecasting, making it indispensable for high-stakes investment decisions where accuracy directly impacts returns.
The platform’s core strength lies in its granular neighborhood-level insights. Unlike broader aggregators, AirDNA provides specific metrics on daily rates, occupancy percentages, and seasonal demand patterns for individual zip codes. This level of detail enables investors to identify undervalued markets or spot saturation before entering a new area. The data is continuously updated, ensuring that projections reflect current market dynamics rather than lagging indicators.
While AirDNA offers a free tier for basic exploration, its paid plans unlock comprehensive analytics including competitor analysis and forecasted revenue models. For serious investors, the subscription cost is justified by the ability to validate deals with robust statistical backing. The platform’s trust is reflected in its user base, which includes over 1.3 million active users relying on its data for daily operational and strategic decisions.
| Feature | AirDNA | Mashvisor | AllThePlaces |
|---|---|---|---|
| Data Coverage | 10M+ listings, 120K markets | 5M+ listings, 100K+ markets | Limited, manual updates |
| Forecasting | 12-month revenue/occupancy | 72-hour to 12-month | None |
| Neighborhood Depth | Zip code to block level | Zip code to street level | City level |
| Historical Data | Back to 2015 | Back to 2018 | Limited |
| Free Tier | Basic search & stats | Limited search | None |
AirROI for API and developers
AirROI distinguishes itself in the Airbnb market data landscape by prioritizing raw data access and robust API capabilities. While many platforms package insights into user-friendly dashboards, AirROI is built for developers and analysts who require direct access to the underlying data structures. This approach supports custom analysis, automated reporting, and integration into proprietary workflows where off-the-shelf tools fall short.
The platform tracks over 20 million properties globally, providing a comprehensive dataset for short-term rental markets. Its API allows users to pull detailed metrics on occupancy, revenue, and pricing trends. This level of granularity is essential for building custom models or integrating market data into existing property management systems. The service is designed to handle high-volume requests, ensuring that developers can scale their data operations without hitting artificial limits.
For teams requiring precise, unfiltered data, AirROI offers a free tier that includes market analytics and revenue estimates. This accessibility lowers the barrier to entry for smaller operations or individual investors who need reliable data without significant upfront costs. The API documentation is extensive, providing clear endpoints for retrieving property-specific and market-wide statistics. This transparency allows developers to build custom visualizations or alerts that align with their specific investment criteria.
The tool’s strength lies in its flexibility. Instead of forcing users into a predefined reporting structure, AirROI provides the building blocks for custom solutions. This is particularly valuable for analysts who need to combine Airbnb data with other sources, such as local zoning laws or historical sales records. By offering raw data access, AirROI empowers users to create tailored insights that reflect their unique market conditions and investment strategies.
Airbtics for neighborhood insights
Airbtics shifts the focus from broad market trends to hyper-local yield potential. By analyzing data at the neighborhood level, the platform helps investors identify specific micro-markets where short-term rental demand outpaces supply. This granularity is essential for finding undervalued areas before they become saturated.
The platform provides a three-year historical dataset updated daily, allowing users to track seasonal fluctuations and long-term growth patterns. Investors can filter by key metrics such as occupancy rates, average daily rates, and revenue potential to pinpoint locations with consistent cash flow. This historical context reduces the risk of entering a market that is peaking or declining.
Airbtics also integrates with major listing platforms to pull real-time performance data. This direct integration ensures that the insights are based on actual market activity rather than estimates. For investors prioritizing data accuracy, this feature provides a reliable foundation for making high-stakes acquisition decisions.
Property-Level ROI Analysis
Mashvisor distinguishes itself by shifting the focus from broad market trends to granular property-level data. While many platforms provide neighborhood averages, Mashvisor requires you to input a specific address to generate a detailed financial projection. This approach is essential for investors evaluating rental arbitrage or individual acquisitions, where aggregate data often masks local nuances.
The platform integrates real-time occupancy rates and average daily rates (ADR) directly into its return on investment (ROI) calculations. By analyzing comparable short-term rental performance for a specific unit, investors can estimate cash flow with greater precision. This method helps identify high-yield opportunities that might be overlooked in broader market summaries.
For those considering rental arbitrage, the tool highlights properties where the gap between long-term lease costs and short-term rental revenue is widest. This feature allows investors to quickly assess the viability of leasing a property to sublet on Airbnb without owning the asset outright. The ability to model these scenarios against current market rates reduces the risk of overpaying for leases.
Pricing for Mashvisor varies based on the depth of data required, with plans ranging from basic market insights to comprehensive property analytics. Users should review the current tier structure to determine which level of data access aligns with their investment strategy. Understanding these costs upfront ensures that the tool remains a cost-effective component of your due diligence process.
Inside Airbnb for free data
Inside Airbnb remains the most reliable source for raw, downloadable market data. Unlike paid platforms that aggregate or smooth figures, this tool provides the unfiltered quarterly snapshots that professional analysts require for manual modeling.
The site offers direct access to regional archive files. You can download comprehensive datasets covering listings, availability, and pricing trends for cities worldwide. This granularity allows you to build custom models without relying on third-party estimations.
While the interface lacks the polished dashboards of commercial software, the data integrity is unmatched for serious due diligence. It serves as the foundational layer for any rigorous short-term rental market analysis.
For direct access to these quarterly datasets, visit Inside Airbnb’s data page.
Choosing the right analytics tool
Selecting a short-term rental analytics platform requires matching your specific operational role to the data depth provided. Investors, hosts, and developers face different risks, and using a tool designed for the wrong stakeholder leads to mispriced assets or missed revenue opportunities.
For Investors: The priority is accurate revenue estimation and market saturation analysis. You need historical data to model cash flow and identify emerging markets before prices spike. Platforms like AirDNA or Airbtics provide the 3-year historical datasets necessary for reliable underwriting.
For Hosts: Daily revenue optimization and dynamic pricing are essential. Hosts need real-time competitive analysis to adjust rates based on local demand, events, and seasonality. Tools like AirROI offer free market analytics and API access to automate pricing strategies.
For Developers: API access and data granularity are non-negotiable. Developers building custom dashboards or integrations require structured data feeds. Ensure the tool provides comprehensive API documentation and supports the specific metrics your application needs to function.
Choosing the right tool reduces the risk of overpaying for features you don't need or underestimating market potential. Evaluate each platform against your specific workflow before committing to a subscription.
No comments yet. Be the first to share your thoughts!