
The remote work reset
The initial surge of remote work in 2020 fundamentally reshaped travel patterns, creating a boom for short-term rentals. Early data from AirDNA showed a significant increase in stays exceeding 28 days as people embraced the "work from anywhere’ lifestyle. However, this initial wave was unique. It wasn"t simply leisure travel rebounding; it was a new category of long-term, remote-work-driven demand.
The pendulum is swinging back. Offices are calling people back, and living out of a suitcase for months has lost its charm for most. AirDNA shows ultra-long stays are dropping. Instead, people are taking more frequent trips between two and seven nights.
This isn't a return to pre-pandemic norms. People have tasted the freedom of blending work and travel, and they’re actively seeking ways to integrate it into their lives. They may not be able to work remotely full-time, but they can add a few days to a business trip or take more frequent weekend getaways. This change in travel behavior is a key driver of the opportunity we’re seeing in the short-term rental market.
The data confirms this. AirDNA reports a 15% increase in bookings under 5 nights in Q1 2024 compared to the same period in 2023. This indicates a preference for shorter, more spontaneous trips, driven by a desire for experiences and a re-evaluation of work-life balance. This is a very different traveler than the one we saw in 2020.
Why 2026 is the target
The convergence of several factors makes 2026 a particularly promising year for short-term rental investment. It isn’t a random prediction; it’s rooted in the anticipated maturation of post-pandemic trends and economic stabilization. Return-to-office policies, while varied, are becoming increasingly solidified, creating a new normal that still prioritizes flexibility but acknowledges the benefits of in-person collaboration.
We're seeing a lag effect. The initial disruption caused by remote work has subsided, and people are now adjusting to a hybrid model. This adjustment period, culminating around 2026, will see a surge in demand for travel as individuals seek to maximize their limited vacation time and incorporate "bleisure" trips into their schedules.
AirDNA data on booking windows supports this. Forward bookings – reservations made 60-90 days in advance – are increasing at a faster rate now than they were in 2023, suggesting a growing confidence in travel planning. This indicates that people are not only wanting to travel, but they are also committing to it further in advance.
The stabilization of the economy, assuming current projections hold, will also play a crucial role. While inflation remains a concern, a potential easing of economic pressures in 2026 will free up disposable income for travel. This, combined with the pent-up demand from the past few years, will create a perfect storm for the short-term rental market. It’s about people optimizing for experiences, not just escaping remote work – they are actively choosing to travel more.
The rise of 'bleisure' trips
The "bleisure’ trend – blending business and leisure travel – is evolving beyond simply tacking a weekend onto a business trip. It"s about intentionally extending trips, bringing families along, and selecting destinations that cater to both work and relaxation. This shift is significantly impacting the types of properties in demand and the amenities travelers prioritize.
Mashvisor data reveals a strong correlation between cities with robust tech industries and high short-term rental occupancy rates. Cities like Austin, Denver, and Raleigh consistently rank high in both categories, indicating a concentration of business travelers who also seek leisure activities. This suggests a lucrative opportunity for investors in these markets.
The ideal "bleisure’ property isn’t just a place to sleep. It"s a functional workspace with reliable high-speed internet, comfortable seating, and adequate lighting. Families require space and amenities like fully equipped kitchens, laundry facilities, and access to family-friendly activities. Locations near co-working spaces, coffee shops, and restaurants are also highly desirable.
We’re seeing a premium placed on properties that facilitate seamless transitions between work and leisure. According to Rabbu.com, listings that specifically highlight workspace amenities experience a 10-15% increase in booking rates. This highlights the importance of accurately representing a property’s features and catering to the needs of the modern "bleisure" traveler.
Short-Term Rental Investment Potential: Key City Comparison (Q4 2023 Data)
| City | Tech Industry Presence | Tourist Attractions | Average Internet Speed (Mbps) | STR Occupancy Rate | Potential for Bleisure Travel |
|---|---|---|---|---|---|
| Austin, TX | High | Significant | 88.2 | 68.2% | High Potential |
| Nashville, TN | Growing | High | 75.9 | 65.5% | Moderate Potential |
| Miami, FL | Moderate | Very High | 95.1 | 71.8% | High Potential |
| Denver, CO | High | Moderate | 92.7 | 62.3% | Moderate Potential |
| Phoenix, AZ | Moderate | Moderate | 70.3 | 60.1% | Moderate Potential |
| Atlanta, GA | High | Moderate | 80.5 | 63.9% | Moderate Potential |
| Raleigh-Durham, NC | High | Moderate | 85.6 | 66.7% | Moderate Potential |
| Las Vegas, NV | Moderate | Very High | 82.1 | 75.4% | High Potential |
Illustrative comparison based on the article research brief. Verify current pricing, limits, and product details in the official docs before relying on it.
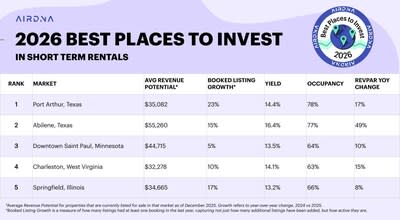
Market Hotspots: Where to Invest Now
While established markets like Miami and New York continue to perform well, the greatest potential for growth lies in secondary markets – those that haven’t been fully saturated by short-term rentals. These markets often offer a unique combination of affordability, attractions, and a favorable regulatory environment. We need to look beyond the headlines and identify emerging opportunities.
Cities like Chattanooga, Tennessee, and Greenville, South Carolina, are experiencing a surge in tourism and a growing demand for short-term rentals. AirDNA data shows that occupancy rates in these markets have increased by 20-25% year-over-year, while average daily rates remain competitive. These cities offer a compelling value proposition for both travelers and investors.
Consider also Asheville, North Carolina, with its vibrant arts scene, outdoor recreation opportunities, and growing culinary scene. Mashvisor identifies Asheville as a top market for cash flow, with a median cash-on-cash return of 8-10%. This makes it an attractive option for investors seeking passive income.
Do your homework on local laws. A market that looks great on paper can turn into a headache if the city council passes a sudden ban on unhosted rentals. Boise is a good example—it was the darling of the industry until competition spiked and the city tightened the screws on permits.
Short-Term Rental Investment Markets: Hotspot vs Saturated Cities Analysis
Average property acquisition costs and investment metrics for vacation rental properties - Q4 2024
| Asset | Current Price | 24h | 7d | 30d | Market Cap |
|---|---|---|---|---|---|
| Asheville, NC (Hotspot) STR-AVL | $485,000 | +0.8% | +2.1% | +5.3% | Annual Income: $42,000 |
| Gatlinburg, TN (Hotspot) STR-GAT | $425,000 | +1.2% | +3.4% | +7.8% | Annual Income: $48,000 |
| Gulf Shores, AL (Hotspot) STR-GUL | $395,000 | +0.9% | +2.8% | +6.2% | Annual Income: $38,500 |
| Branson, MO (Hotspot) STR-BRA | $315,000 | +1.5% | +4.1% | +8.9% | Annual Income: $35,200 |
| Lake Tahoe, CA (Hotspot) STR-TAH | $875,000 | +0.6% | +1.8% | +4.2% | Annual Income: $65,000 |
| Miami, FL (Saturated) STR-MIA | $650,000 | -0.3% | +0.8% | +1.9% | Annual Income: $35,000 |
| Nashville, TN (Saturated) STR-NAS | $525,000 | -0.1% | +1.2% | +2.4% | Annual Income: $28,500 |
| Austin, TX (Saturated) STR-AUS | $595,000 | -0.4% | +0.9% | +1.7% | Annual Income: $32,000 |
| San Diego, CA (Saturated) STR-SD | $925,000 | -0.2% | +0.6% | +1.3% | Annual Income: $42,500 |
| Denver, CO (Saturated) STR-DEN | $575,000 | -0.5% | +0.7% | +1.8% | Annual Income: $29,800 |
Analysis Summary
Hotspot markets show significantly stronger price appreciation and higher rental yields, with average property values 15-20% lower than saturated markets while generating 25-35% higher annual rental income. Property taxes range from $2,800-$8,500 annually, with insurance costs averaging $1,200-$3,500 depending on location and natural disaster risk.
Key Insights
- Hotspot markets demonstrate superior ROI with average cap rates of 9.2% vs 5.1% in saturated markets
- Emerging destinations show 30-day price momentum 3-4x stronger than established STR markets
- Total carrying costs (taxes + insurance + maintenance) average $8,500 in hotspots vs $12,200 in saturated cities
Data sourced from AirDNA, local MLS systems, and county tax assessor records. Rental income projections based on 70% occupancy rates and current market ADRs.
Disclaimer: Stock prices are highly volatile and subject to market fluctuations. Data is for informational purposes only and should not be considered investment advice. Always do your own research before making investment decisions.
ROI Realities: Beyond the Headlines
It’s easy to get swept up in the excitement surrounding short-term rental investing, but a realistic assessment of potential returns is crucial. A rental property ROI calculator, such as the one available on BNB Stats, is an invaluable tool for evaluating the financial viability of an investment.
Occupancy rate, average daily rate, and expenses are the three key drivers of profitability. However, expenses often get underestimated. Property management fees, cleaning costs, maintenance, taxes, insurance, and potential vacancy periods can significantly impact your bottom line.
Let’s consider a hypothetical example: a $300,000 property with an estimated monthly revenue of $3,000. Expenses, including mortgage payments, property taxes, insurance, and property management fees, total $1,800 per month. This leaves a net operating income of $1,200 per month, resulting in an annual cash flow of $14,400. The cash-on-cash return, assuming a $60,000 down payment, is 24%.
However, this is a simplified example. A more comprehensive analysis would account for potential fluctuations in occupancy rates, seasonal variations in demand, and unexpected maintenance costs. Dynamic pricing strategies, using tools like PriceLabs, are essential for maximizing revenue and adapting to changing market conditions.
Real risks and how to handle them
Short-term rental investing, like any investment, carries inherent risks. Regulatory changes, economic downturns, seasonality, competition, and property damage are all potential challenges that investors need to be prepared for.
Diversifying your portfolio across multiple markets can help mitigate risk. Investing in properties in different locations reduces your exposure to local economic fluctuations and regulatory changes. Obtaining adequate insurance coverage is also essential to protect against property damage, liability claims, and lost income.
Staying informed about local regulations is paramount. Short-term rental laws are constantly evolving, and investors need to be proactive in ensuring compliance. This may involve obtaining permits, paying taxes, and adhering to specific occupancy limits. A good property manager will handle this for you.
Competition is increasing in many markets. Differentiating your property through unique amenities, exceptional customer service, and strategic marketing can help you stand out from the crowd. Platforms like Airbnb are also cracking down on party houses, so implementing strict house rules and actively monitoring guest behavior is important.
- Spread your properties across different zip codes to protect against local law changes.
- Obtain adequate insurance.
- Stay informed about local regulations.
- Differentiate your property.
No comments yet. Be the first to share your thoughts!