
The shift in pricing data
Dynamic pricing in the short-term rental market isn’t new. For years, hosts have adjusted rates based on seasonal demand, holidays, and major local events. Early attempts relied on rule-based systems – 'increase prices by 10% during summer' – or rudimentary algorithms. These methods are increasingly inadequate in 2026. The market’s complexity has exploded, and relying on simple rules means leaving money on the table.
What’s changed is the sheer volume and granularity of available data. We’re past the point where seasonality alone can dictate pricing strategy. The ability to respond to real-time shifts in demand, competitor behavior, and even micro-local events is now essential for maximizing revenue. This isn't just about reacting to the market; it’s about anticipating it.
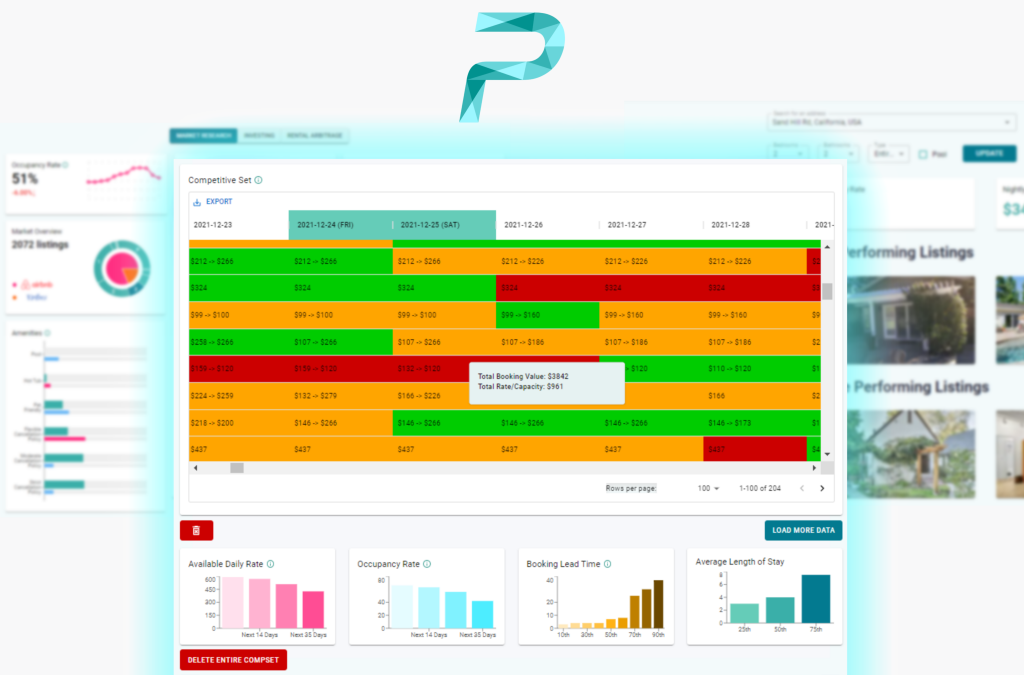
Tools like AirDNA and Airbtics are now standard. They don't just dump spreadsheets on you; they build platforms that interpret market shifts into specific price changes. We've moved past guessing based on last year's calendar.
New inputs beyond the calendar
The evolution of dynamic pricing hinges on the integration of new data inputs. While seasonality remains a factor, it's now just one piece of a much larger puzzle. Hosts can now leverage granular demand signals previously unavailable or too difficult to track effectively. Local events – concerts, conferences, festivals, sporting events – create localized spikes in demand that demand a pricing response.
Real-time competitor pricing is also critical. The speed at which competitors adjust their rates is accelerating, and hosts need to respond in kind. Monitoring competitor pricing isn’t a static exercise; it requires constant vigilance. Beyond that, even subtle influences like weather patterns and social media trends can impact demand. A major snowstorm might increase demand for cozy cabins, while a viral TikTok video could drive bookings to a specific location.
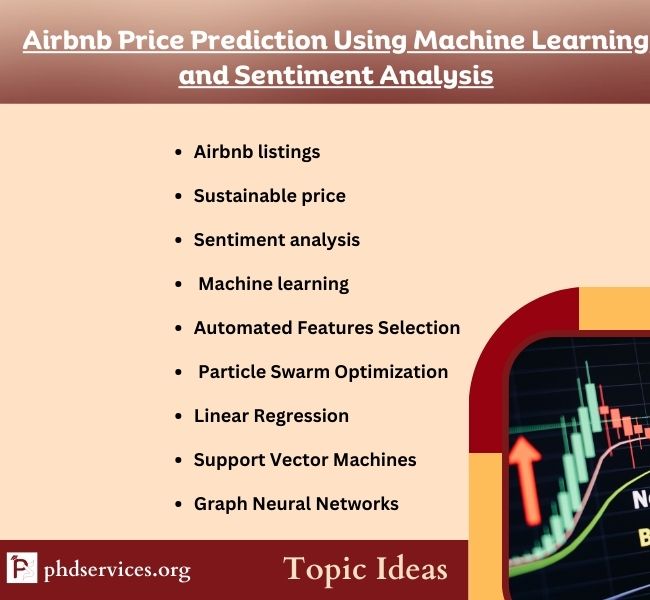
However, having the data is only half the battle. The real power lies in the speed at which it's processed and acted upon. Machine learning algorithms are essential for identifying patterns and correlations that humans would miss. They can analyze vast datasets and predict future demand with increasing accuracy. This allows hosts to proactively adjust prices and maximize revenue potential.
Consider a city hosting a major tech conference. A simple seasonal adjustment wouldn’t capture the full impact. But a system incorporating real-time hotel occupancy rates, flight bookings, and social media mentions related to the conference could predict a significant surge in demand, allowing the host to raise prices accordingly.
- Local events like concerts and festivals that drive immediate spikes
- Competitor pricing tracked in real-time to avoid being the last to adjust
- Weather Patterns: Impact on demand for specific property types.
- Social Media Trends: Identifying emerging hotspots.
Dynamic Pricing Input Comparison: Effectiveness for Revenue Optimization (2026 Data)
| Data Input | Accuracy | Speed of Impact | Cost of Acquisition | Complexity of Implementation |
|---|---|---|---|---|
| Seasonality | High | Medium | Low | Low |
| Local Events | Medium | High | Medium | Medium |
| Competitor Pricing | High | Fast | Medium | Medium |
| Weather Data | Medium | Medium | Low | Low |
| Demand Forecasting (Market-Wide) | Medium to High | Medium | Medium to High | High |
| Occupancy Rate Trends | High | Medium | Low | Low |
| Day of Week | High | Fast | Low | Low |
| School Holiday Schedules | High | Medium | Low | Low |
Illustrative comparison based on the article research brief. Verify current pricing, limits, and product details in the official docs before relying on it.
Focusing on RevPAR
When evaluating the success of dynamic pricing, Revenue Per Available Listing (RevPAR) is the most important metric. It's a more comprehensive measure than simply looking at occupancy or Average Daily Rate (ADR) in isolation. RevPAR considers both occupancy and ADR, providing a holistic view of revenue performance.
Dynamic pricing aims to maximize RevPAR, not just one of its components. A host might slightly increase prices during peak demand, even if it means a small decrease in occupancy. If the increase in ADR outweighs the decrease in occupancy, RevPAR will increase. This is the core principle behind effective dynamic pricing.
For example, a host might typically charge $200/night with 80% occupancy, resulting in a RevPAR of $160. By increasing the price to $220/night during a local event and experiencing 75% occupancy, the RevPAR increases to $165. This demonstrates how strategic pricing adjustments can drive overall revenue growth.
Comparing AirDNA Adapt and Airbtics
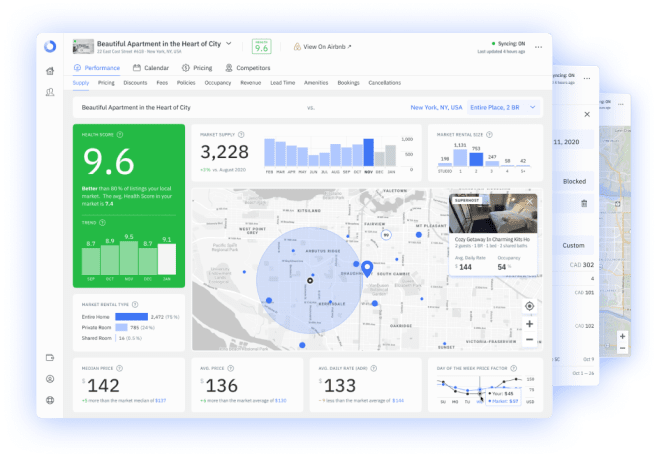
AirDNA Adapt and Airbtics are two leading platforms offering dynamic pricing tools for short-term rental hosts. Both leverage extensive datasets to provide data-driven pricing recommendations, but they differ in their approach and target audience. AirDNA, known for its comprehensive market data, has expanded into dynamic pricing with Adapt, focusing on providing flexible pricing recommendations based on real-time market conditions.
AirDNA Adapt integrates with popular property management systems (PMS) like Guesty and Hostaway, allowing for automated price adjustments. The platform analyzes market trends, competitor data, and property-specific factors to generate optimal pricing. It uses algorithms that consider factors like location, property size, amenities, and demand forecasts. AirDNA’s strength lies in its broad market coverage and historical data.
Airbtics, on the other hand, offers a more focused approach, specializing in Airbnb and Vrbo data. Their pricing tool emphasizes competitive analysis, allowing hosts to see how their property stacks up against similar listings in the area. Airbtics provides detailed reports on market trends, occupancy rates, and average daily rates, helping hosts make informed pricing decisions. They also offer a more granular level of customization, allowing hosts to set specific pricing rules and parameters.
The algorithms employed by both platforms are proprietary, but they generally involve a combination of statistical modeling, machine learning, and predictive analytics. AirDNA Adapt leans towards a more automated approach, while Airbtics provides more control over the pricing process. The choice between the two depends on the host’s level of experience, technical expertise, and desired level of control.
Why you have to automate
Manual dynamic pricing is simply unsustainable in today’s market. The sheer volume of data and the speed of change require automation. Continuously monitoring competitor pricing, tracking local events, and adjusting rates manually is a full-time job. Automated pricing tools connect to property management systems (PMS) and automatically adjust prices based on real-time data, freeing up hosts’ time and maximizing revenue potential.
However, automation isn't a set-it-and-forget-it solution. It’s crucial to set clear pricing rules and guardrails to prevent extreme price fluctuations. Hosts should define minimum and maximum price thresholds, as well as rules for adjusting prices based on specific events or demand spikes. These guardrails ensure that prices remain reasonable and avoid alienating guests.
There are also concerns about algorithmic bias. If the algorithm is trained on biased data, it may perpetuate existing inequalities. Human oversight is essential to ensure that the pricing recommendations are fair and equitable. Regularly reviewing the algorithm’s performance and making adjustments as needed is crucial.
Pitfalls & Avoiding Pricing Wars
Despite its benefits, dynamic pricing isn't without its risks. One potential pitfall is the risk of pricing wars. If everyone is using the same algorithms, they may end up undercutting each other, driving down overall revenue. This is particularly likely in highly competitive markets.
It’s crucial to understand your unique property and target audience. What makes your property special? What value do you offer guests? Focusing on these differentiators can allow you to command a premium price, even in a crowded market. Building brand loyalty is also essential. Guests who trust your brand are more likely to pay a higher price.
Constantly fluctuating prices can also alienate guests. Transparency is key. Explain your pricing strategy to guests and highlight the value they’re receiving. Offering discounts for longer stays or repeat bookings can help build goodwill.
Calculating Your Potential Gains
The potential revenue gains from dynamic pricing can be significant. To estimate your potential gains, start by analyzing your historical booking data. Identify periods of high and low demand, and determine how your pricing strategy impacted occupancy and RevPAR. Then, use tools like BNB Stats and the platforms discussed earlier – AirDNA Adapt and Airbtics – to model different pricing scenarios.
These tools can help you estimate the potential impact of dynamic pricing on your revenue. Don’t be afraid to experiment with different pricing strategies and track the results. Data-driven decision-making is the key to success. Embrace the revolution in vacation rental analytics and unlock the full potential of your property.

No comments yet. Be the first to share your thoughts!