
Beyond Gut Feeling: Revenue Prediction in 2026
For years, Airbnb hosts have relied on a mix of gut feeling, limited market data, and a whole lot of hoping when it comes to setting prices. It’s a precarious game, especially with fluctuating demand and increasing competition. But things are changing, and fast. We’re seeing a real shift towards AI-powered revenue analytics that are promising to take the guesswork out of short-term rental income.
The promise isn’t just about convenience, it's about serious financial gains. Recent data suggests that hosts utilizing these new tools are experiencing revenue boosts of up to 35%. That’s a significant jump, and it’s changing how people approach vacation rental management. This isn't just for large property management companies anymore, either.
This article will break down precisely how these AI-driven platforms work, what data they use, and how you can leverage them to maximize your Airbnb earnings. We’ll look at the tools leading the charge, dive into the specifics of that 35% increase, and discuss what the future holds for AI in the short-term rental market. Accurate forecasting is no longer a luxury; it's becoming a necessity.
AirDNA Adapt & BNBCalc: The New Tools
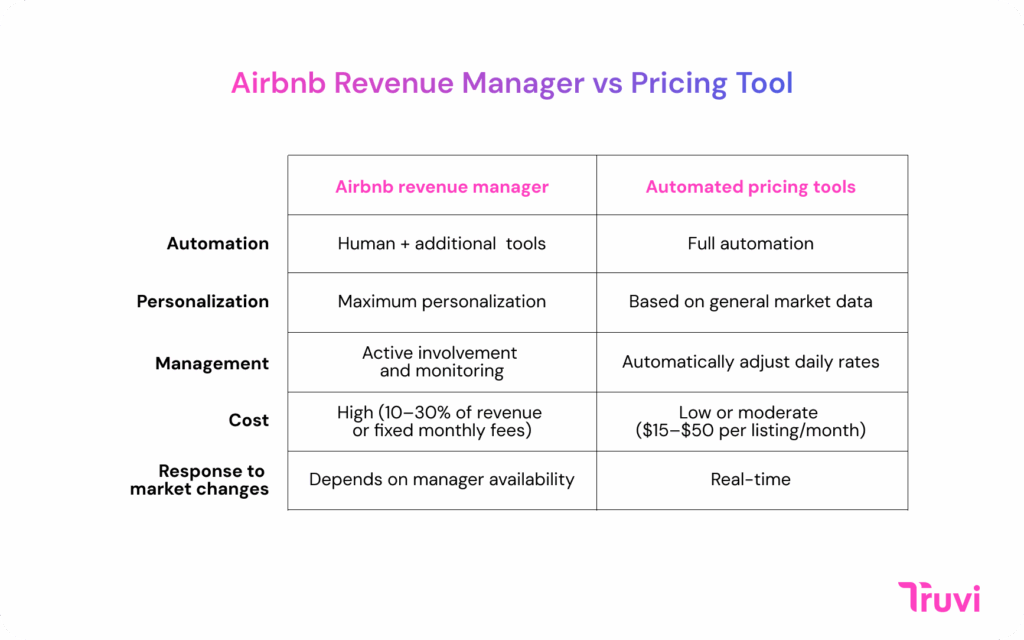
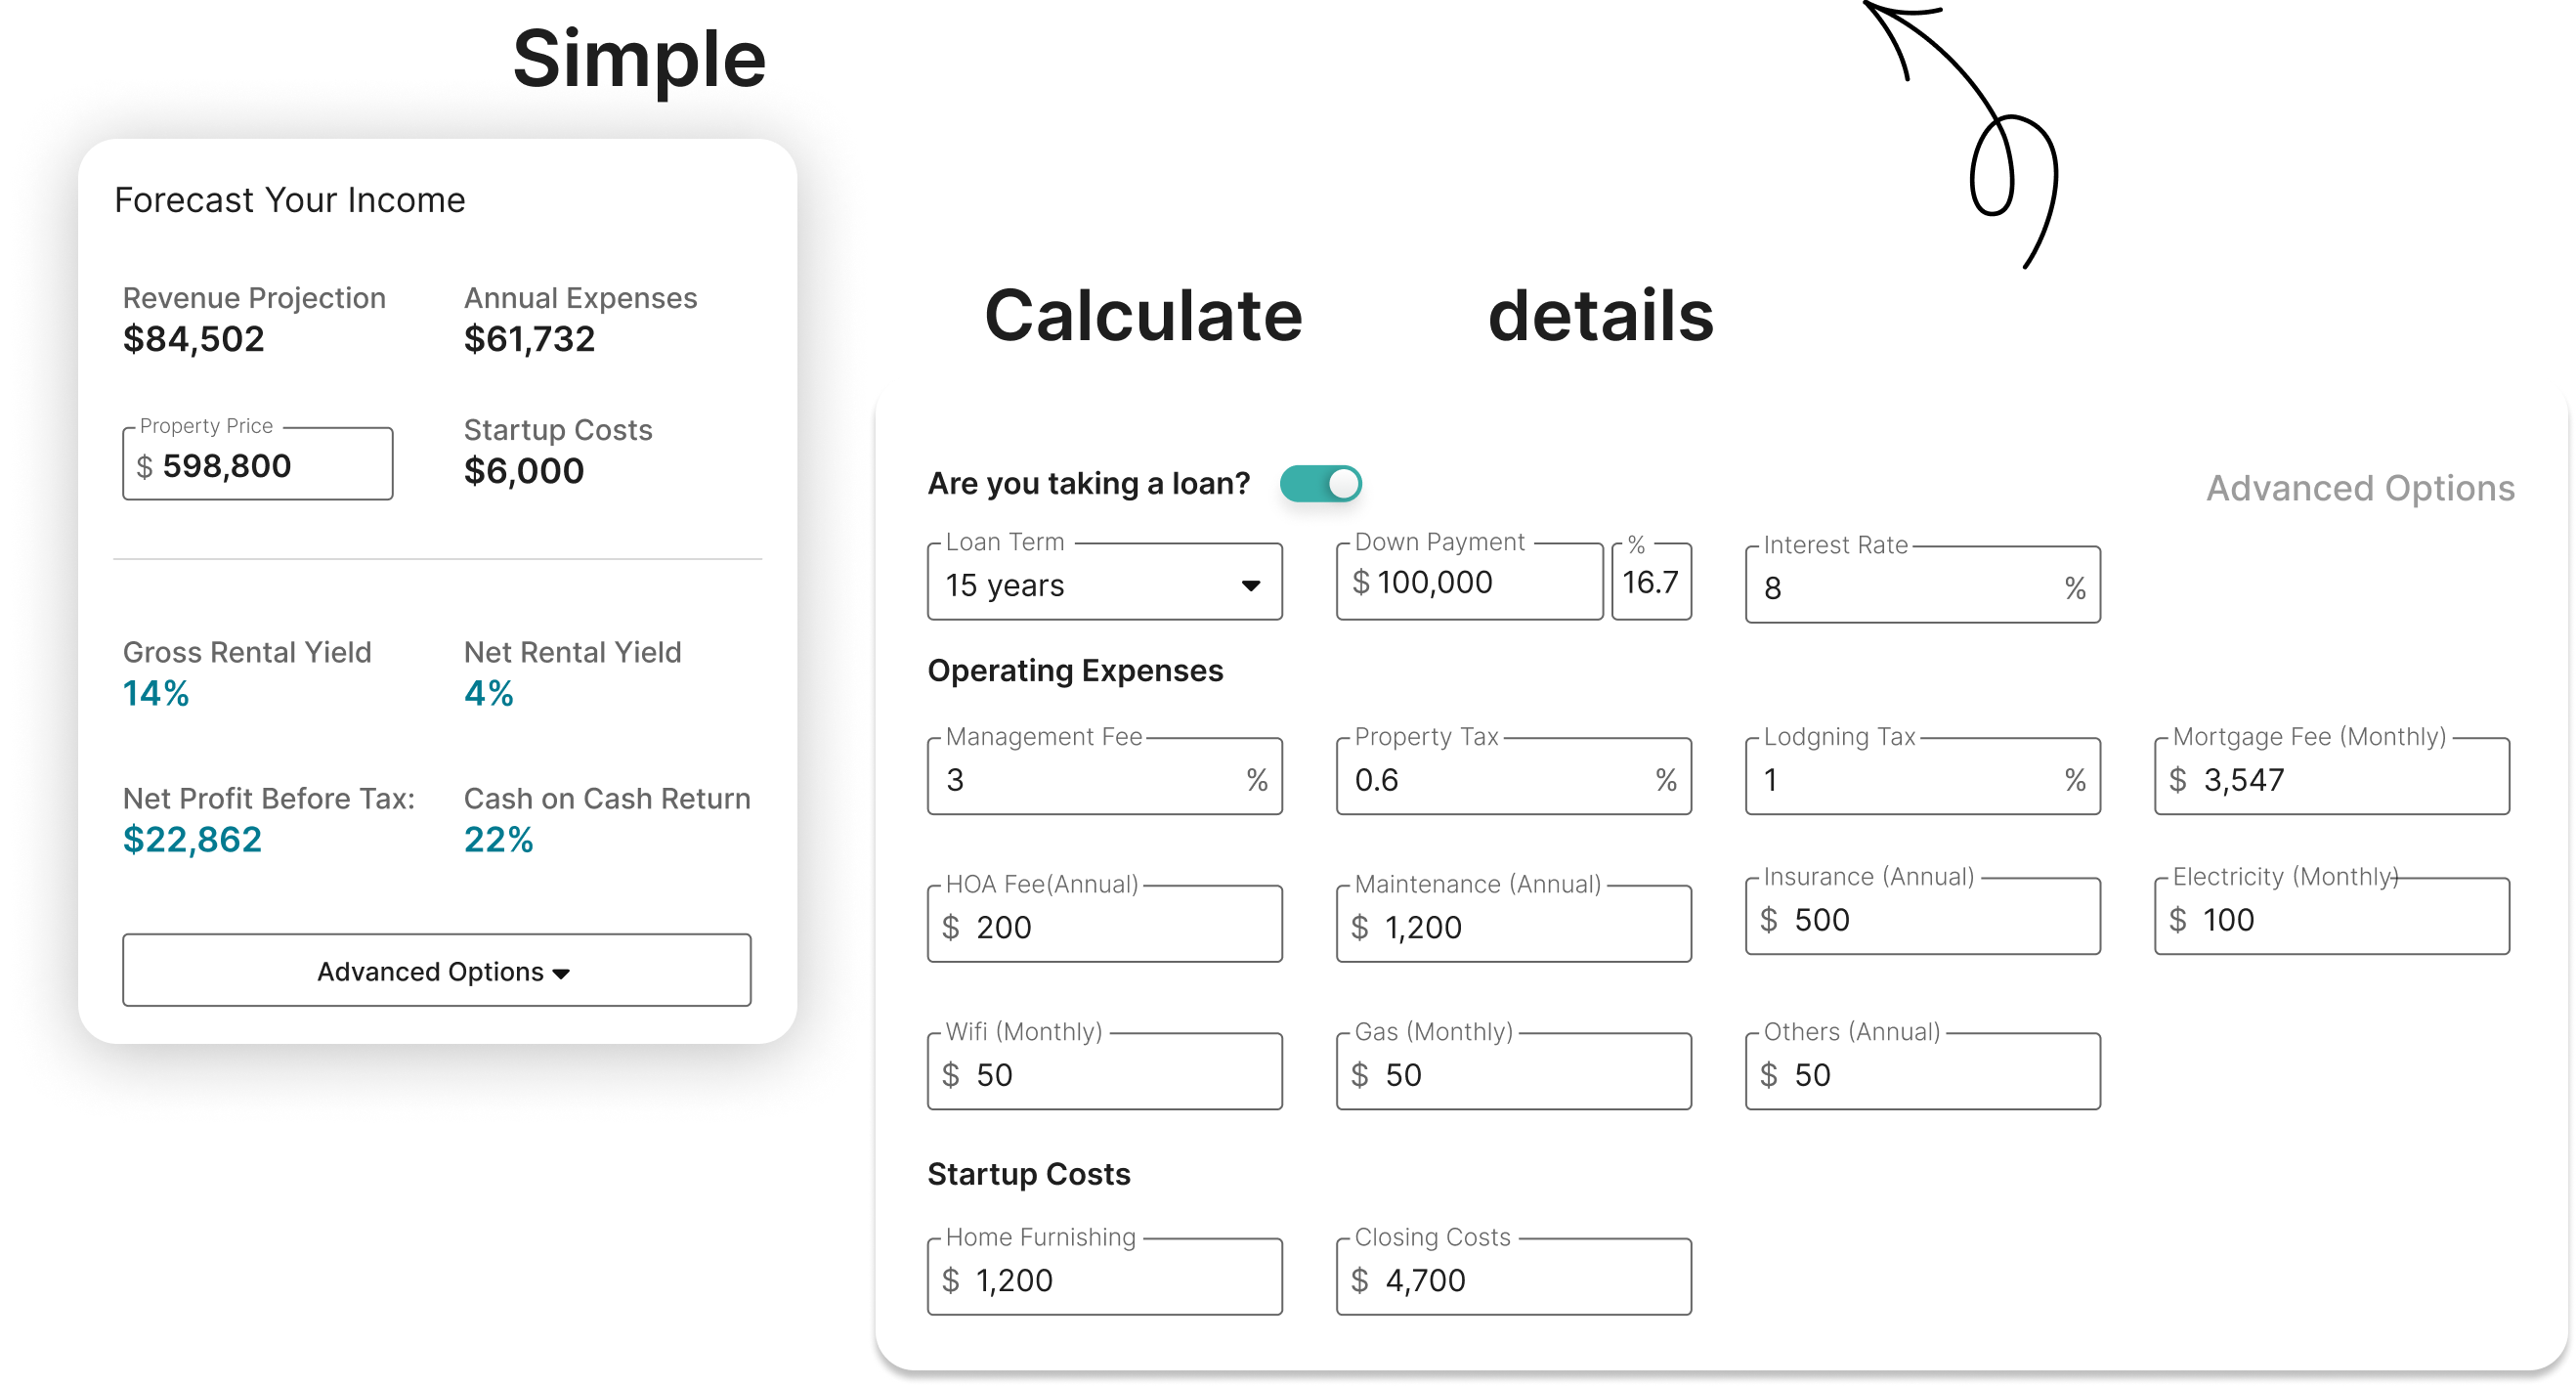
Two platforms are currently leading the charge in AI-powered Airbnb revenue analytics: AirDNA Adapt and BNBCalc. Both offer sophisticated revenue management solutions, but they approach the problem with slightly different philosophies. AirDNA Adapt, building on the established AirDNA data foundation, focuses on providing dynamic pricing recommendations and market insights.
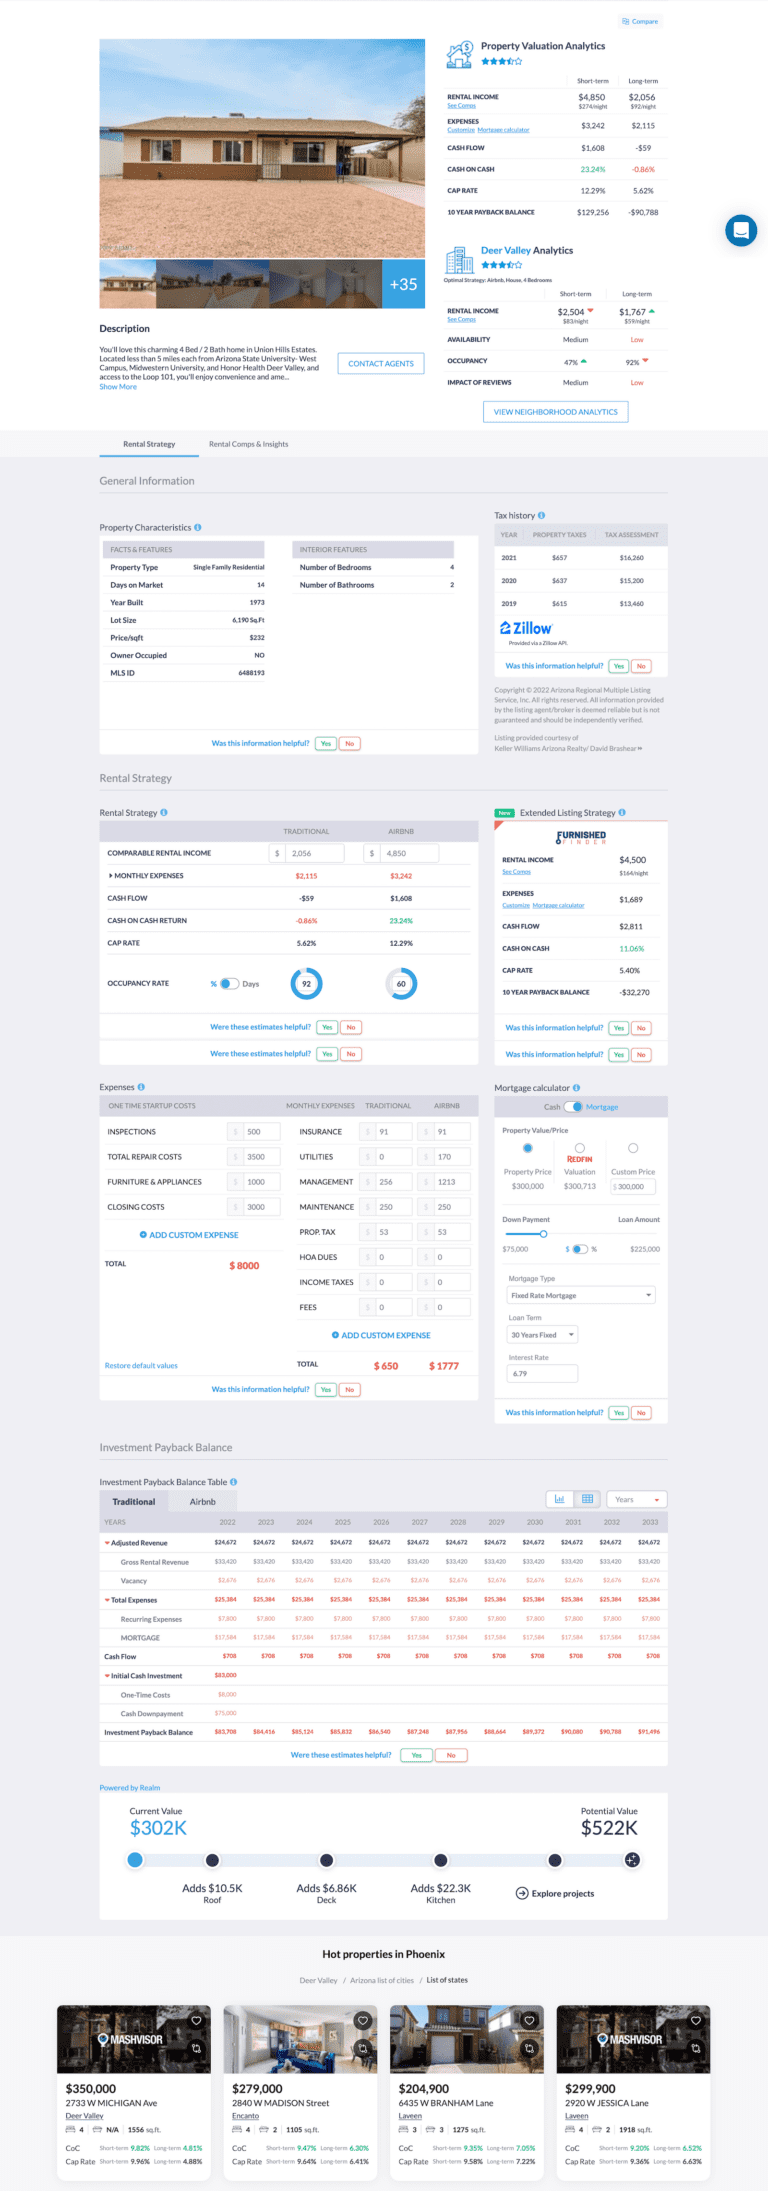
AirDNA Adapt pulls data from a massive dataset of Airbnb and Vrbo listings, analyzing historical occupancy rates, seasonal trends, local event schedules, and competitor pricing. BNBCalc, on the other hand, positions itself as a more comprehensive solution, offering both short-term and long-term rental revenue projections. They also integrate with Steadily Insurance, offering coverage options to customers.
The core of both platforms is the use of machine learning algorithms to predict future demand and optimize pricing. They aren’t simply "calculators’ in the traditional sense; they"re constantly learning and adapting to changing market conditions. While AirDNA Adapt is often favored by those already familiar with the AirDNA ecosystem, BNBCalc appeals to investors looking for a broader view of rental income potential, including long-term options.
Decoding the 35% Increase: Where Does It Come From?
That 35% revenue boost isn’t a magic number. It’s the result of a combination of features designed to optimize every aspect of your Airbnb listing. A key component is dynamic pricing. These platforms don’t just suggest a fixed price; they recommend prices that change based on real-time demand, competitor activity, and upcoming events.
For example, AirDNA Adapt recently identified a surge in demand during the Coachella music festival in Indio, California. The platform prompted hosts in the area to increase their prices by 20%. Hosts who followed the recommendation saw a 15% jump in bookings and a corresponding increase in revenue. This is a tangible example of how data-driven pricing can significantly impact your bottom line.
Beyond pricing, these tools also focus on occupancy optimization. They identify periods of low demand and suggest strategies for filling those gaps, such as offering discounts or running targeted promotions. They also help hosts understand the optimal length of stay for their property, maximizing revenue per booking. BNBCalc, for instance, provides insights into the best days of the week to accept bookings, based on historical data.
Another crucial feature is market trend identification. The platforms analyze vast amounts of data to identify emerging trends and opportunities. This allows hosts to proactively adjust their listings and pricing to capitalize on changing market conditions. This could involve highlighting specific amenities that are in high demand or targeting specific traveler segments.
Beyond Price: Occupancy & Seasonality Insights
Maximizing revenue isn’t just about setting the highest possible price; it’s about keeping your property booked. These AI-powered tools excel at helping hosts optimize occupancy rates by identifying and leveraging seasonality trends. For example, a beachside property might see peak demand during the summer months, but a significant drop-off in the off-season.
Platforms like BNBCalc can analyze historical data to predict these fluctuations and suggest strategies for mitigating them. This might involve offering discounts during the shoulder seasons, targeting remote workers looking for a change of scenery, or highlighting unique amenities that appeal to different traveler segments. Understanding seasonality allows you to proactively adjust your marketing efforts and pricing strategies.
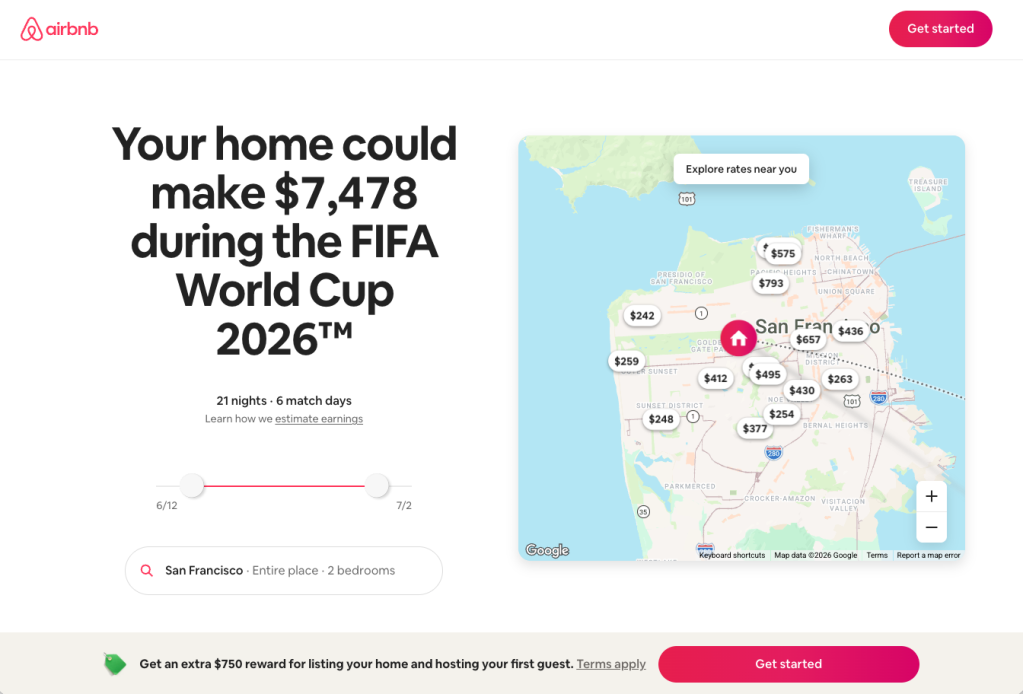
Furthermore, these tools help hosts understand the impact of local events on demand. A major conference, a sporting event, or a music festival can all drive up demand and allow you to increase your prices. By identifying these events in advance, you can prepare your listing and maximize your earning potential. Rabbu also offers a free Airbnb calculator that helps analyze rental income, providing another data point for hosts.
Competitive Analysis: Knowing Your Neighborhood
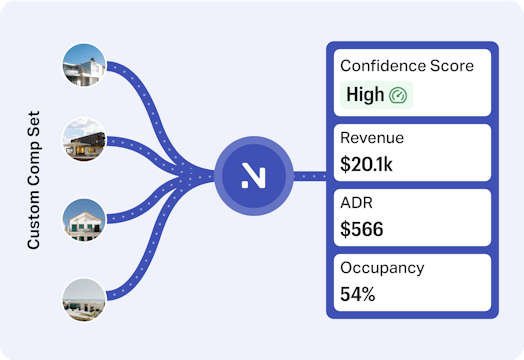
In a crowded market, understanding your competition is crucial. These platforms allow hosts to analyze their competitors’ listings, comparing key metrics such as price, occupancy rate, amenities, and review scores. This provides valuable insights into how your property stacks up against the competition.
AirDNA Adapt, for example, allows you to view a detailed comparison of your listing against similar properties in your area. You can see how your price compares, whether your occupancy rate is above or below average, and what amenities your competitors are offering. This information can help you identify areas where you can differentiate your listing and attract more bookings.
You can also use this data to identify underpriced or overvalued properties. If a comparable property is priced significantly lower than yours, you might consider adjusting your price to remain competitive. Conversely, if a property is priced significantly higher, you might be able to justify a higher price for your own listing. This is about positioning yourself effectively within the local market.
Competitive Analysis Features 🔍
| Competitor Pricing Data | Occupancy Rate Tracking | Amenity Comparison | Review Score Analysis | Listing Quality Score |
|---|---|---|---|---|
| AirDNA Adapt | Yes | Yes | Yes | Yes |
| BNBCalc | Yes | Yes | Yes | Yes |
| Data Sources | Both utilize Airbnb data | Both utilize Airbnb data | Both utilize Airbnb data | Data availability varies |
| Competitive Insights | Provides data for revenue & occupancy comparisons | Focuses on revenue optimization through market analysis | Both offer comparisons | Both analyze review scores |
| Adaptability | AirDNA Adapt adjusts predictions based on real-time data 📈 | BNBCalc offers customizable settings for analysis | Both allow for market-specific filtering | Both provide insights into listing performance |
| Reporting | Offers detailed reporting features | Provides clear, actionable insights | Both offer comprehensive data visualization | Both help identify areas for improvement |
Illustrative comparison based on the article research brief. Verify current pricing, limits, and product details in the official docs before relying on it.
The Data Behind the Predictions: Accuracy & Limitations
It’s important to remember that these tools aren’t perfect. The accuracy of their predictions depends on the quality and completeness of the data they use. These platforms rely on data from Airbnb, Vrbo, and other sources, but this data isn’t always perfect. There can be inaccuracies, missing information, or delays in updates.
Data is typically updated frequently, but there’s always a lag. Unexpected events, such as a sudden economic downturn or a natural disaster, can also impact demand and invalidate the predictions. It's critical to verify the data and use common sense when making pricing decisions. Don't blindly follow the recommendations without considering your own local market knowledge.
While these platforms have made significant strides in improving the accuracy of their predictions, they should be viewed as a tool to inform your decisions, not to make them for you. A healthy dose of skepticism and a willingness to adjust your strategy based on real-world results are essential. Remember, data is a powerful tool, but it’s not a substitute for good judgment.
Future Trends: AI & Short-Term Rental Tech
The integration of AI into short-term rental technology is still in its early stages. We can expect to see even more sophisticated tools emerge in the coming years. I anticipate a move towards more personalized pricing recommendations, tailored to individual traveler preferences and booking patterns.
Integration with smart home technology is another likely trend. Imagine a system that automatically adjusts the temperature and lighting in your property based on guest arrival times and preferences. Or a system that proactively identifies maintenance issues before they impact guest satisfaction.
Predictive maintenance features are also on the horizon. AI algorithms could analyze data from smart home devices to predict when appliances are likely to fail, allowing you to schedule maintenance proactively and avoid costly downtime. The potential for even greater revenue gains as AI technology continues to evolve is substantial. It’s an exciting time to be involved in the short-term rental industry.
No comments yet. Be the first to share your thoughts!