
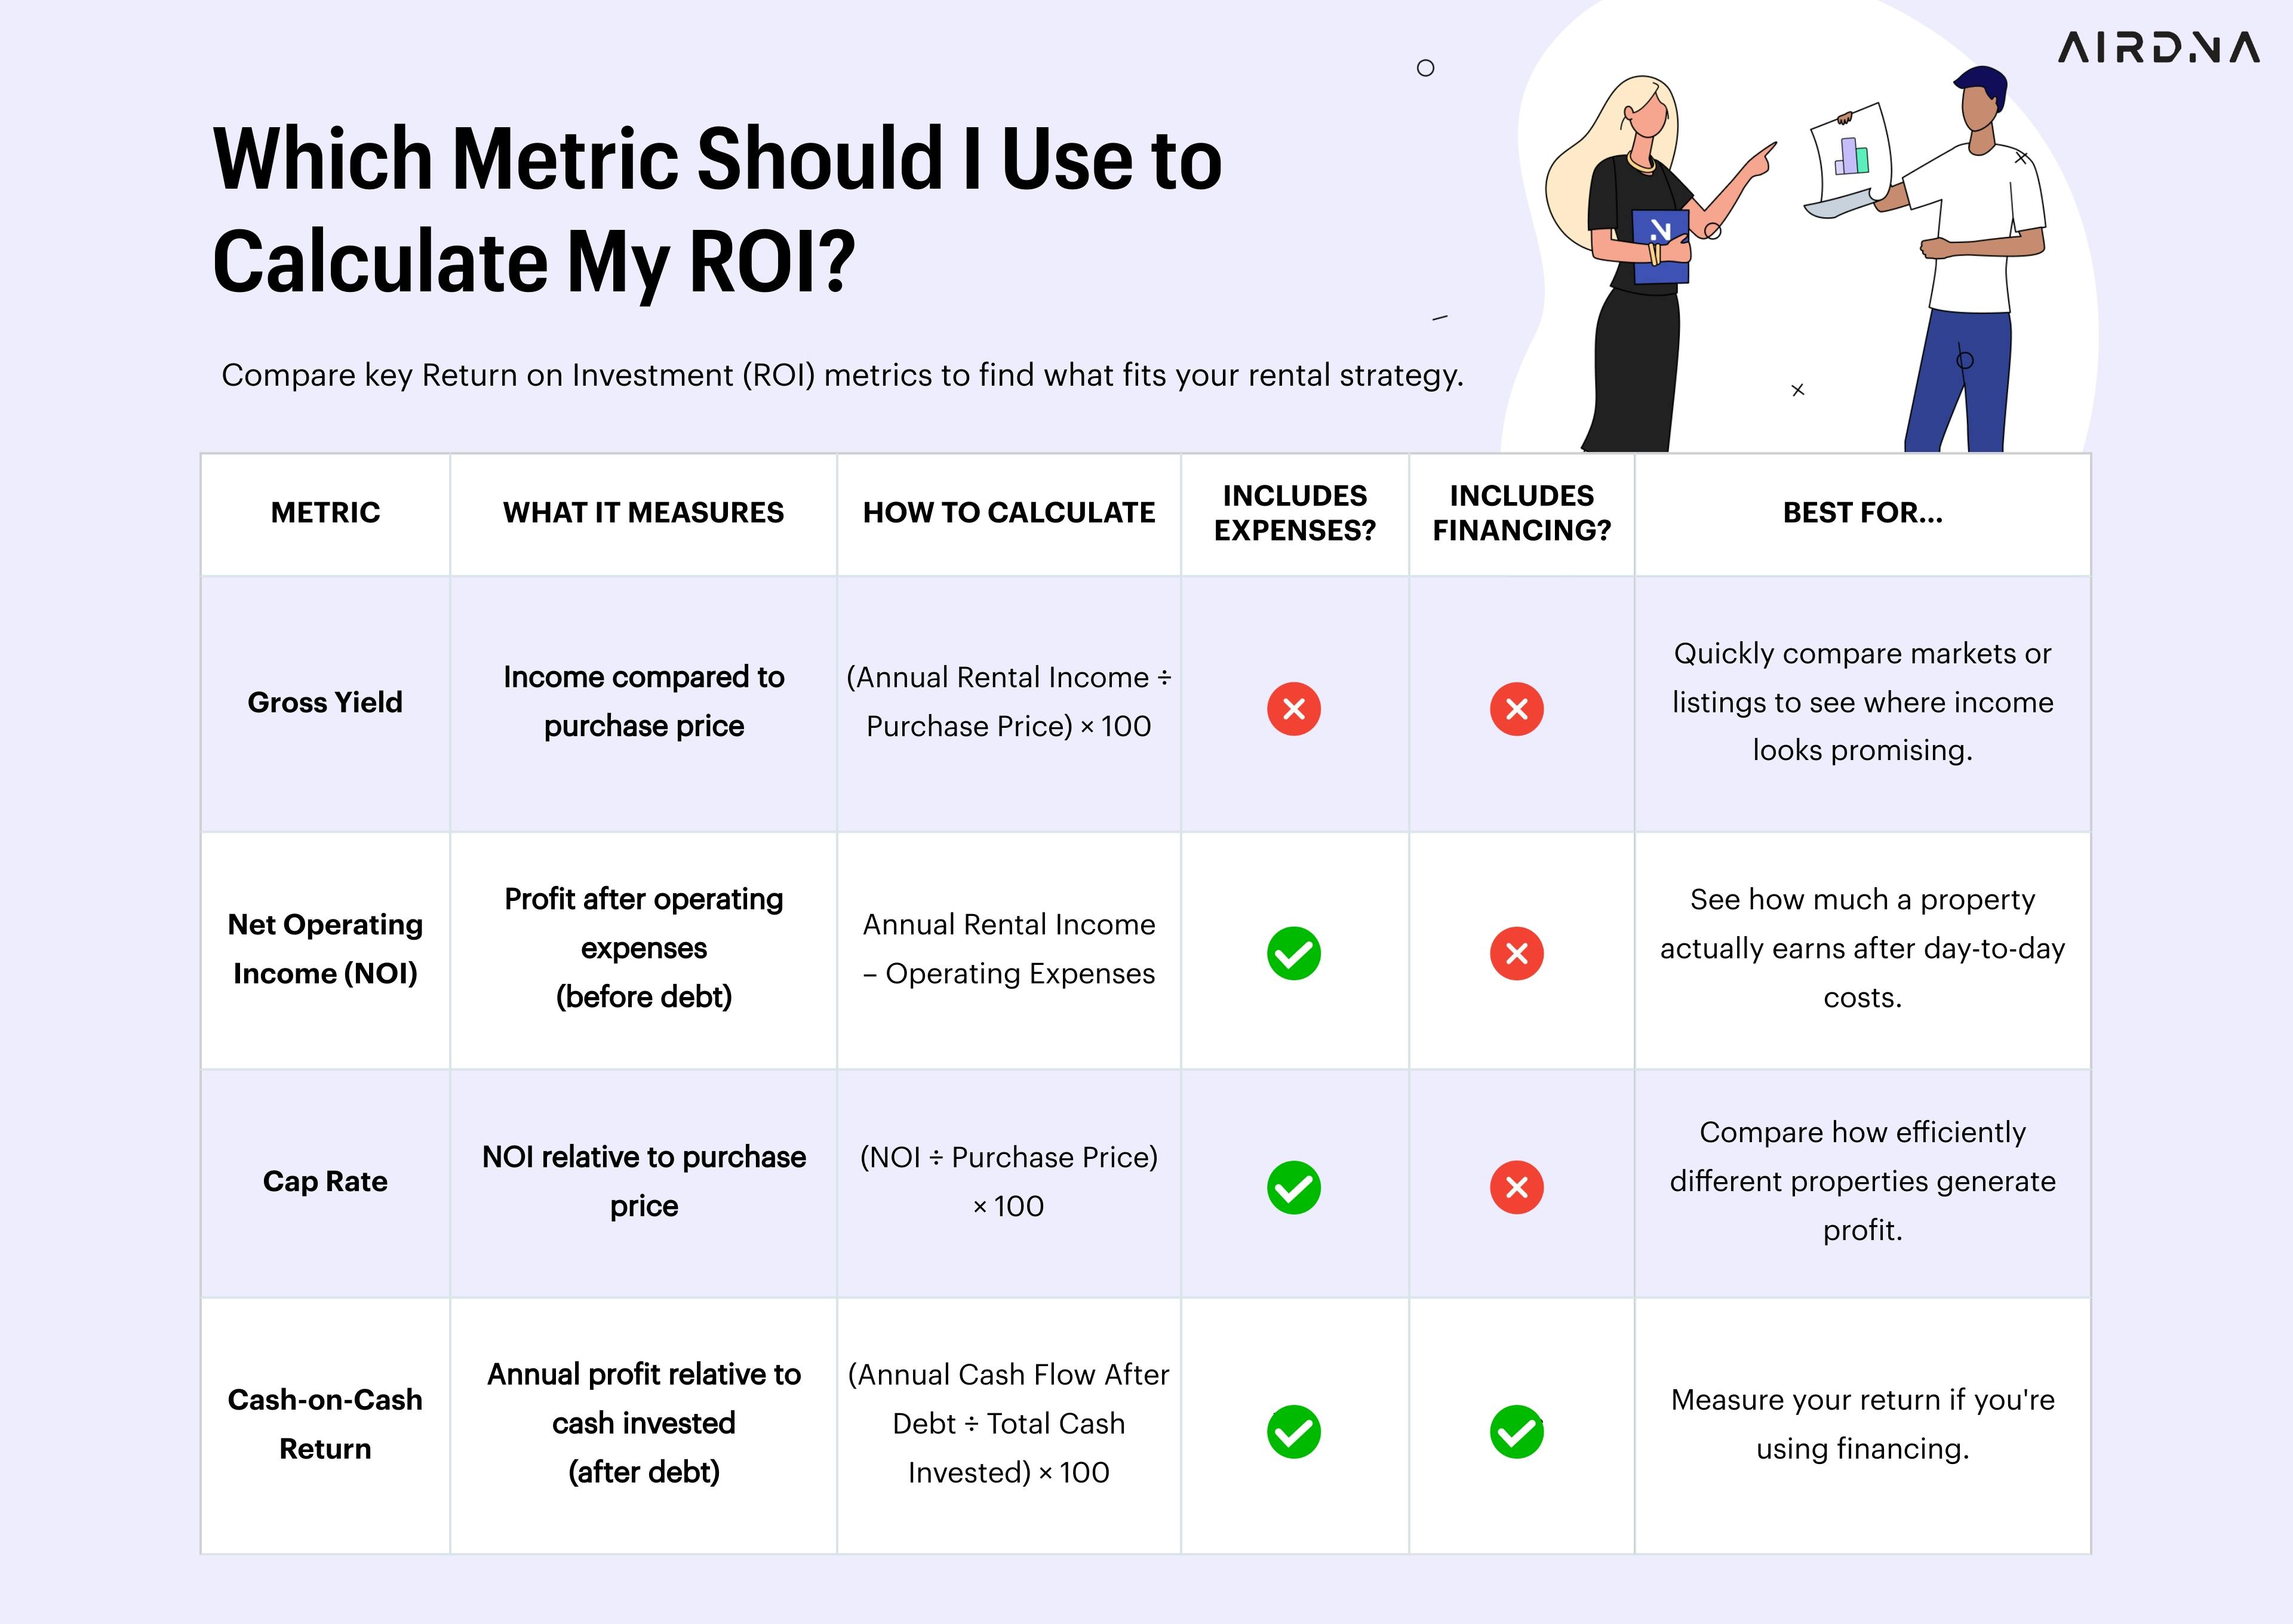
Why cap rate fails for vacation rentals
For too long, short-term rental (STR) investors have leaned on the capitalization rate – cap rate – as their primary metric for evaluating properties. This is a mistake. Cap rate, designed for long-term rentals, simply doesn’t account for the dynamic revenue potential, or the increased operational complexity, of vacation rentals. Relying on it alone can lead to wildly inaccurate projections and missed opportunities.
The truth is, a vacation rental’s profitability isn’t about the purchase price; it’s about how effectively you can generate revenue and manage expenses over time. A lower-priced property in a high-demand tourist destination can easily outperform a more expensive property in a slow market. To accurately assess an STR investment, you need to move beyond cap rate and focus on a comprehensive return on investment (ROI) calculation.
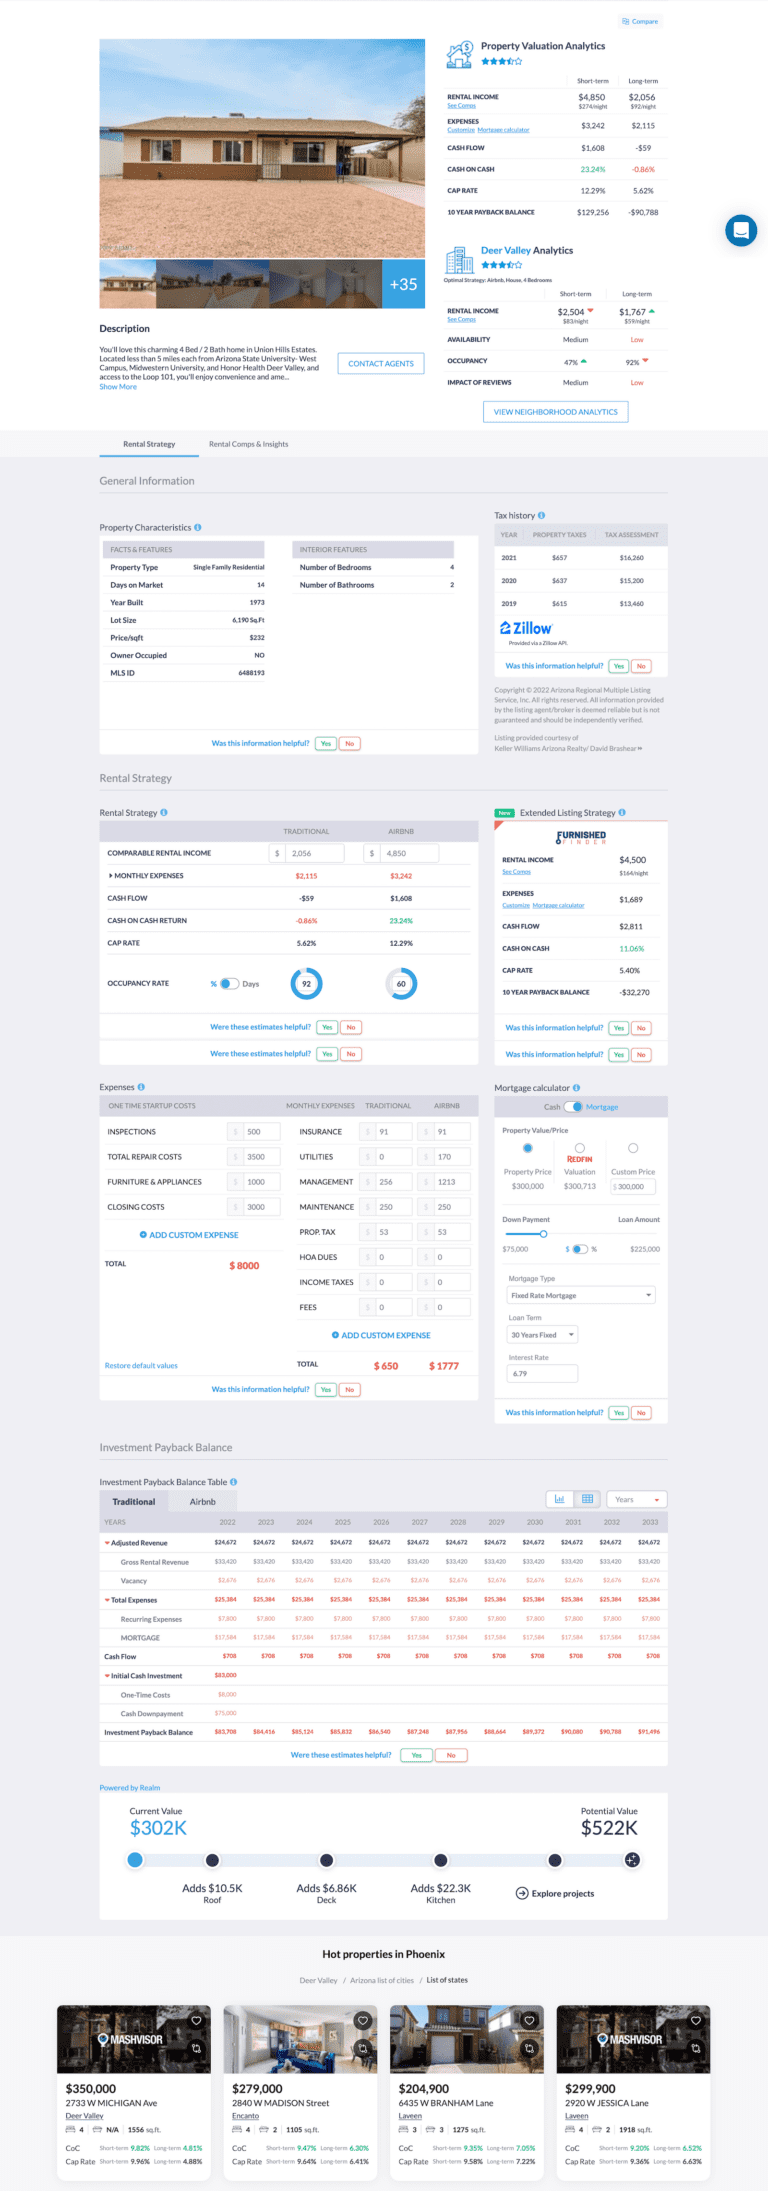
This calculation requires understanding several key factors. Occupancy rate, average daily rate (ADR), operating expenses, and financing costs all play a critical role. Ignoring even one of these elements can dramatically skew your results. A robust rental property ROI calculator is essential, but it’s only as good as the data you input and your understanding of what that data means.
The metrics that actually matter
Let’s break down the core metrics that drive STR profitability. Occupancy Rate is the percentage of nights your property is booked. A 50% occupancy rate means your property is rented out half the time. Average Daily Rate (ADR) is the average revenue you earn per night rented, calculated by dividing total revenue by the number of nights rented. Revenue Per Available Night (RevPAN) is a more comprehensive metric, combining occupancy and ADR – it’s simply ADR multiplied by occupancy rate.
Net Operating Income (NOI) is arguably the most important figure. It’s your total revenue minus all operating expenses, excluding debt service (mortgage payments). Calculating NOI gives you a clear picture of your property’s true earning potential. Understanding the interplay between these metrics is crucial. For instance, a slight increase in ADR, combined with a small bump in occupancy, can yield a significant boost in RevPAN and, ultimately, NOI.
Where do you get this data? Services like AirDNA provide historical occupancy and ADR data for specific markets, allowing you to benchmark your potential investment against comparable properties. Rabbu also offers similar analytical tools, helping you estimate rental income based on address and property characteristics. Don’t rely on guesswork – data-driven insights are essential for making informed decisions.
Consider this example: Property A has an ADR of $200 and 60% occupancy, resulting in a RevPAN of $120. Property B has an ADR of $250 but only 40% occupancy, yielding a RevPAN of $100. Despite the higher ADR, Property A is more profitable due to its superior occupancy. This illustrates why focusing solely on ADR can be misleading.
Hidden costs that eat your profit
Many investors focus solely on the mortgage, property taxes, and insurance when estimating expenses. While these are significant, they represent only the tip of the iceberg. A truly accurate ROI calculation must account for all operating costs. Property management fees, typically 20-30% of revenue, are a major expense. Cleaning fees, which can add up quickly with frequent turnovers, also need to be factored in.
Don’t underestimate maintenance and repairs. Properties experience wear and tear, and unexpected issues will inevitably arise. Budget for these contingencies. Utilities – electricity, water, gas, internet – are ongoing costs. Homeowners Association (HOA) fees, if applicable, can also be substantial. You also need to account for the cost of supplies like linens, toiletries, and cleaning products.
Account for vacancy. Even in high-demand spots, you will have empty nights. I usually factor in a 15% vacancy rate to stay safe. If you assume 100% occupancy, your profit projections will fail the moment you have a quiet week.
These costs can vary dramatically based on location and property type. A beachfront condo will likely have higher insurance and maintenance costs than a suburban townhouse. It’s essential to research local market conditions and obtain accurate quotes for all expenses before making an investment decision.
Financing & Your ROI
How you finance your STR investment significantly impacts your ROI. Paying cash offers the highest potential return, as you avoid interest payments. However, it ties up a large amount of capital. Taking out a mortgage allows you to leverage your investment, potentially amplifying your returns, but also increases your risk. A Home Equity Line of Credit (HELOC) can be a flexible option, but interest rates are typically higher.
The interest rate and loan term have a direct impact on your cash flow. A lower interest rate and shorter loan term will reduce your monthly payments, increasing your NOI. However, shorter loan terms also mean higher monthly payments. Cash-on-cash return – the ratio of annual cash flow to the amount of cash invested – is a useful metric for evaluating the profitability of a financed investment.
For example, if you invest $50,000 in a property and generate $8,000 in annual cash flow, your cash-on-cash return is 16%. This is a strong return, but it’s important to consider the potential risks and fluctuations in the market. 1031 exchanges can be a valuable strategy for deferring capital gains taxes when selling one investment property and acquiring another, potentially maximizing your overall returns.
Location and local laws
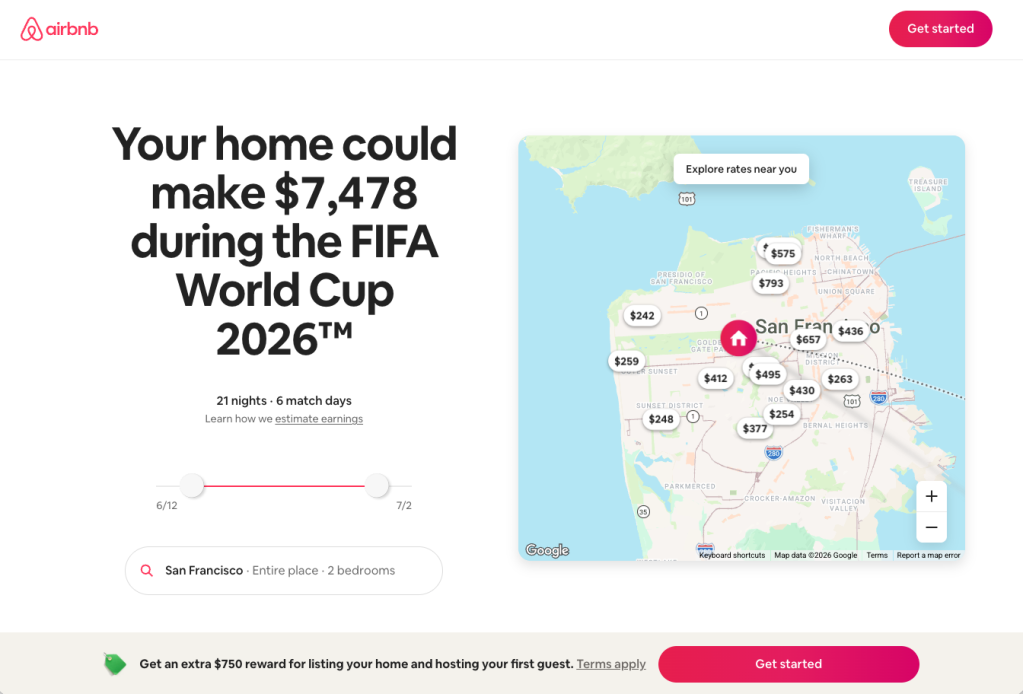
Location is paramount in the STR market. Properties in popular tourist destinations with high demand generally command higher occupancy rates and ADRs. Consider proximity to attractions, transportation, and amenities. Research local tourism trends and potential growth areas. A property in a growing market is more likely to appreciate in value and generate consistent revenue.
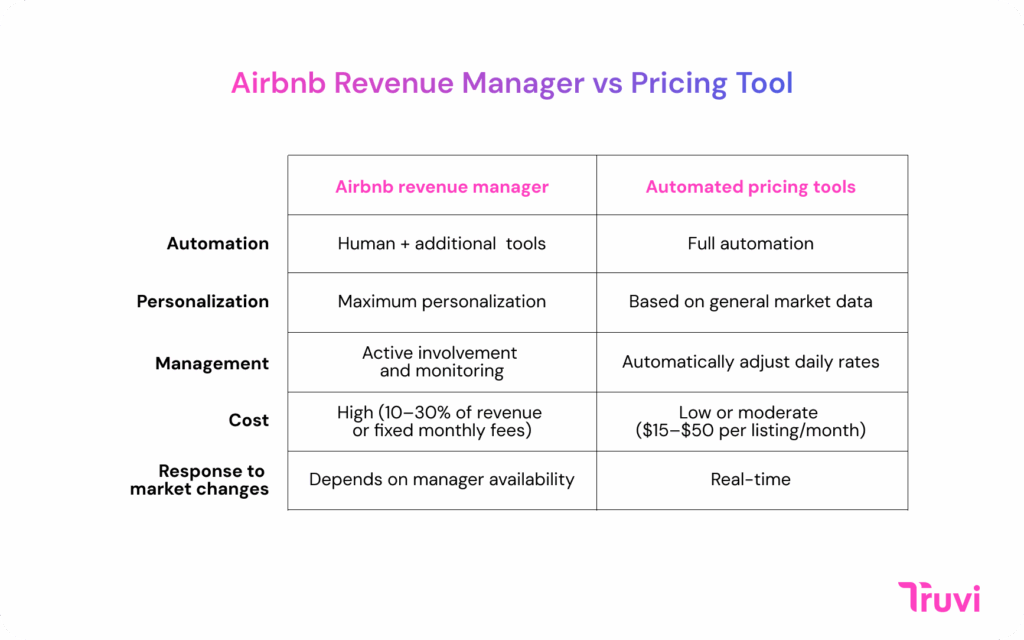
Seasonality plays a significant role in STR ROI. Demand fluctuates throughout the year, with peak seasons typically coinciding with holidays and school breaks. Adjust your pricing accordingly to maximize revenue during peak periods and attract bookings during slower seasons. Dynamic pricing tools, which automatically adjust rates based on demand, can be invaluable.
Short-term rental regulations are becoming increasingly common. Many cities and counties have implemented restrictions on STRs, such as licensing requirements, occupancy limits, and zoning regulations. It’s crucial to research local laws before investing in a property. Non-compliance can result in hefty fines or even the forced closure of your rental. AirDNA provides market research tools that include information on local regulations.
Consider the impact of local events on demand. A major convention or festival can significantly boost occupancy and ADR. However, these events can also create competition and drive up prices. Understanding the local market dynamics is essential for success.
ROI Red Flags: What to Watch For
Before investing in a short-term rental property, be aware of potential warning signs. High property taxes can significantly erode your profits. Strict regulations can limit your ability to operate your rental legally and profitably. Low occupancy rates in the area suggest weak demand.
Excessive competition from other STRs can drive down prices and reduce your market share. A property in poor condition will require significant repairs and maintenance, increasing your expenses. Don’t ignore these red flags – they could indicate a potentially unprofitable investment.
Due diligence is paramount. Obtain a professional property inspection to identify any hidden issues. Research local regulations thoroughly. Analyze the market data carefully. Don’t rush into a decision. A well-informed investor is a successful investor.
- High Property Taxes
- Strict Regulations
- Low Occupancy Rates
- Excessive Competition
- Poor Property Condition
Average Daily Rate Price Prediction 2026
Bull / Base / Bear scenario analysis for top US vacation rental markets
| Timeframe | Bull Case | Base Case | Bear Case | Key Driver |
|---|---|---|---|---|
| 1 Month | $165-320 | $155-305 | $140-285 | Spring break demand surge and limited inventory supply |
| 3 Months | $175-340 | $160-315 | $145-290 | Summer booking acceleration and travel recovery momentum |
| 6 Months | $185-360 | $170-330 | $150-300 | Peak summer season performance and international travel normalization |
| 1 Year | $195-380 | $175-345 | $155-310 | Market maturation, regulatory stability, and sustained leisure travel demand |
Price Prediction Summary
ADR growth expected to moderate from explosive 2023-2025 gains, with 5-15% annual increases driven by supply constraints and sustained travel demand. Premium markets like Miami and Nashville leading growth trajectory.
Key Factors Affecting Average Daily Rate Stock Price
- Supply-demand imbalance in top vacation markets
- Regulatory changes affecting new property listings
- Economic conditions impacting discretionary travel spending
- Seasonal booking patterns and length-of-stay trends
Disclaimer: Predictions are speculative and not financial advice. Stock price predictions are based on current market analysis and may vary significantly due to market volatility, economic conditions, and other unpredictable factors. Always do your own research before making investment decisions.
No comments yet. Be the first to share your thoughts!