
Why occupancy rates lie to you
Occupancy rates are deceptive. You can hit 70% occupancy by slashing your prices to nothing, but you won't make a profit. I've seen hosts celebrate high booking numbers while their bank accounts stay flat because they aren't tracking the actual dollars coming in per night.
A far more useful metric is RevPAR – Revenue Per Available Room. RevPAR is calculated by multiplying your average daily rate (ADR) by your occupancy rate. This gives you a clear picture of how much revenue each available room is generating. For example, a property with an ADR of $150 and a 70% occupancy rate has a RevPAR of $105. This is a much more telling figure than the occupancy rate alone.
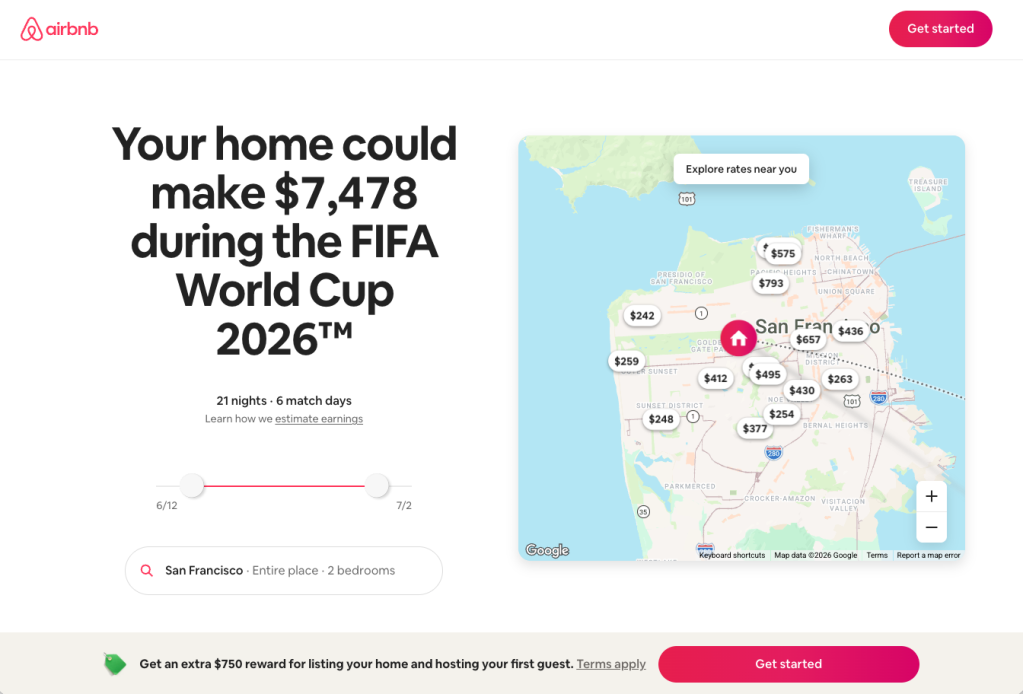
Airbnb’s own dashboard provides some data, but it’s often limited in scope and doesn’t offer the comparative analysis needed for serious investment decisions. It’s great for a quick overview, but relying solely on it can lead to missed opportunities and inaccurate projections. You'll need to look at external tools to get a comprehensive understanding of the market and potential earnings.
This is where a dedicated Airbnb revenue calculator becomes invaluable. These tools leverage extensive data sets and sophisticated algorithms to provide a more accurate and nuanced picture of your potential earnings, accounting for factors Airbnb’s dashboard simply doesn’t consider. They are a crucial step in evaluating a short term rental investment.
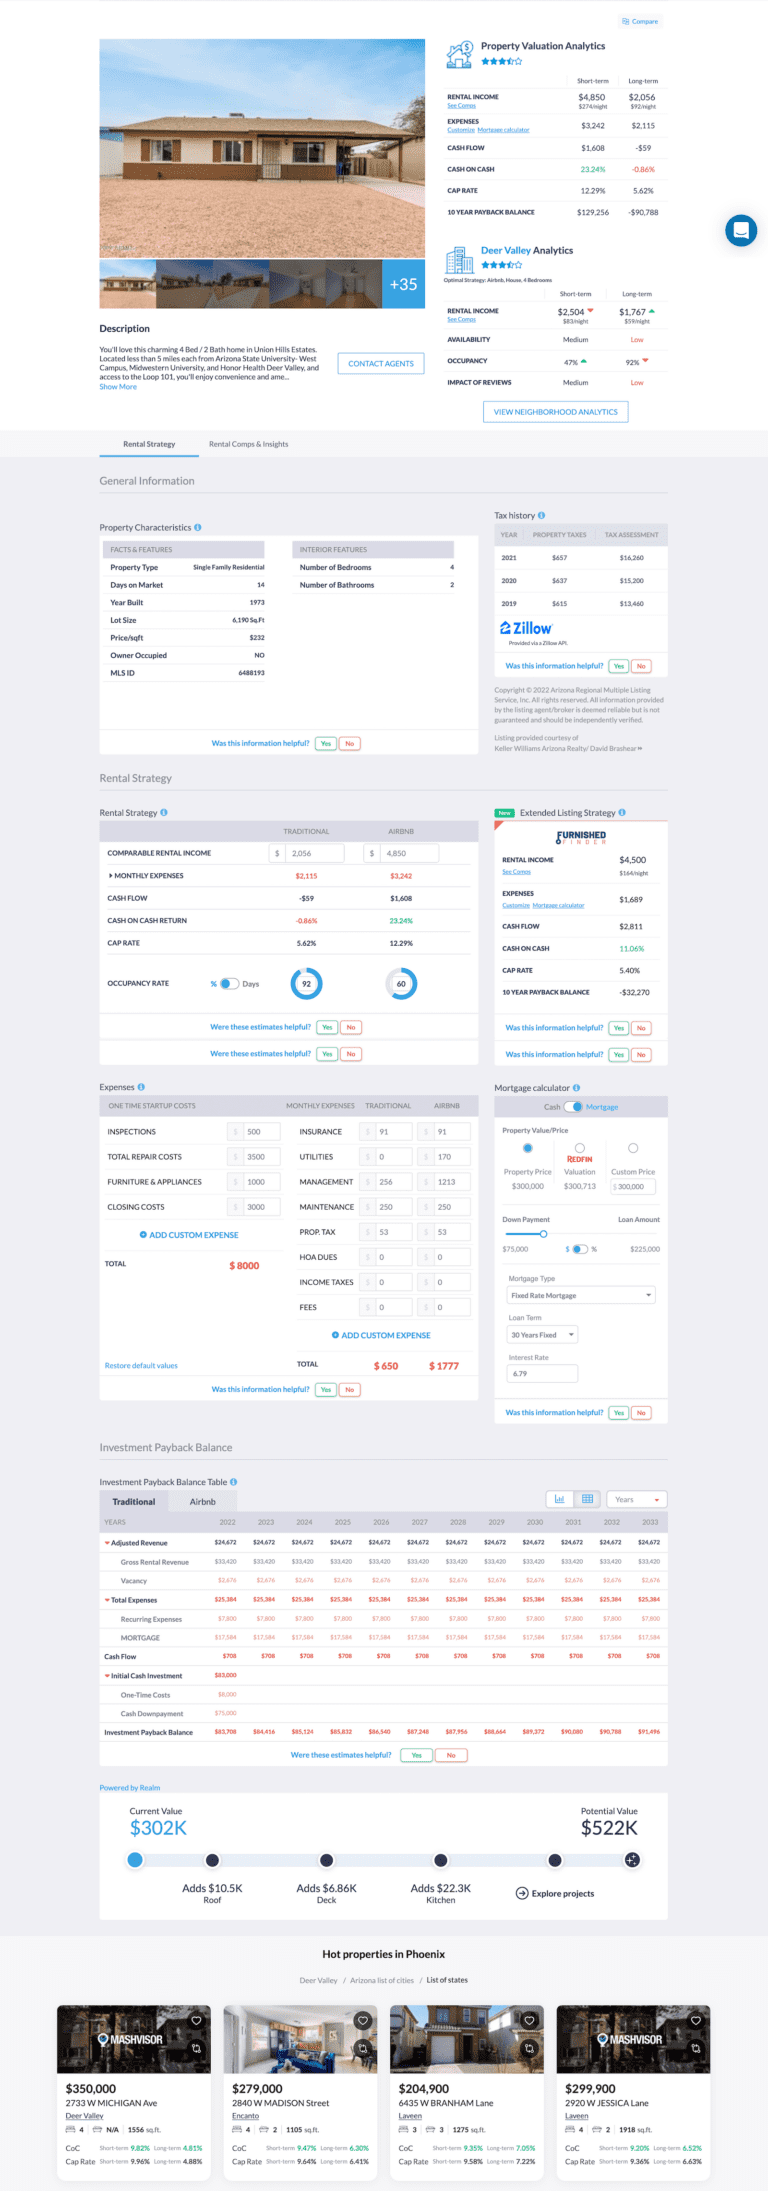
AirDNA vs. BNBcalc: which is better?
When it comes to Airbnb revenue calculators, two names consistently rise to the top: AirDNA Rentalizer and BNBcalc. Both aim to predict short-term rental income, but they differ significantly in their approach, data sources, and the insights they provide. Understanding these differences is key to choosing the right tool for your needs.
AirDNA, a well-established player in the vacation rental analytics space, bases its calculations on data scraped directly from Airbnb and Vrbo listings. Their Rentalizer provides detailed reports on occupancy rates, average daily rates, and revenue potential for specific properties. They focus heavily on comparative market analysis, showing you how your property stacks up against similar listings in the area. AirDNA offers a tiered subscription model, with pricing varying based on the level of data access and features you require.
BNBCalc, on the other hand, pulls data from a variety of sources, including publicly available listing information and proprietary data sets. BNBcalc emphasizes ease of use and a quick, straightforward revenue projection. They offer a free calculator with limited functionality, as well as paid subscriptions for more in-depth analysis. A notable partnership with Steadily Insurance offers customers access to specialized insurance coverage for short-term rentals.
The reports generated by AirDNA tend to be more detailed and comprehensive, focusing on market trends and competitive analysis. You can see detailed seasonality charts and understand how demand fluctuates throughout the year. BNBcalc’s reports are generally more concise, providing a quick snapshot of potential earnings. Both calculators allow you to adjust key inputs, such as nightly rate and occupancy, to see how they impact your projections.
AirDNA's strength lies in its breadth of data and its ability to benchmark against comparable properties. However, this comes at a cost – their subscriptions can be relatively expensive. BNBcalc offers a more affordable entry point, particularly for casual investors. It’s important to note that both calculators rely on historical data and projections; actual results can vary significantly depending on market conditions and property management.
Travel and Real Estate Technology Stocks Comparison
Current market data for short-term rental and travel booking platforms - December 2024
| Asset | Current Price | 24h | 7d | 30d | Market Cap |
|---|---|---|---|---|---|
| Airbnb Inc ABNB | $132.45 | +1.8% | +3.2% | +8.7% | $87.2B |
| Booking Holdings Inc BKNG | $4,287.90 | +0.9% | +2.1% | +5.4% | $154.8B |
| Expedia Group Inc EXPE | $178.32 | -0.7% | +1.5% | +12.3% | $23.4B |
| TripAdvisor Inc TRIP | $14.67 | -2.1% | -1.8% | +6.9% | $2.0B |
| Redfin Corporation RDFN | $8.94 | +2.3% | +4.7% | +15.2% | $1.1B |
Analysis Summary
Booking Holdings dominates by market cap ($154.8B) despite recent modest gains, while Airbnb shows strong momentum with +8.7% monthly growth. Redfin leads in recent performance with +15.2% monthly gains, reflecting real estate market recovery. TripAdvisor remains the smallest player at $2.0B market cap.
Key Insights
- Booking Holdings maintains market leadership with highest absolute stock price ($4,287.90) and largest market capitalization
- Airbnb demonstrates strong growth trajectory with consistent positive performance across all timeframes
- Redfin shows highest monthly volatility (+15.2%) as real estate technology sector recovers from previous downturns
- TripAdvisor faces headwinds with negative short-term performance despite positive monthly gains
Note: VRBO is a subsidiary of Expedia Group and does not trade as a separate public entity. Prices reflect recent market conditions and typical trading ranges for these travel and real estate technology stocks.
Disclaimer: Stock prices are highly volatile and subject to market fluctuations. Data is for informational purposes only and should not be considered investment advice. Always do your own research before making investment decisions.
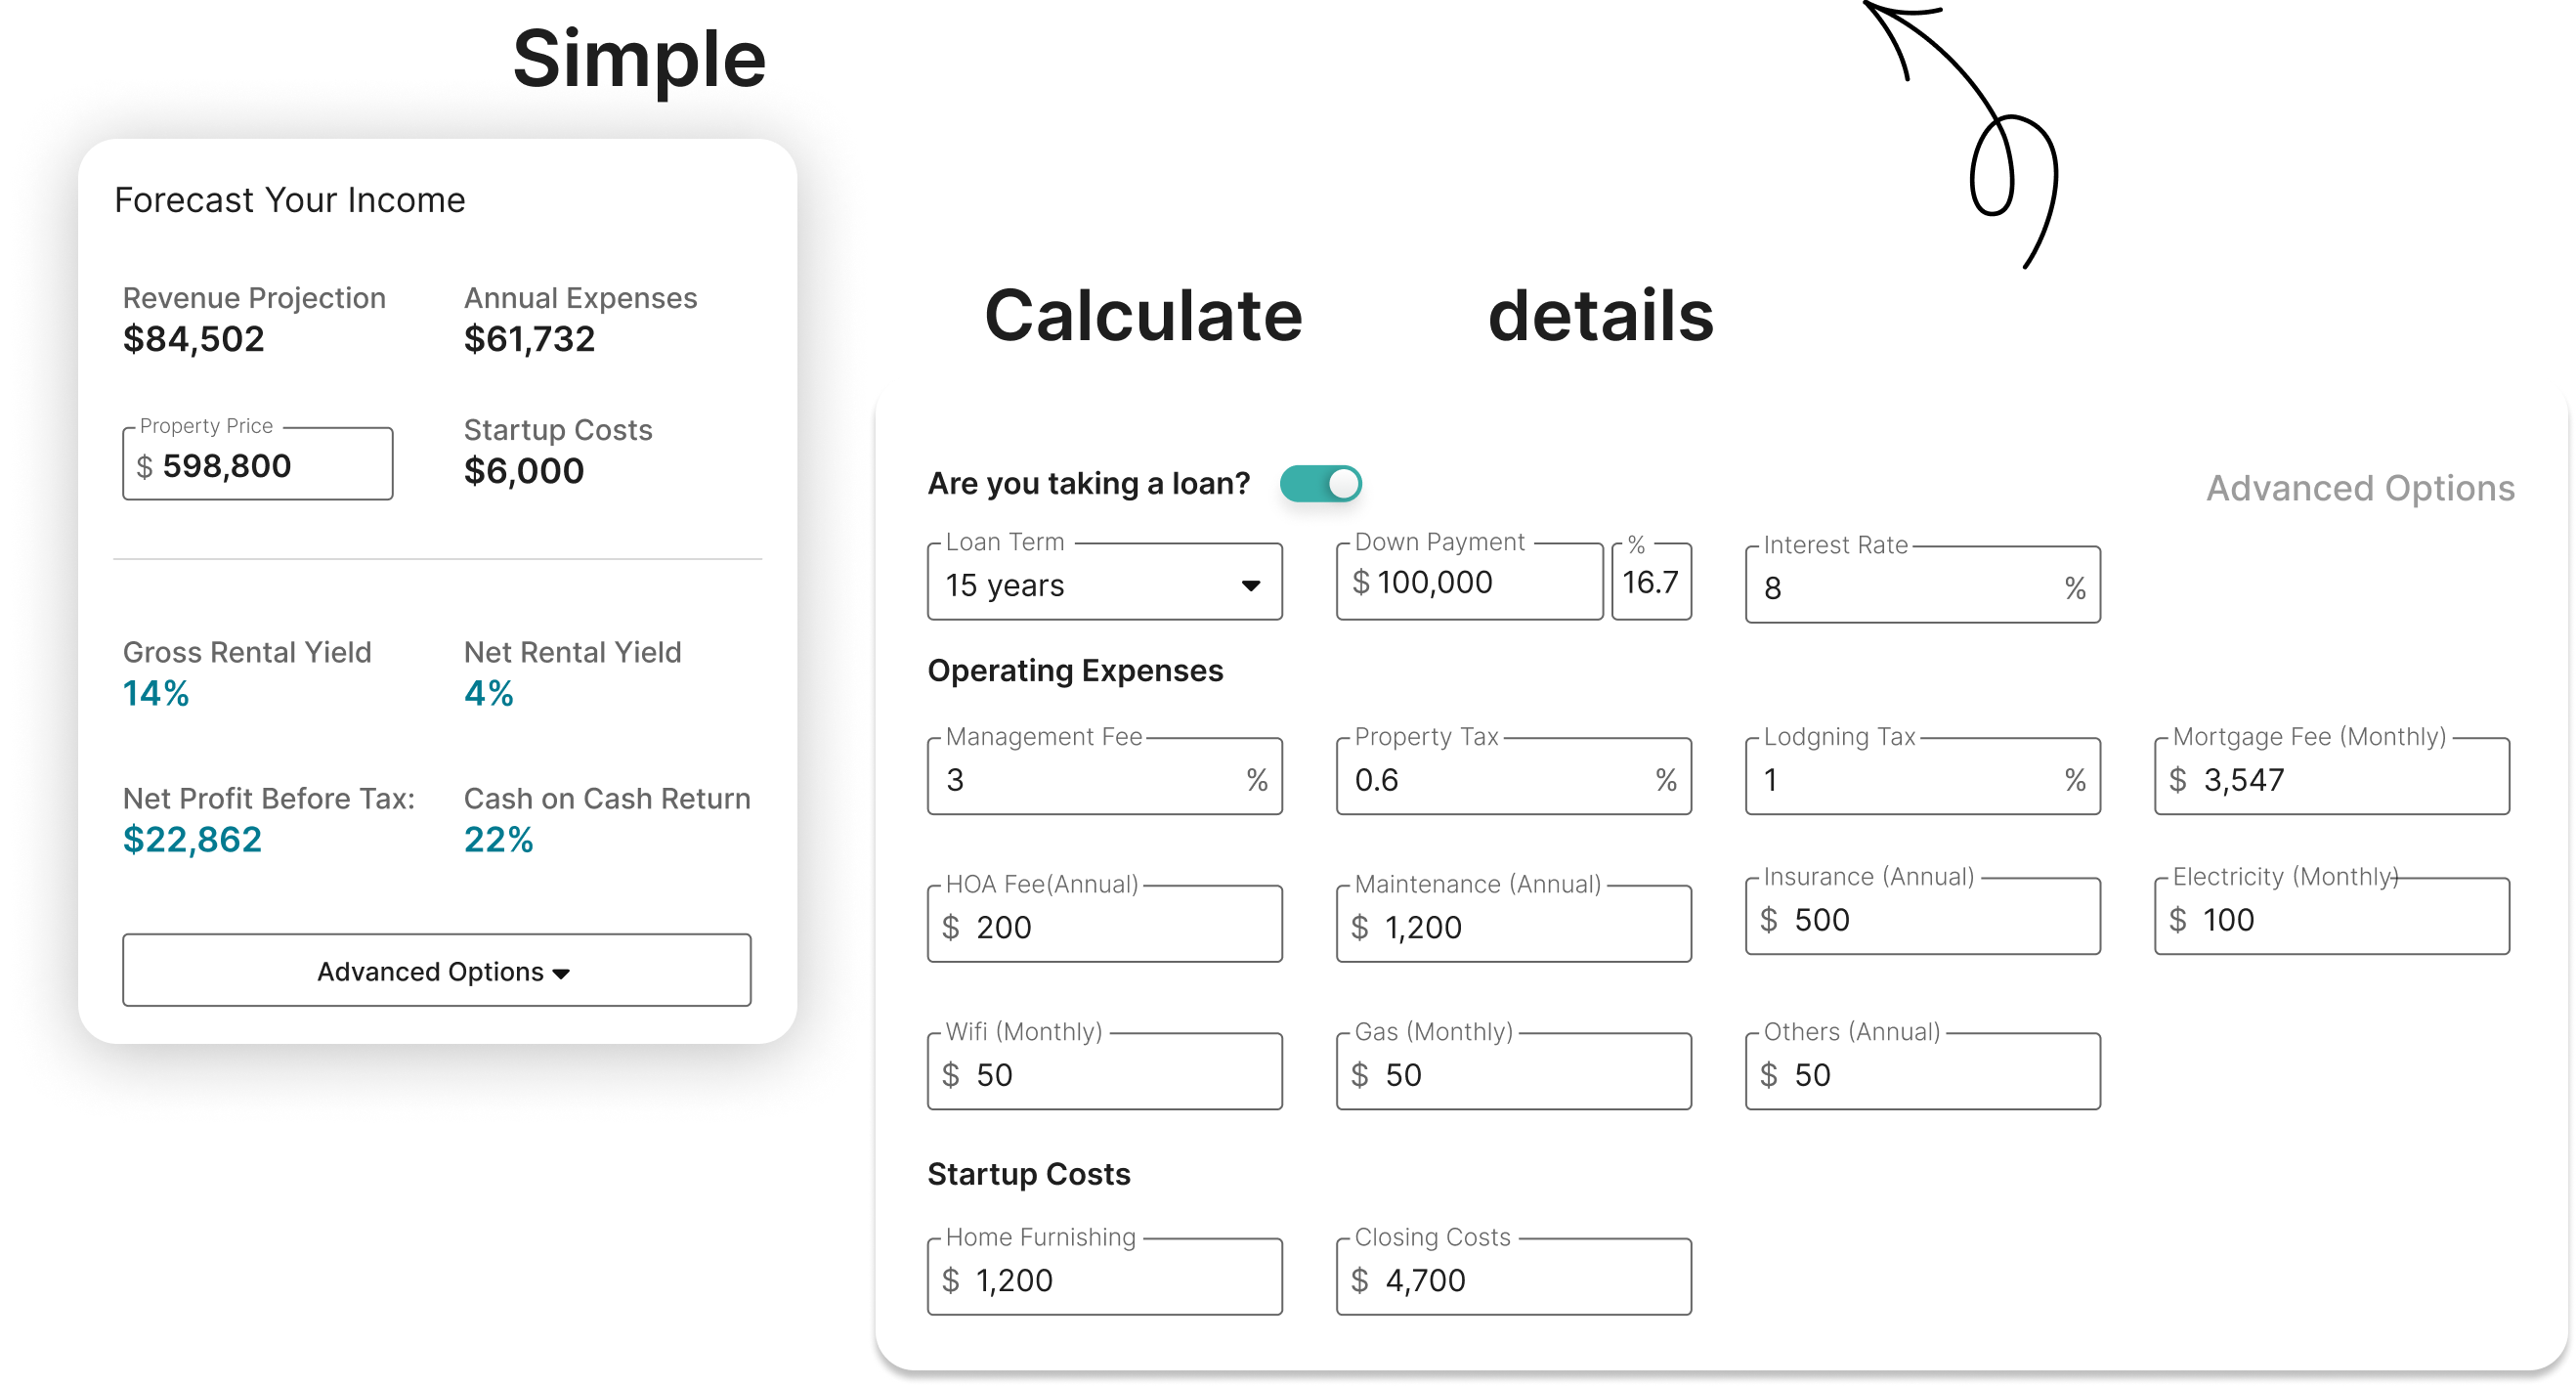
Key Metrics to Input for Accurate Projections
Calculators are only as good as your inputs. If you guess on your local taxes or maintenance costs, the final number is useless. You have to be honest about what your property actually offers compared to the house next door.
At a minimum, you’ll need to specify the property type (house, apartment, condo, cabin, etc.), location (down to the neighborhood level), and the number of bedrooms and bathrooms. These fundamental characteristics heavily influence demand and pricing. A two-bedroom condo in a popular tourist destination will naturally command a higher rate than a studio apartment in a less desirable area.
Amenities are also crucial. A pool, hot tub, or proximity to attractions can significantly increase your property's appeal and justify a higher nightly rate. Be sure to accurately list all amenities offered, from Wi-Fi and air conditioning to fully equipped kitchens and laundry facilities. Don’t overestimate – guests will be disappointed if an advertised amenity is missing.
Your nightly rate, cleaning fee, and any other fees (security deposit, pet fee, etc.) are direct inputs into the calculation. Research comparable listings in your area to determine a competitive and realistic pricing strategy. Seasonality plays a huge role; adjust your rates based on peak and off-peak seasons. Local regulations, such as short-term rental restrictions or permit requirements, must also be considered, as they can impact your ability to rent your property.
- Property Type: House, apartment, condo, etc.
- Location: Specific neighborhood or area
- Bedrooms/Bathrooms: Number of each
- Amenities like pools or fast Wi-Fi
- Nightly Rate: Competitive pricing for your area
- Cleaning Fee: Accurate cost of cleaning
- Seasonality: Adjust rates based on demand
- Local Regulations: Permits, restrictions, etc.
Decoding the Output: What the Numbers Mean
Once you’ve inputted your data, the Airbnb revenue calculator will generate a series of outputs. Understanding these numbers is critical to making informed investment decisions. The most important metrics to focus on are projected occupancy rate, average daily rate (ADR), and revenue per available room (RevPAR).
The projected occupancy rate estimates the percentage of nights your property is expected to be booked. The ADR represents the average price you’ll charge per night. RevPAR, as discussed earlier, combines these two metrics to give you a comprehensive view of revenue performance. A higher RevPAR indicates a more profitable property.
The calculator will also provide a projection of your potential gross revenue – the total income generated from rentals before expenses. However, this is only half the picture. To get a realistic understanding of your profitability, you need to calculate your potential net revenue, which accounts for all expenses.
Expenses can include mortgage payments, property taxes, insurance, maintenance costs, property management fees, utilities, and cleaning fees. Be thorough and conservative when estimating your expenses. It’s better to underestimate your income and overestimate your expenses than the other way around. Remember that unexpected repairs and maintenance issues are inevitable.
Don’t treat these projections as gospel. They are estimates based on historical data and assumptions. Adjust your projections based on real-world factors and your own due diligence. Consider the condition of your property, the quality of your furnishings, and the level of competition in your area.
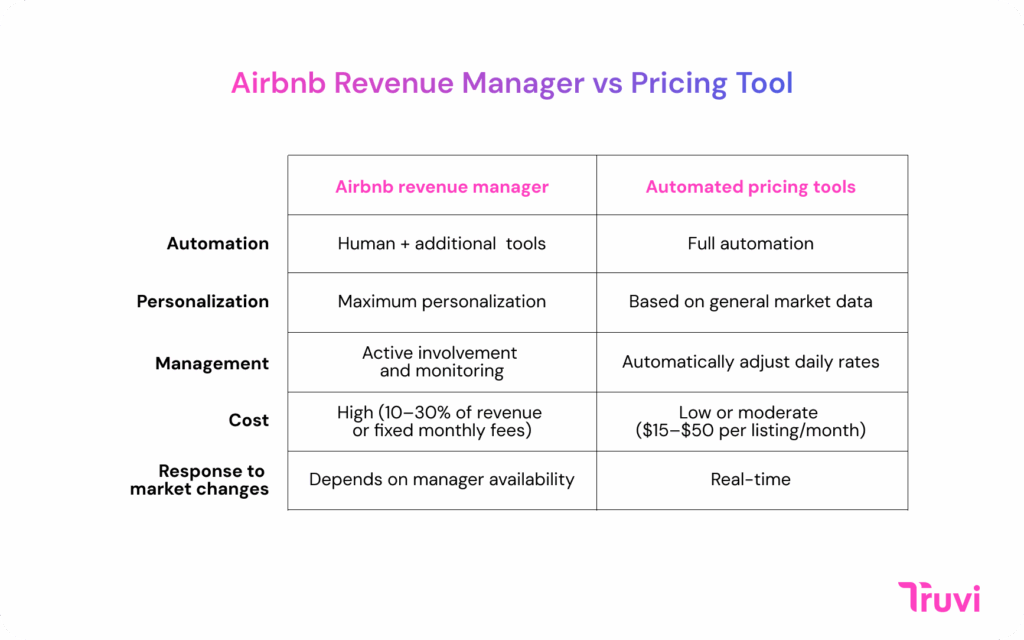
Beyond the Calculator: Optimizing for Higher Revenue
An Airbnb revenue calculator is a powerful tool, but it’s only the starting point. Simply knowing your potential income doesn’t guarantee success. You need to actively optimize your listing and management strategies to maximize your revenue. This means going beyond the numbers and focusing on the guest experience.
Dynamic pricing is essential. Adjust your nightly rates based on demand, seasonality, and local events. Utilize tools that automatically adjust prices based on market conditions. Professional photography is a must. High-quality photos can dramatically increase your listing’s appeal and attract more bookings. Don’t skimp on this investment.
Your listing description should be compelling and accurate. Highlight your property’s unique features and benefits. Respond to guest inquiries promptly and professionally. Excellent customer service is key to earning positive reviews and repeat bookings. Reviews are incredibly influential – positive reviews build trust and increase occupancy.
Consider the impact of seasonality and local events. During peak seasons and major events, demand will be higher, allowing you to charge premium rates. Conversely, be prepared to lower your rates during off-peak seasons to attract bookings. Understanding your local market is crucial.
Don't neglect the small details. Provide thoughtful amenities, such as coffee, tea, and toiletries. Ensure your property is clean, well-maintained, and comfortable. A positive guest experience is the best marketing you can ask for. Think about creating a welcome book with local recommendations.
What 2026 looks like for hosts
The short-term rental market is constantly evolving, and 2026 is likely to bring new trends and challenges. The rise of remote work and "bleisure" travel – blending business and leisure – is expected to continue, driving demand for longer stays and properties with dedicated workspaces. Expect to see calculators factoring in longer-stay discounts and amenities.
Demand for unique accommodations, such as glamping sites, tiny homes, and boutique hotels, is also on the rise. These properties often command premium rates and attract a different type of traveler. Data analytics will become even more sophisticated, with AI-powered pricing tools that can dynamically adjust rates based on real-time market conditions and individual guest preferences.
Increased regulation is a significant trend. More cities and municipalities are implementing restrictions on short-term rentals, such as permitting requirements, occupancy limits, and zoning regulations. Revenue calculators will need to incorporate these regulations to provide accurate projections. Staying compliant is paramount.
We’ll likely see greater emphasis on sustainability and eco-friendly travel. Guests are increasingly seeking out properties that prioritize environmental responsibility. Highlighting sustainable practices in your listing can attract environmentally conscious travelers. Data on energy efficiency and water conservation may become more prominent in future calculators.
Austin Short-Term Rental Market Revenue Price Prediction 2026
Bull / Base / Bear scenario analysis
| Timeframe | Bull Case | Base Case | Bear Case | Key Driver |
|---|---|---|---|---|
| 1 Month | $3,360/month | $3,232/month | $3,072/month | SXSW season demand surge and spring tourism |
| 3 Months | $3,520/month | $3,328/month | $2,944/month | Formula 1 Austin Grand Prix and summer festival season |
| 6 Months | $3,680/month | $3,456/month | $2,880/month | Tech sector growth and Austin City Limits impact |
| 1 Year | $3,840/month | $3,584/month | $2,720/month | Population growth, corporate relocations, and regulatory environment |
Price Prediction Summary
Austin's STR market shows moderate growth potential driven by tech industry expansion and major events, though regulatory pressures and increased supply may limit upside. Base case projects 12% annual growth, while bull scenario assumes 20% growth from strong tourism recovery.
Key Factors Affecting Austin Short-Term Rental Market Revenue Stock Price
- Austin's tech hub status and corporate relocations
- Major events (SXSW, F1, ACL) driving seasonal demand
- City regulatory policies on short-term rentals
- Housing supply constraints and construction costs
Disclaimer: Predictions are speculative and not financial advice. Stock price predictions are based on current market analysis and may vary significantly due to market volatility, economic conditions, and other unpredictable factors. Always do your own research before making investment decisions.

No comments yet. Be the first to share your thoughts!