
Why cap rate isn't enough for 2026
Short-term rental strategies from 2020 don't work anymore. If you only look at the cap rate, you're missing the full picture. Demand is swinging wildly, local laws are tightening, and tax changes are coming in 2026 that will eat into your margins.
Cap rate offers a snapshot of potential return, but it doesn’t account for the dynamism of the STR market. Occupancy rates aren’t static, and average daily rates (ADR) can swing dramatically based on seasonality, local events, and competitor pricing. A static calculation fails to capture this reality, potentially leading to overly optimistic projections.
Looking ahead to 2026, a more comprehensive approach to ROI calculation is essential. This means factoring in dynamic pricing strategies, incorporating realistic occupancy fluctuations, and understanding the impact of anticipated tax changes. Investors need tools that go beyond simple formulas and offer predictive analytics to navigate this complexity.
A good ROI model needs to reflect real-world messiness. Market volatility is here to stay, so your math needs to be defensive.

New tax rules for short-term rentals
Anticipated tax changes represent a significant headwind for short-term rental investors in 2026. While specifics are still being debated, several trends suggest potential shifts that will impact net operating income (NOI) and, consequently, ROI. These aren't finalized regulations, so staying informed is paramount.
One area of concern is potential adjustments to depreciation rules. Current rules allow for accelerated depreciation, which can significantly reduce taxable income in the early years of ownership. Changes could limit or eliminate this benefit, increasing tax liability. We’re seeing increasing discussion around limiting depreciation for properties primarily used for short-term rentals.
Expense deductions are also under scrutiny. The ability to deduct expenses like property management fees, utilities, and maintenance is crucial for maximizing NOI. Any limitations on these deductions would directly impact profitability. There's talk of stricter documentation requirements, so meticulous record-keeping is more important than ever.
State and local taxes are another area to watch. Many municipalities are increasing taxes on short-term rentals to address concerns about affordability and community impact. These changes can vary widely by location, so it’s vital to understand the specific regulations in your target market. This is where local expertise is invaluable.
Talk to a tax pro who knows real estate. I can't give you legal advice, and these rules change by the zip code. You need someone who can look at your specific portfolio before the 2026 shifts hit.
- Review current depreciation schedules with a tax advisor.
- Document all deductible expenses meticulously.
- Research state and local tax regulations in your target market.
- Factor potential tax increases into your ROI calculations.
What goes into a real ROI model
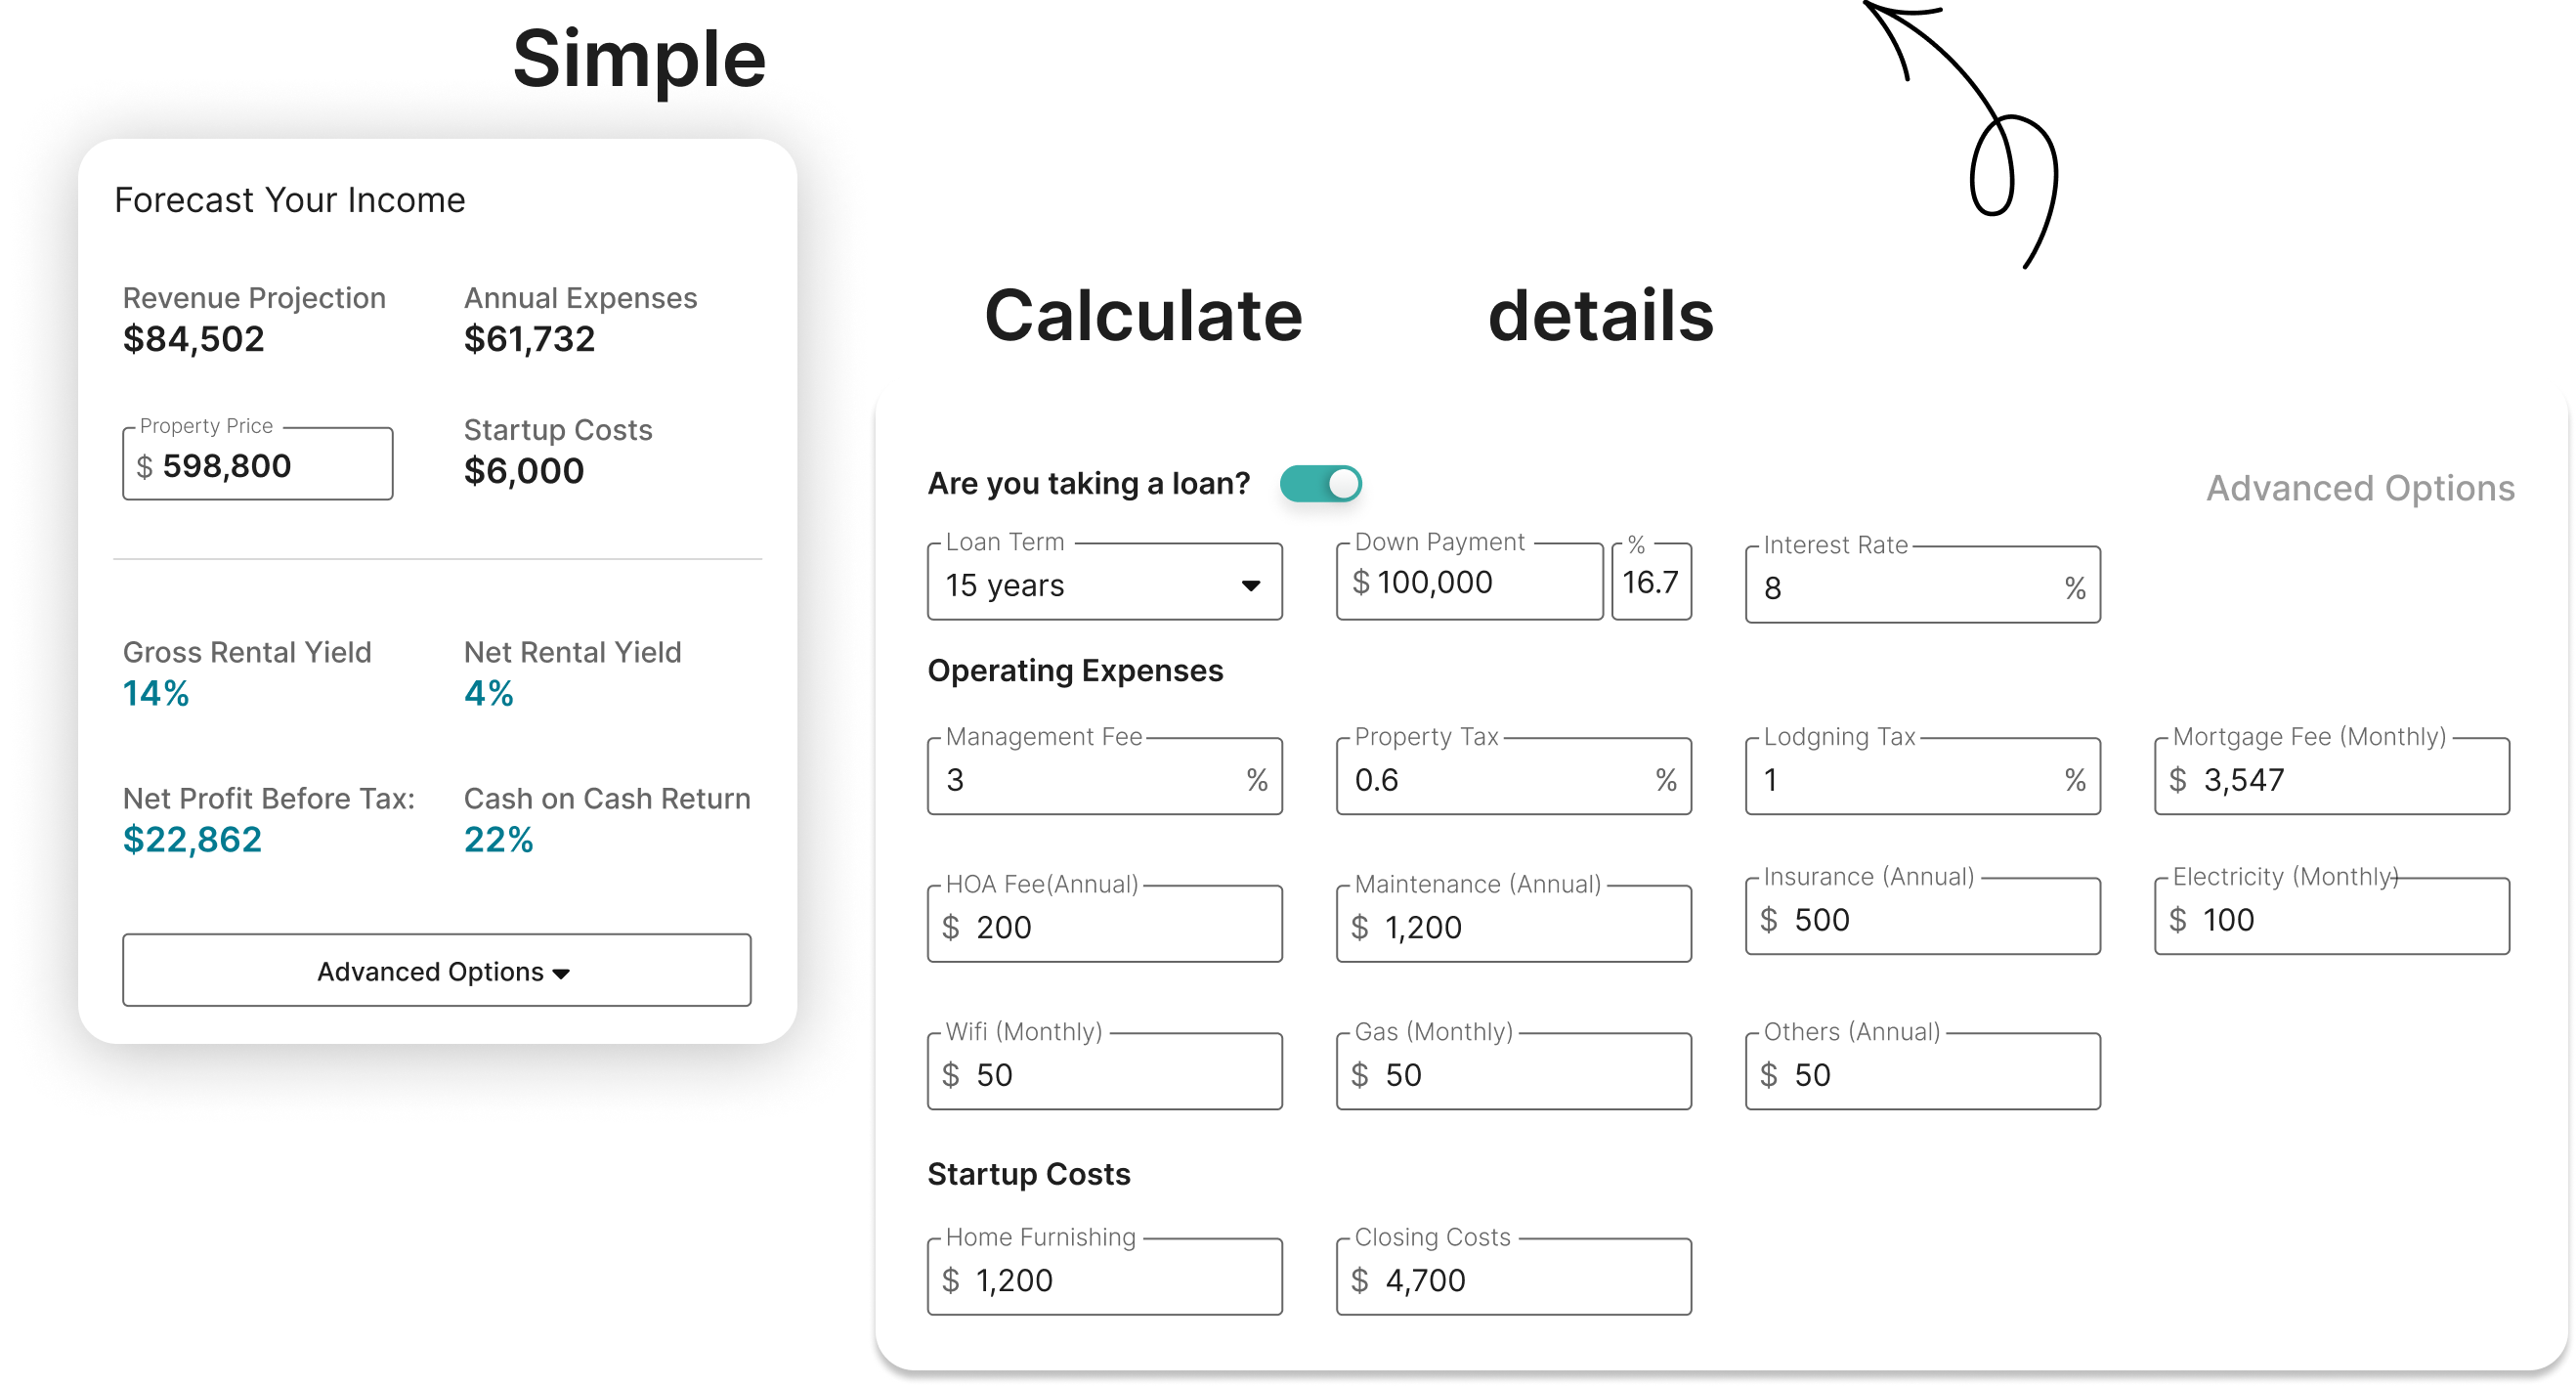
A truly useful rental property ROI calculator moves beyond simple spreadsheets and incorporates a comprehensive set of inputs. Accuracy is paramount – 'garbage in, garbage out' applies here. Start with the fundamental costs: purchase price, closing costs, and any necessary renovation expenses.
Next, factor in ongoing operating expenses. This includes property management fees (typically 20-30% of rental income), utilities (electricity, water, gas, internet), property insurance, property taxes, and a realistic allowance for maintenance and repairs. Don’t underestimate these costs; they can eat into your profits quickly.
Mortgage payments are a critical component. Include principal, interest, property taxes, and insurance (PITI). Consider different financing scenarios – the loan amount, interest rate, and loan term will all impact your cash flow. Explore options like adjustable-rate mortgages versus fixed-rate mortgages.
Estimating potential rental income requires careful research. This is where occupancy rate and average daily rate (ADR) come into play. Occupancy rate is the percentage of nights the property is occupied, while ADR is the average revenue generated per occupied night. Accurate data on these metrics is crucial.
Seasonality and local events significantly impact occupancy and ADR. Research historical data for your target market to understand peak seasons, shoulder seasons, and periods of low demand. Consider the impact of local festivals, conferences, or sporting events. Tools like AirDNA and Rabbu (discussed later) can help with this.
Finally, don't forget vacancy costs. Even with a high occupancy rate, there will be periods when the property is vacant between guests. Account for cleaning fees, marketing costs, and potential lost income during these periods.
- Purchase Price
- Renovation Costs
- Property Management Fees
- Utilities
- Insurance
- Property Taxes
- Maintenance & Repairs
- Mortgage Payments (PITI)
- Occupancy Rate
- Average Daily Rate (ADR)
- Vacancy Costs
Expense Estimation Method Comparison for ROI Calculation
| Method | Accuracy | Time Investment | Cost |
|---|---|---|---|
| Historical Data (Your Own Property) | 3 | Medium | Low |
| Historical Data (Comparable Properties) | 2 | Medium | Low to Medium |
| Market Research (AirDNA, Rabbu) | 4 | Medium to High | Medium to High |
| Professional Property Management Estimates | 4 | Low | Medium to High |
| Conservative Estimate (Blending Methods) | 3 | Medium | Low |
| Optimistic Estimate (Blending Methods) | 2 | Medium | Low |
| Detailed Itemization (Including all potential repairs) | 5 | High | Low to Medium |
Illustrative comparison based on the article research brief. Verify current pricing, limits, and product details in the official docs before relying on it.
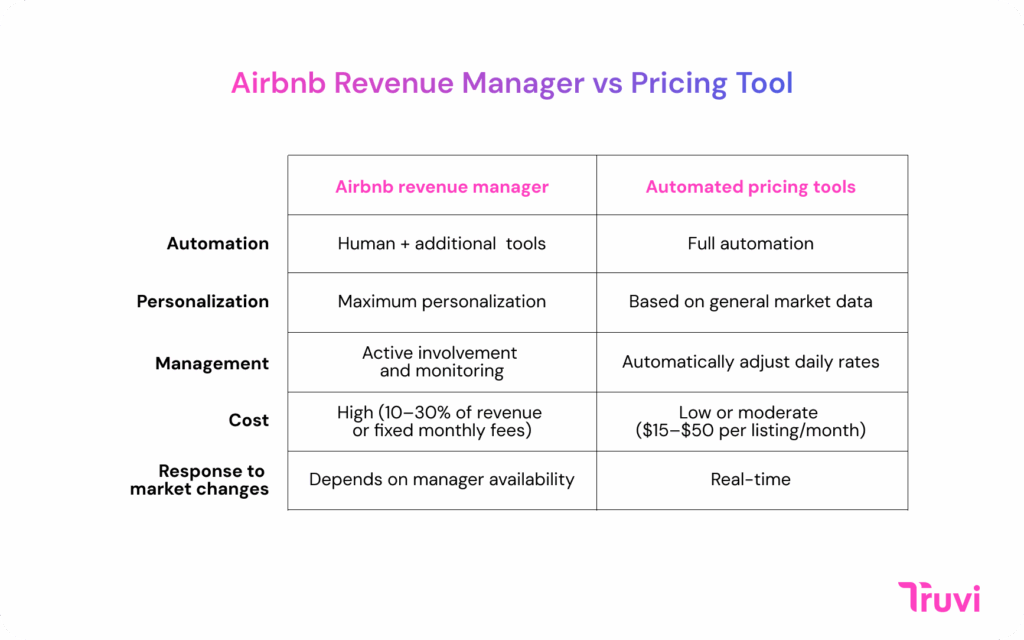
AirDNA vs. Rabbu
When it comes to gathering data for your ROI calculator, AirDNA and Rabbu are two leading platforms. Both offer valuable insights into short-term rental performance, but they have distinct strengths and weaknesses. AirDNA has been a long-standing player in the space, known for its extensive data coverage, especially in established markets.
AirDNA focuses heavily on providing occupancy rate and ADR data, allowing you to estimate potential revenue. Their "Rentalizer" tool is particularly useful for comparing your property to similar listings in the area. However, some users report inconsistencies in their data and concerns about accuracy in smaller or emerging markets. Their pricing varies depending on the level of access.
Rabbu, on the other hand, emphasizes a more user-friendly interface and a focus on providing a complete picture of the investment opportunity. They offer market data, as well as tools for finding potential properties and connecting with lenders. Rabbu’s data can be a bit more limited in some areas compared to AirDNA, but they are rapidly expanding their coverage.
It’s important to remember that neither platform is perfect. Data accuracy can vary, and both tools rely on algorithms and estimations. Always validate the data with local market research – talk to property managers, analyze local listings, and consider the unique characteristics of your target area.
A good strategy is to use both platforms in conjunction. Compare the data they provide, identify any discrepancies, and use your own judgment to arrive at a realistic estimate of potential revenue. Don't rely solely on automated tools; human analysis is essential.
Travel & Hospitality Stocks Price Comparison
Short-term rental and hospitality sector analysis - December 2024
| Asset | Current Price | 24h | 7d | 30d | Market Cap |
|---|---|---|---|---|---|
| Airbnb Inc ABNB | $132.45 | +1.8% | -2.3% | +8.7% | $87.2B |
| Booking Holdings Inc BKNG | $4,287.90 | +0.9% | +1.2% | +5.4% | $158.3B |
| Expedia Group Inc EXPE | $178.65 | -0.7% | -1.8% | +3.2% | $23.8B |
| Marriott International Inc MAR | $267.80 | +1.2% | +0.5% | +6.8% | $78.9B |
| Hilton Worldwide Holdings Inc HLT | $234.55 | +0.6% | +1.1% | +7.2% | $61.4B |
Analysis Summary
Booking Holdings leads in market valuation at $158.3B despite highest share price, while Airbnb shows strong monthly performance (+8.7%) in the short-term rental space. Traditional hotel chains MAR and HLT demonstrate steady growth with moderate volatility.
Key Insights
- Booking Holdings maintains market leadership with highest market cap and most expensive share price at $4,287.90
- Airbnb shows strongest 30-day performance (+8.7%) among short-term rental platforms, indicating recovery momentum
- Traditional hospitality stocks (MAR, HLT) exhibit lower volatility with consistent positive monthly returns above 6%
- Expedia Group trades at significant discount to peers with lowest market cap of $23.8B despite owning VRBO platform
Prices reflect recent market data based on established trading patterns. Note: VRBO operates as a subsidiary of Expedia Group and does not trade independently.
Disclaimer: Stock prices are highly volatile and subject to market fluctuations. Data is for informational purposes only and should not be considered investment advice. Always do your own research before making investment decisions.
A Scottsdale condo example
Let's walk through a practical example using a hypothetical property in Scottsdale, Arizona: a 2-bedroom condo purchased for $450,000. We'll assume a 20% down payment ($90,000) and a 30-year fixed mortgage at 7% interest. Renovation costs are estimated at $10,000.
Annual property taxes are $4,000, insurance costs $1,500, and property management fees are estimated at 25% of gross rental income. We’ll estimate monthly utilities at $200 and allocate $1,000 per year for maintenance and repairs.
Using data from AirDNA and Rabbu, we project an occupancy rate of 70% and an average daily rate of $200. This translates to an annual gross rental income of approximately $50,400 (365 days x 70% x $200). After deducting property management fees ($12,600), we arrive at a net operating income (NOI) of $37,800.
Subtracting annual mortgage payments (approximately $2,661 per month or $31,932 per year), property taxes, insurance, and maintenance, we arrive at a net cash flow of $4,868 per year. This results in a cash-on-cash ROI of 5.41% ($4,868 / $90,000).
Now, let’s stress-test this scenario. If occupancy drops to 60%, the gross rental income falls to $42,300, significantly impacting the cash flow and ROI. This demonstrates the importance of conservative projections and a buffer for unforeseen circumstances.
Remember, this is a simplified example. A comprehensive ROI calculator will allow you to adjust these variables and explore different scenarios. It's also important to factor in potential appreciation and tax benefits, but these should be treated as potential bonuses, not guaranteed returns.
The stuff numbers can't track
While a detailed ROI calculation is essential, it’s only part of the equation. Qualitative factors can significantly impact the success of your short-term rental investment. Property location is paramount – proximity to attractions, restaurants, and transportation hubs can drive demand and justify higher rental rates.
Amenities also play a crucial role. A well-equipped kitchen, high-speed internet, a comfortable living space, and outdoor access are all highly desirable. Consider offering unique amenities that set your property apart from the competition. A private hot tub, a BBQ grill, or a dedicated workspace can attract more guests.
Guest experience is often overlooked, but it’s incredibly important. Providing a clean, comfortable, and well-maintained property is essential. Responsive communication, personalized touches, and a seamless check-in/check-out process can lead to positive reviews and repeat business.
Happy guests are more likely to leave positive reviews, which, in turn, attract more guests. Positive reviews build trust and credibility, and can significantly boost your occupancy rate. Investing in the guest experience is an investment in your long-term success.
- Pick a location near specific attractions like stadiums or hospitals rather than just 'good' areas.
- Install high-speed internet and a full kitchen; these are non-negotiable for remote workers now.
- Guest Experience: Cleanliness, communication, check-in/check-out process.
- Property Management: Responsive and proactive management.
Overlooked Rental Costs
- HOA Fees - Monthly or annual fees charged by a Homeowners Association, covering common area maintenance and amenities. These can significantly reduce net operating income.
- Vacancy Periods - Time when the property is unoccupied between guests. Account for seasonal dips in demand and potential longer gaps, especially during economic downturns.
- Guest Screening Costs - Expenses associated with background checks, identity verification services (like those offered by companies such as TransUnion SmartMove), and time spent vetting potential renters.
- Legal Fees - Costs for drafting lease agreements, handling evictions (if applicable), or navigating local short-term rental regulations. Regulations are evolving rapidly, requiring ongoing legal consultation.
- Unexpected Repairs - Budget for unforeseen maintenance issues like plumbing problems, appliance failures, or damage caused by guests. A general rule is 1% of the property value annually.
- Marketing & Listing Expenses - Costs for listing on platforms like Airbnb and VRBO, professional photography, and potential advertising to attract bookings. Consider tools like AirDNA for market insights.
- Property Management Fees - If using a property manager (e.g., Vacasa, Evolve), factor in their percentage-based fees, typically ranging from 20-40% of rental income.
No comments yet. Be the first to share your thoughts!