
2026 occupancy rate trends
The short-term rental market in 2026 is no longer defined by a single national average. While aggregate occupancy rates provide a high-level snapshot of market health, they mask significant volatility driven by seasonal shifts and regional economic divergence. Investors relying on static averages risk mispricing their assets or underestimating operational costs during trough periods. The current landscape demands a granular view of performance, where occupancy is treated as a dynamic variable rather than a fixed baseline.
Data from AirDNA, which tracks over 10 million listings across 120,000 markets, indicates a stabilization phase following the post-pandemic surge. In 2026, average occupancy rates for single-family homes in major metros hover between 62% and 68%, depending on the quarter. This represents a normalization from the 75%+ peaks seen in 2021-2022. The variance is not random; it correlates directly with local regulatory environments and supply saturation. Markets with strict short-term rental ordinances, such as parts of New York City and San Francisco, show artificially suppressed occupancy due to legal constraints, while secondary markets like Austin and Nashville demonstrate more organic, albeit slower, growth trajectories.
Seasonality has also become more pronounced. The traditional "shoulder seasons" of spring and fall are shrinking, with demand concentrating heavily in summer and winter holiday windows. This compression requires hosts to adjust pricing strategies more aggressively. A property that maintained steady occupancy in 2023 may see a 15-20% drop in bookings during non-peak months in 2026 if dynamic pricing tools are not actively managed. Understanding these micro-trends is essential for accurate revenue forecasting.
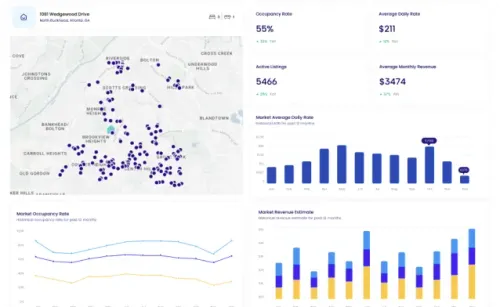
The chart above illustrates the volatility inherent in market metrics. While this specific chart displays tech sector performance as a proxy for market sensitivity, the principle of tracking trend lines over time applies equally to STR occupancy data. Investors should monitor local market dashboards from primary data providers like AirDNA or Rabbu to identify these inflection points before committing capital. Relying on lagging indicators can result in entering saturated markets just as occupancy rates begin to decline.
Adjusting Pricing and Length of Stay
Airbnb market data reveals that static pricing leaves significant revenue on the table, particularly in markets with fluctuating demand. Investors can capture this upside by implementing dynamic pricing strategies that respond to real-time occupancy trends and seasonal shifts. According to AirROI, which tracks over 20 million properties, dynamic pricing tools can increase revenue by 10-15% compared to static rates in volatile markets. This approach requires continuous monitoring of local Airbnb market data to adjust nightly rates based on upcoming events, competitor availability, and historical booking patterns.
Beyond nightly rates, length-of-stay adjustments play a critical role in maximizing net operating income. Shorter stays often incur higher per-night cleaning and turnover costs, while longer stays may leave money on the table during peak seasons. By analyzing occupancy data, hosts can set minimum stay requirements that filter out low-value bookings during high-demand periods. This strategy smooths out revenue gaps and reduces operational friction, ensuring that the property remains profitable even when overall occupancy dips.
The integration of these levers transforms raw market data into actionable revenue optimization tactics. Instead of relying on intuition, investors use precise metrics to determine the optimal price point and stay duration for any given week. This data-driven discipline is essential for maintaining competitive ROI in an increasingly crowded short-term rental market.
Top analytics platforms compared
Choosing the right data stack depends on whether you prioritize raw API access, broad market coverage, or cost efficiency. The following comparison outlines four leading platforms based on data depth, pricing structure, API availability, and primary use cases.
AirDNA remains the industry standard for market benchmarking, offering the most extensive historical dataset for Airbnb and Vrbo properties across 120,000 markets. Its strength lies in standardized metrics that allow investors to compare performance across different regions with high confidence. For developers needing to embed this data into proprietary tools, AirROI provides a robust API backed by over 20 million tracked properties, making it a preferred choice for technical stacks.
For investors focused strictly on the United States market, Rabbu offers a streamlined, free entry point for checking occupancy rates and revenue projections without a subscription. Airbtics distinguishes itself by providing three years of daily historical data, which is particularly useful for identifying seasonal trends and long-term market shifts rather than just current snapshots. Selecting the right tool requires aligning these capabilities with your specific investment strategy and technical resources.
Calculating true rental property roi
Most investors start with gross revenue, but that number is a misleading anchor. A property listed for $3,000 a month does not generate $3,000 in profit. To calculate true rental property roi, you must strip away the friction costs that erode cash flow before the money ever hits your bank account.
Start by determining your net operating income (NOI). Subtract all operating expenses from your gross income. These expenses include property management fees, cleaning costs, utilities, insurance, and maintenance reserves. For short-term rentals, vacancy rates are also a critical deduction. Unlike long-term leases, short-term occupancy fluctuates. Use data from Inside Airbnb to estimate realistic occupancy rates for your specific neighborhood rather than relying on platform averages.
Once you have the NOI, subtract your debt service. This is your monthly mortgage payment. The result is your monthly cash flow. To find the cash-on-cash return, divide the annual cash flow by the total cash invested. The total cash invested includes your down payment, closing costs, and initial renovation or furnishing expenses. This metric shows the actual yield on the capital you put in, not just the property's total value.
Gross revenue looks impressive on a listing page, but net cash flow is what keeps the lights on. A property with high revenue but high expenses might return less than a modest property with low overhead. Focus on the bottom line. If the numbers don't work after deducting every cost, the investment is not viable, regardless of how high the occupancy rate appears.
No comments yet. Be the first to share your thoughts!