
Current occupancy trends in top markets
Occupancy rates across the short-term rental sector are stabilizing after the volatility of the post-pandemic surge. While national averages have plateaued, specific top-tier markets are showing resilience or modest growth, indicating a shift toward more predictable, long-term demand rather than speculative spikes. Investors analyzing ROI must look beyond aggregate national data to identify these regional divergences.
Data from AirDNA, which tracks over 10 million listings across 120,000 markets, highlights this bifurcation. Markets with strong year-round appeal—such as urban centers with business travel demand or cities with distinct seasonal peaks—are maintaining occupancy levels above 60-65%. In contrast, markets heavily reliant on leisure-only tourism are seeing softer numbers as travelers adjust their spending habits. This divergence is critical for understanding where cash flow remains robust.
The following chart illustrates the historical occupancy rate trends for the top five US markets over the last 24 months. This data, sourced from AirDNA, reveals how these leading markets have managed to sustain higher utilization rates compared to broader national trends, providing a clearer picture of where current market strength lies.
Calculating true rental property roi
Gross revenue tells you what the market is willing to pay; net operating income tells you what the property actually earns. To calculate true rental property ROI, you must strip away the noise of top-line bookings and focus on the cash that remains after operational drag. This shift in perspective is the difference between a hobby and a business.
The foundation of this calculation is Net Operating Income (NOI). Unlike gross revenue, which is simply the sum of all nightly rates, NOI deducts all variable and fixed operating expenses. This includes cleaning fees paid to vendors, utilities, internet, property management commissions, and routine maintenance. It does not, however, include debt service (mortgage payments). By isolating NOI, you establish a clear view of the property's operational efficiency independent of how it is financed.
Once you have the NOI, you can determine the cash-on-cash return. This metric measures the annual pre-tax cash flow relative to the actual cash invested. The formula is straightforward:
Cash-on-Cash Return = (Annual Pre-Tax Cash Flow / Total Cash Invested) × 100
The "Total Cash Invested" is often the most misunderstood variable. It is not just the down payment. It includes closing costs, initial furniture and furnishing costs, licensing fees, and any immediate repairs needed to make the property rentable. Ignoring these upfront costs inflates your perceived ROI and leads to poor capital allocation decisions.
Occupancy is the primary lever that moves both NOI and cash flow. A 10% increase in occupancy does not result in a 10% increase in profit because fixed costs remain constant. Instead, it improves the margin on every additional night. For example, if your monthly fixed costs are $2,000 and your average nightly rate is $200, you need 10 nights of occupancy just to break even on fixed costs. Every night beyond that contributes directly to your NOI, assuming variable costs (like cleaning) are covered by the nightly rate.
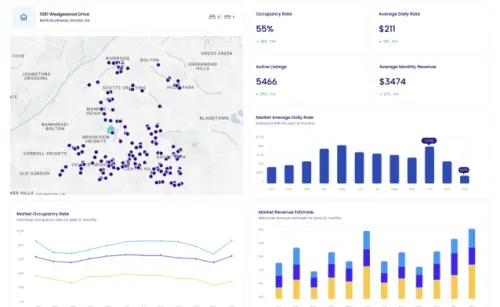
To see how current market rates and occupancy levels are influencing these metrics in real time, you can track live performance data for specific markets. The widget below provides a snapshot of current average daily rates and occupancy trends for a sample high-performing market, helping you benchmark your own property's potential against actual market conditions.
Compare Short-Term Rental Analytics Tools
Selecting the right data platform depends on your need for historical depth, API integration, and pricing structure. AirDNA, Rabbu, and Airbtics each serve different segments of the investor market, from individual hosts to large-scale portfolio managers.
AirDNA remains the industry standard for broad market coverage, tracking over 10 million properties across 120,000 markets. Its strength lies in its extensive user base and consistent data updates, making it ideal for high-level market analysis. Rabbu offers a compelling free tier for U.S. markets, providing real-time occupancy and revenue projections without a paywall for basic insights. Airbtics distinguishes itself with a three-year historical dataset available at a daily frequency, catering to investors who require granular trend analysis for underwriting.
The following comparison highlights the core differences in data depth, access methods, and cost structures to help you align the tool with your specific investment workflow.
| Platform | Coverage | API Access | Pricing Model | Historical Data |
|---|---|---|---|---|
| AirDNA | 120K+ markets, 10M+ properties | Enterprise/Pro tiers | Freemium, paid plans start ~$99/mo | Limited free history, paid access for longer trends |
| Rabbu | U.S. markets focus | Available on paid plans | Free core tools, paid for advanced features | Real-time focus, limited deep history |
| Airbtics | Global markets | Full API access included | Subscription-based, tiered by units | 3 years of daily data included |
Adjust nightly rates using market signals
Dynamic pricing transforms static listings into responsive revenue engines. Instead of setting a fixed rate for the year, you adjust nightly prices based on real-time fluctuations in local demand, competitor availability, and upcoming events. This approach ensures you capture maximum value during peak periods while remaining competitive when demand softens.
The core mechanism relies on three primary data inputs: local occupancy trends, competitor average daily rates (ADR), and seasonality patterns. Tools like AirROI track over 20 million properties to provide these benchmarks, allowing hosts to see exactly how their pricing compares to similar listings in their immediate vicinity. By aligning your rates with these market signals, you avoid leaving money on the table during high-demand weeks or pricing yourself out during lulls.
To implement this effectively, integrate your listing with a pricing tool that automates adjustments. These platforms analyze historical data and current market conditions to suggest optimal rates daily. Regularly review the performance metrics to ensure the algorithm is responding correctly to local events, such as concerts or conferences, which can cause temporary spikes in demand that standard seasonality models might miss.
Frequently asked questions about market data
Understanding how to interpret occupancy rates and revenue metrics is essential for accurate ROI calculations. While raw data provides a snapshot of performance, contextualizing these numbers against local regulations and seasonal trends reveals the true profitability of a listing.
What is the 25 rule on Airbnb?
The "25 rule" refers to Airbnb's policy allowing hosts to set a minimum age requirement for guests. In the United States, hosts may require the primary booker to be at least 25 years old. This rule must be applied uniformly to all prospective guests and clearly communicated in the listing details before booking to avoid discrimination claims.
How do I calculate true ROI for an Airbnb?
True ROI requires subtracting all operational costs from net operating income (NOI). Start with gross rental income, then deduct property management fees, cleaning costs, utilities, insurance, and maintenance. Finally, account for depreciation and taxes. Dividing the annual NOI by your total initial investment (purchase price + renovations) gives you the cash-on-cash return, a more accurate metric than gross revenue alone.
Why do occupancy rates fluctuate so much?
Occupancy is driven by seasonality, local events, and pricing strategy. A 70% occupancy rate in a high-demand tourist destination may yield higher profits than 90% in a low-demand area. Use dynamic pricing tools to adjust rates based on local event calendars and competitor activity, ensuring you capture peak revenue without deterring bookings during off-peak periods.
What is the difference between occupancy and revenue?
Occupancy measures the percentage of nights booked, while revenue reflects the actual income generated. High occupancy does not always mean high revenue if nightly rates are too low. Conversely, high rates with low occupancy can result in lower total income. The goal is to optimize the balance, often referred to as Revenue Per Available Room (RevPAR), to maximize overall profitability.
No comments yet. Be the first to share your thoughts!