
Why occupancy rates drive rental property roi
Most new short-term rental investors fixate on the nightly rate. They chase the perfect listing photo or the highest possible price per night, assuming that maximizing revenue per booking is the only path to profit. This approach misses the fundamental math of the business: a high rate means nothing if the calendar sits empty.
Occupancy is the primary variable for ROI because it dictates cash flow consistency. A property booked at 70% capacity with a moderate daily rate often outperforms a luxury unit sitting at 40% occupancy with a premium price tag. The empty nights are not neutral; they are active drains on your return, covering fixed costs like mortgage payments, property taxes, and insurance without generating any income to offset them.
Think of nightly rates as the throttle and occupancy as the engine. You can press the throttle all the way down, but if the engine isn’t turning, you aren’t going anywhere. In 2026, market volatility means relying on peak-season spikes is a risky strategy. Sustainable ROI comes from a steady stream of bookings that covers your baseline expenses and builds equity over time.
Data platforms like AirDNA and Mashvisor track millions of listings to show this correlation clearly. Their analytics reveal that properties with consistent year-round occupancy tend to have more predictable cash flows, which lenders favor and investors rely on for long-term growth. Tracking occupancy trends helps you identify markets where demand is stable, not just sporadically high.
When you analyze market data, look for the intersection of rate and volume. The sweet spot is rarely the highest rate or the highest occupancy alone, but the balance where total annual revenue is maximized relative to operating costs. Ignoring occupancy data leads to overestimating potential income and underestimating the risk of vacancy. For high-stakes investment decisions, occupancy is the metric that separates hopeful speculation from calculated business strategy.
Comparing top short term rental investment tools
Choosing the right data platform depends on whether you prioritize raw market depth or actionable investment metrics. AirDNA remains the industry standard for broad market visibility, while Airbtics and AirROI cater specifically to the financial modeling needs of investors. Using the wrong tool can lead to overestimating occupancy or underestimating operational costs, which directly impacts your ROI.
AirDNA
AirDNA is the most widely recognized platform for short-term rental data, tracking over 10 million properties across 120,000 markets. Its strength lies in its massive dataset, which provides reliable benchmarks for occupancy rates and average daily rates (ADR) in almost any location. It is ideal for understanding market trends and seasonality but offers less granular insight into individual property profitability without add-ons.
Airbtics
Airbtics focuses on providing historical data and dynamic pricing tools tailored for hosts and investors. It offers a three-year historical dataset at a daily level, which is valuable for backtesting revenue models. While it covers global markets, its interface is designed more for active management and pricing optimization than for high-level portfolio analysis.
AirROI
AirROI positions itself as a comprehensive tool for investors, combining market analytics with a dedicated API for developers. It tracks over 20 million properties and emphasizes revenue estimates and dynamic pricing. Its free market analytics provide a low-barrier entry point, while its API allows for deeper integration into custom investment calculators or automated systems.
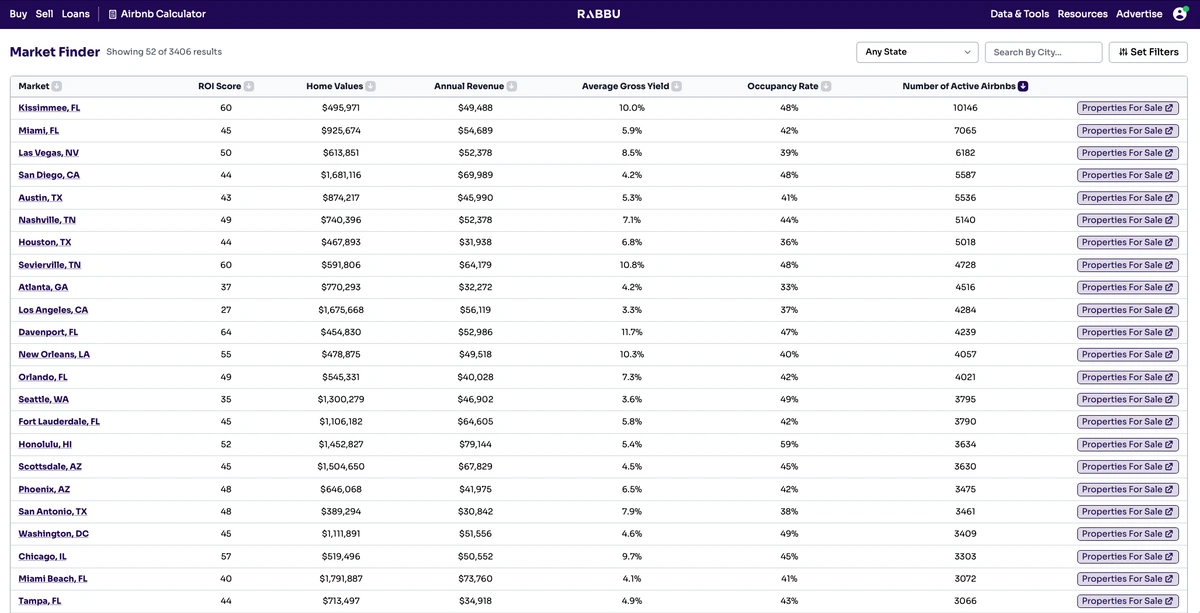
Comparison Table
The table below summarizes the core capabilities of these three platforms to help you decide which fits your workflow.
Using data to forecast vacation rental revenue
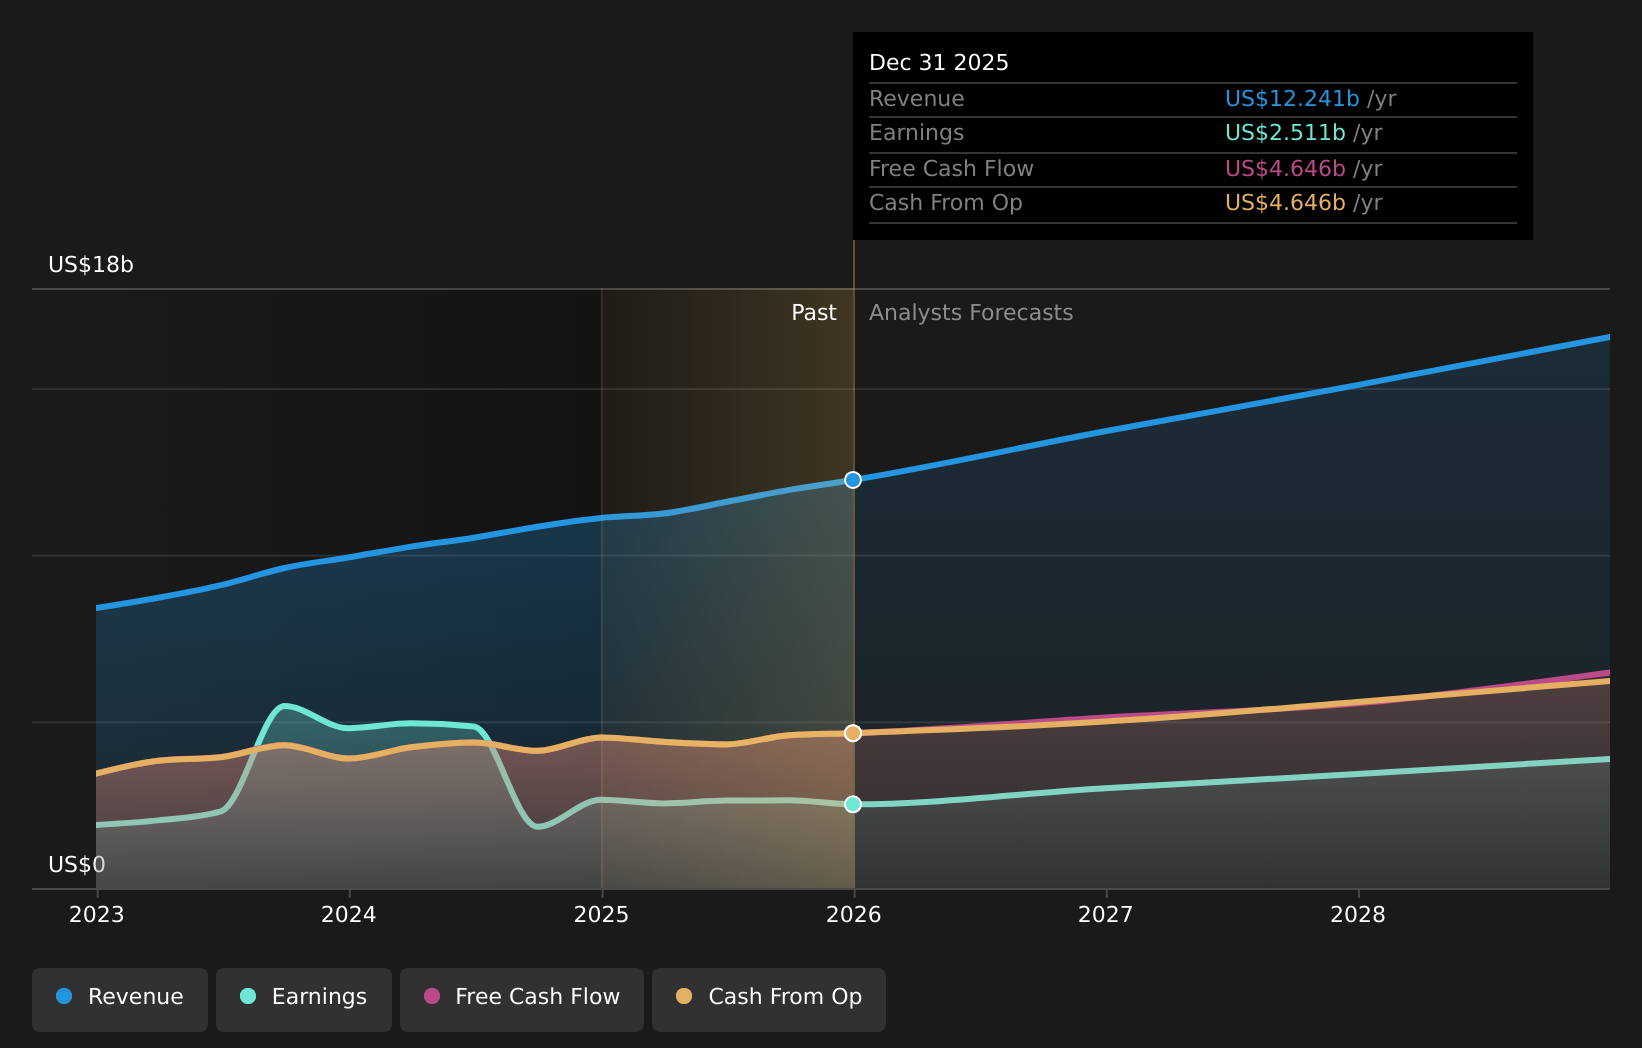
Market data turns guesswork into a calculation. When you plug occupancy rates and average daily rates (ADR) into your rental property ROI calculator, you stop relying on hope and start tracking actual cash flow potential. This section shows you how to use those numbers to forecast revenue with precision.
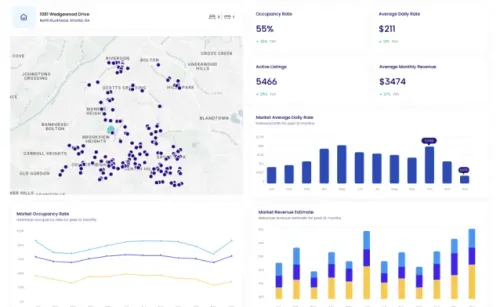
Start by pulling current average daily rates for your specific neighborhood. Platforms like Mashvisor provide real-time insights into occupancy rates and rental performance, allowing you to spot high-yield opportunities before they saturate. Use these live figures as your baseline ADR rather than relying on static, outdated industry averages.
Static ADRs mislead investors. You must adjust your forecast for seasonality. If your target market sees a 40% drop in demand during shoulder months, your calculator should reflect that variance. Dynamic pricing models account for these fluctuations, ensuring your projected revenue isn't inflated by peak-season spikes that won't last all year.
Enter your adjusted ADR and estimated occupancy into the rental property ROI calculator. Apply a conservative buffer—typically 10-15% below the market average—to account for vacancies and maintenance. This stress test reveals whether the property remains profitable even if market conditions soften, protecting your investment from over-optimistic projections.
Accessing free airbnb market data sources
You do not need a premium subscription to access reliable occupancy and revenue data. Several legitimate platforms provide raw datasets that, while requiring manual processing, offer the same foundational metrics as paid tools. For investors watching tight margins in 2026, these free resources are often sufficient to validate a market before committing capital.
Inside Airbnb remains the most widely used open-source resource. The platform scrapes public listing data and offers quarterly downloads for most major markets. You can filter by city or region to extract average daily rates, occupancy percentages, and revenue estimates. The data is updated regularly, making it a reliable baseline for trend analysis. However, because it relies on publicly visible listings, it may underrepresent hosts who restrict their calendar visibility or operate in highly regulated markets where listings are removed.
Other useful sources include AirDNA’s free reports, which provide high-level market health indicators like demand seasonality and competitor density. While these reports lack the granular listing-level detail of Inside Airbnb, they are excellent for quick sanity checks on market saturation. Similarly, local government open data portals often publish short-term rental permit registries, offering a direct count of active inventory in specific neighborhoods.
The trade-off for using free data is time. You will need to clean and normalize the datasets yourself, which requires basic spreadsheet or coding skills. For most investors, this manual effort is a worthwhile investment to avoid overpaying for software that aggregates the same public information.
Frequently asked questions about rental data
What is the 25 rule on Airbnb?
The "25 rule" refers to Airbnb’s policy allowing hosts to set a minimum age requirement for guests. Hosts in the United States may restrict bookings to guests aged 25 or older. This rule must be applied uniformly to all prospective guests and clearly stated in the listing details before booking confirmation. It is a safety and risk management tool, not a revenue metric.
How accurate are third-party occupancy estimates?
Third-party tools like AirROI provide estimates based on scraped public data and historical trends. While useful for initial screening, they are not real-time. Accuracy varies by market maturity and listing visibility. For high-stakes investment decisions, cross-reference these estimates with direct competitor analysis and official platform dashboards where available.
Can I track ROI without a professional tool?
You can track basic ROI manually by comparing your actual revenue against total costs (mortgage, utilities, cleaning, platform fees). However, this misses key variables like dynamic pricing opportunities and seasonal occupancy shifts. Professional tools automate this by integrating market-wide occupancy benchmarks, giving you a clearer picture of potential performance versus actuals.
No comments yet. Be the first to share your thoughts!