
Why Airbnb market data matters
Short-term rental investing operates on thin margins where guesswork translates directly into lost capital. Without precise market data, you are essentially betting on local tourism trends rather than analyzing actual demand. The difference between a profitable property and a money-losing asset often comes down to the accuracy of your occupancy forecasts and revenue projections.
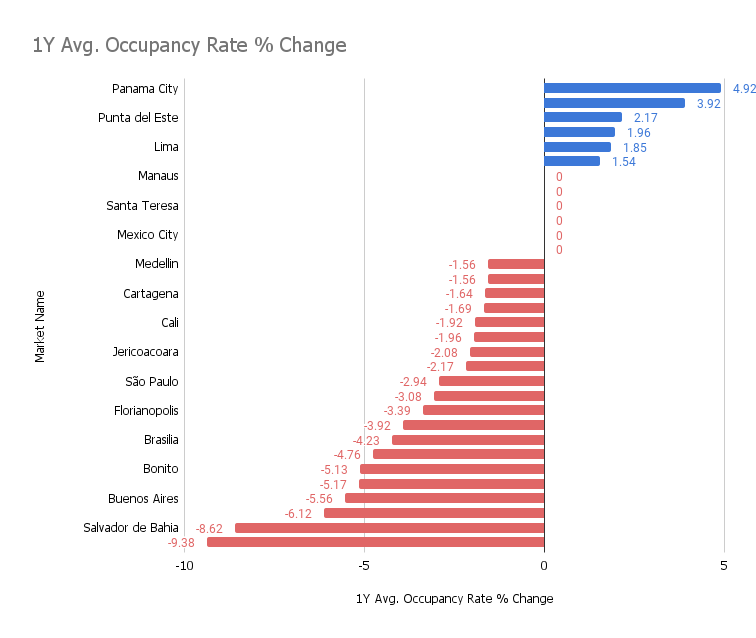
Occupancy rates and daily average rents are not static; they fluctuate with seasonality, local events, and broader economic shifts. Relying on gut feeling or outdated generalizations leads to overestimating potential income. Platforms that provide granular, real-time data allow you to model realistic scenarios based on historical performance and current market velocity.
The volatility of the sector demands rigorous analysis. A property that performed well in 2021 may struggle in 2024 due to regulatory changes or market saturation. Using professional analytics tools helps you identify these trends before they impact your bottom line, ensuring your investment decisions are grounded in verified data rather than optimistic assumptions.
Top Airbnb market data platforms
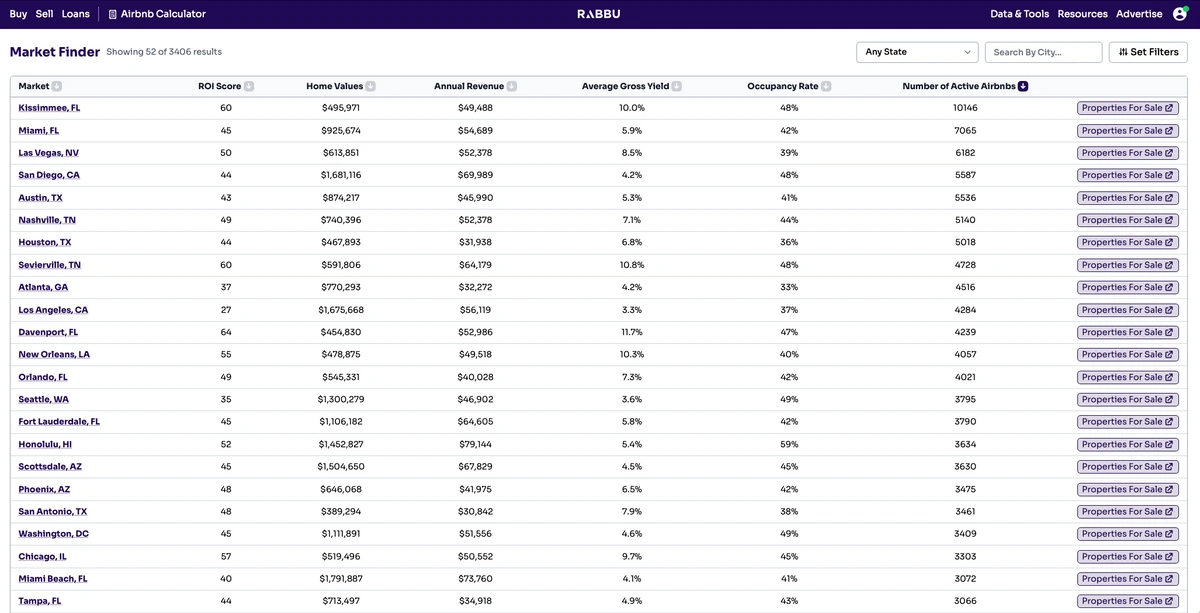
Choosing the right data platform is the difference between spotting a cash-flowing asset and inheriting a money pit. The market has consolidated around a few major players, each offering distinct advantages in data depth, usability, and cost. For high-stakes investment decisions, relying on a single source is risky; cross-referencing data across platforms like AirDNA, Airbtics, and Mashvisor provides the most accurate picture of market health.
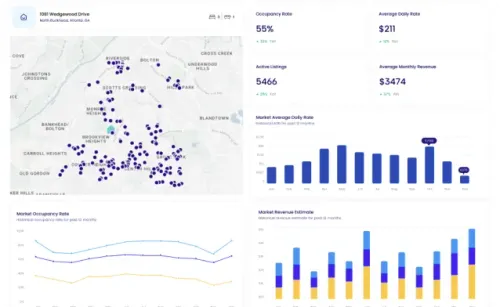
These platforms transform raw listing data into actionable investment metrics. They track occupancy rates, average daily rates (ADR), and revenue potential across thousands of markets. The following comparison highlights the core strengths of the leading tools to help you select the right instrument for your analysis.
| Platform | Data Scope | Key Feature | Pricing Model |
|---|---|---|---|
| AirDNA | 10M+ listings, 120K+ markets | Industry-standard benchmarks and market reports | Freemium; paid plans start ~$99/mo |
| Airbtics | Global Airbnb and Vrbo data | 3-year historical dataset at daily granularity | Freemium; paid plans start ~$29/mo |
| Mashvisor | US-focused with global expansion | Integrated property search and ROI calculator | Freemium; paid plans start ~$49/mo |
| AirROI | 20M+ properties tracked | Free API access and dynamic pricing tools | Free core analytics; API paid tiers |
Calculating rental property ROI
Raw data from market analysis platforms is only as valuable as the model you build with it. Short-term rental investors often mistake gross revenue for profit, a calculation error that can turn a promising property into a liability. To build a reliable rental property ROI calculator, you must strip away the noise and focus on the specific metrics that drive cash flow.
Step 1: Gather accurate market averages
Start by pulling baseline metrics from your chosen platform. You need the Average Daily Rate (ADR) and occupancy rates for your specific zip code, not national averages. These numbers form the denominator of your revenue equation. If the data shows a 65% occupancy rate in a saturated market, your projections must reflect that reality, not your optimism.
Use your platform to find the median nightly rate and historical occupancy for your target area. Input these into your calculator as your revenue drivers. Ensure the data covers at least a 12-month period to account for seasonal fluctuations.
Multiply the ADR by 365 days, then apply the occupancy rate. This gives you the gross annual revenue. For example, a $200 nightly rate at 60% occupancy yields $43,800. This is your top-line number, but it is not your profit.
Subtract variable costs like cleaning fees, supplies, and platform commissions (typically 15-20% of revenue). Then subtract fixed costs: property taxes, insurance, utilities, and maintenance reserves (usually 10% of revenue). The result is your Net Operating Income (NOI).
If you are leveraging capital, subtract your mortgage payments (principal and interest) from the NOI. If you are paying cash, subtract your opportunity cost or compare against a risk-free rate. The final number is your annual cash flow.
Divide your annual cash flow by your total initial cash investment (down payment, closing costs, and initial furnishing). This percentage tells you the actual yield on your money. A 5% cash-on-cash return is often the break-even point for many investors.
Gross yield vs. net yield
The difference between gross and net yield is where most investors lose money. Gross yield is simple: annual revenue divided by property price. It is a quick snapshot of top-line performance. Net yield, however, accounts for the friction of ownership. It includes the expenses that erode your revenue.
In high-stakes markets, a property might show a 10% gross yield but only a 4% net yield after expenses. Your calculator must force you to input every cost. If you ignore the 10% maintenance reserve or the 20% platform fee, your ROI model is fiction. Use the data to find the net yield, then stress-test it by reducing occupancy by 10% to see if the deal still holds up.
Evaluating short term rental investment
Before committing capital, you must distinguish between gross revenue and net operating income. Many platforms highlight top-line earnings, but these figures rarely reflect the true cost of ownership. A listing that appears profitable on the surface may be bleeding cash once you account for property management fees, maintenance reserves, and—most critically—local regulatory compliance.
Warning: Relying solely on gross revenue projections is a common pitfall. Always subtract estimated expenses and verify local zoning laws before making an offer.
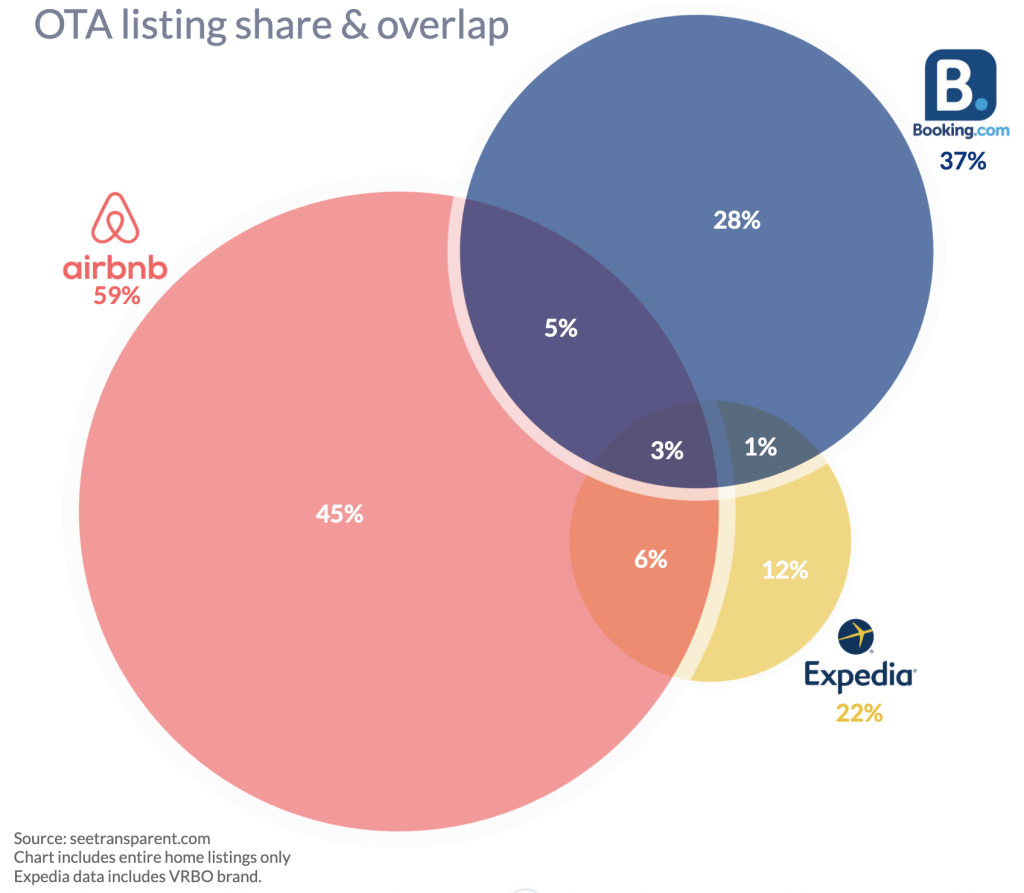
Market saturation is the other silent killer of returns. Data from Inside Airbnb indicates that in many major cities, the majority of listings are entire homes rented year-round, which can disrupt local housing markets and trigger regulatory crackdowns. High occupancy rates in one neighborhood may signal intense competition rather than strong demand. Analyze the density of similar listings in your target area; if supply is outpacing demand, your projected occupancy will likely fall short.
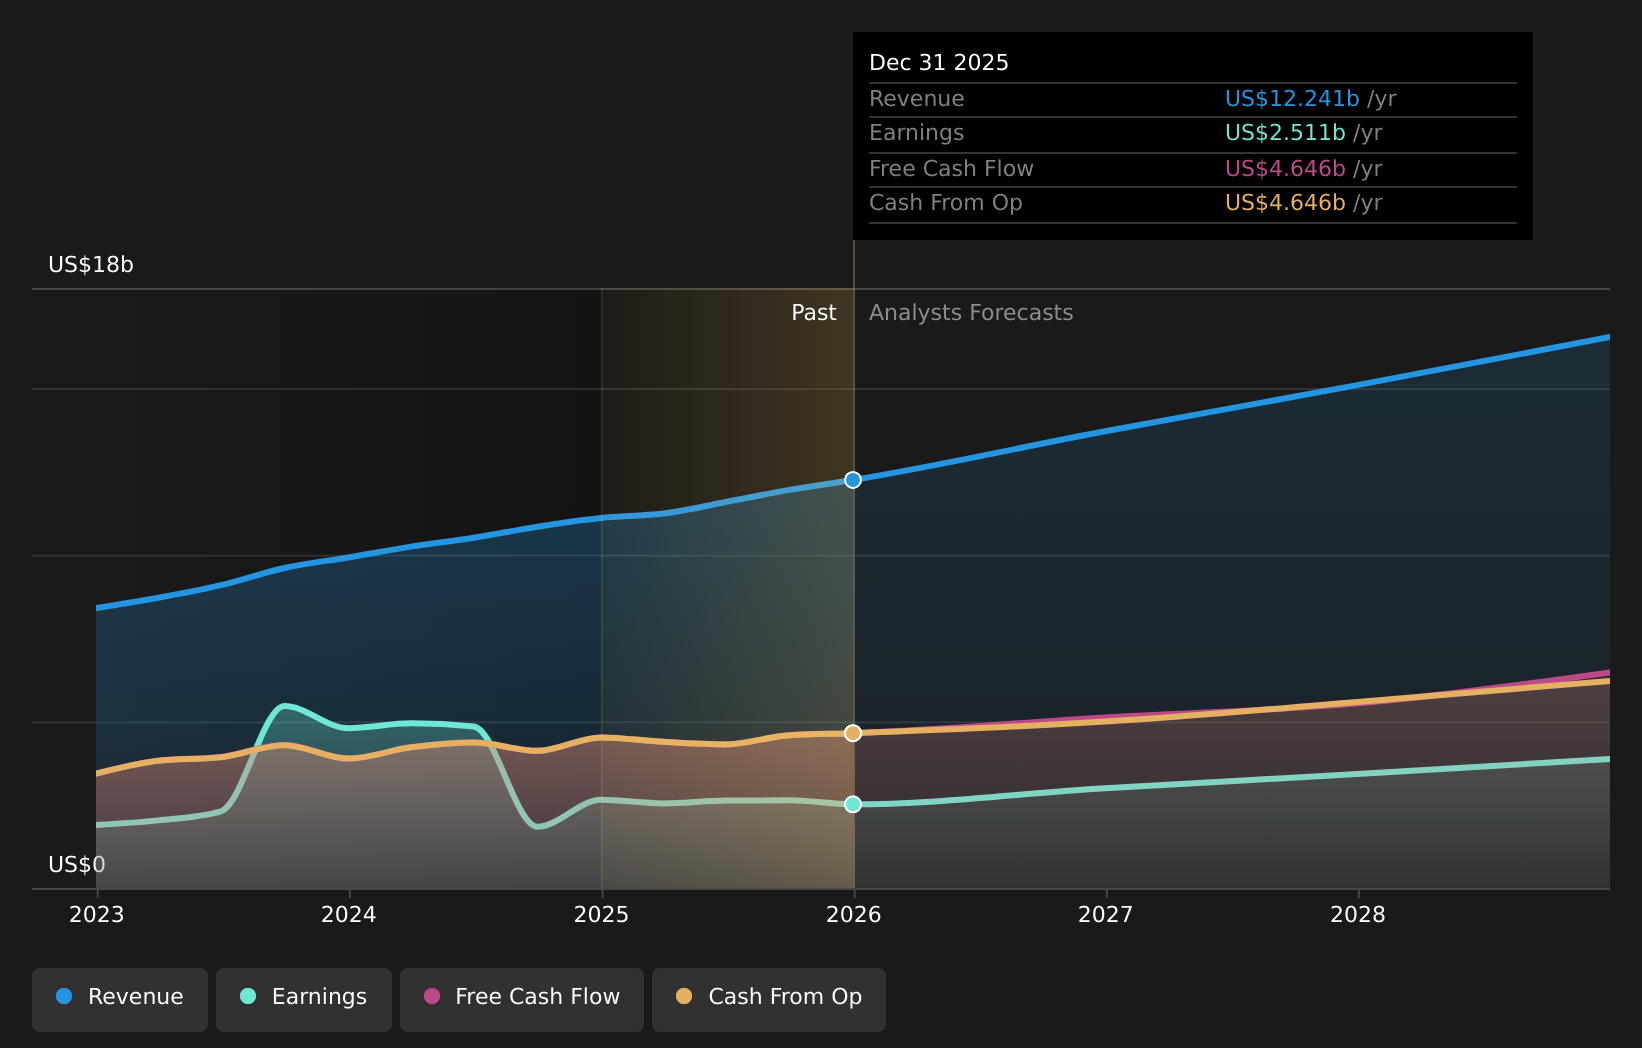
To contextualize broader market trends, you can monitor general real estate or hospitality sector performance using the tools below. This helps you understand if local short-term rental dynamics are aligned with or diverging from wider economic indicators.
No comments yet. Be the first to share your thoughts!