
Pick the right calculator tool
Manual spreadsheets often rely on static averages or outdated assumptions, which can skew your ROI projections significantly. To ensure financial accuracy, you need an Airbnb revenue calculator that pulls from live booking data rather than historical snapshots. This approach grounds your analysis in current market conditions, providing a reliable foundation for your investment decision.
Several reputable tools dominate the market by integrating real-time short-term rental (STR) comp data. AirDNA Rentalizer is widely recognized as the industry standard, offering projected revenue, average daily rate (ADR), and occupancy rates based on actual listing performance. It is free to start, allowing you to validate initial assumptions without immediate commitment.
For a broader view of U.S. markets, Rabbu provides weekly-updated data that analyzes occupancy, ADR, and profit potential. It is particularly useful for investors looking to compare multiple locations or track seasonal fluctuations in specific regions. Similarly, BNBCalc focuses on eliminating financial guesswork by generating instant revenue projections from both Airbnb and Vrbo data. These platforms allow you to enter any address and receive immediate, data-backed insights.
Choosing one of these established calculators ensures your ROI calculations are based on verified market activity. This step is critical before you proceed to detailed expense analysis or financing calculations, as it sets the baseline for your entire financial model.
Enter property and location details
The accuracy of your Airbnb revenue calculator output depends entirely on the precision of your input data. The algorithm uses these initial parameters to filter comparable listings and project occupancy rates. If the location or property type is vague, the model cannot retrieve valid comparables, resulting in skewed projections.
Enter the full street address, city, and ZIP code. Airbnb’s interactive tools compute estimated income by factoring in prior booking data specific to that geography. Broad city-level inputs often miss micro-market variations in demand and pricing power. Use the most specific address possible to ensure the algorithm pulls accurate local performance metrics.
Choose the listing category that matches your asset: entire home, private room, or shared room. This selection dictates the baseline pricing structure and occupancy patterns. An entire home in a tourist zone behaves differently than a private room in a business district. Selecting the correct type ensures the calculator applies the right demand curves and seasonal fluctuations.
![Predict Revenue with an Airbnb Host Calculator [+Best Tools]](/cdn/articles/be504389-01b2-4d6c-a627-1d2458186fc3-1d5be8cf.png)
Specify the number of bedrooms, bathrooms, and total units (if applicable). These details determine the maximum guest capacity, which directly influences nightly rate potential. A four-bedroom property will have a different revenue ceiling than a one-bedroom studio, even in the same neighborhood. Accurate unit counts prevent the model from overestimating occupancy for larger spaces or underestimating rates for smaller ones.
Providing these details with exactness is the first step in financial validation. As noted by Airbnb, their interactive tools rely on these specific inputs to generate reliable earnings estimates. Taking the time to verify these fields ensures your ROI calculation reflects real market conditions rather than generic averages.
Adjust occupancy and daily rate assumptions
Generic calculators often default to national averages, which rarely reflect the reality of your specific property. To get an accurate Airbnb Revenue Calculator result, you must replace these broad estimates with hyper-local data. This step transforms a rough guess into a financial validation tool.
Start by refining your occupancy rate. Instead of accepting a default 70% figure, research the actual performance of 10-20 comparable listings in your immediate neighborhood. Look for properties with similar bedroom counts and amenities. If your area hosts a major annual event, such as a music festival or sports tournament, calculate the occupancy spike during those weeks and weight it appropriately against slower months. Seasonality is not just a summer trend; winter rates in ski towns or summer premiums in beach markets require distinct adjustments.
Next, adjust your average daily rate (ADR). Base rates fluctuate based on demand cycles. Use dynamic pricing tools or manual research to identify the realistic nightly rate for weekdays versus weekends. A property in a business district might command higher rates Tuesday through Thursday, while leisure destinations peak on Fridays and Saturdays. Do not assume your rate will remain static year-round. Instead, create a weighted average that reflects the true distribution of nights across different price points.
Finally, account for property quality and amenities. High-end finishes, smart home features, or unique selling points like a hot tub or dedicated workspace can justify a 10-15% premium over standard listings. Conversely, properties lacking parking or with difficult check-in processes may underperform. Cross-reference your assumptions with the performance of top-rated hosts in your area to ensure your projections are grounded in market reality.
Scenario Comparison
The table below illustrates how adjusting these variables changes your projected annual revenue compared to a generic baseline.
| Scenario | Occupancy | Avg Daily Rate | Projected Revenue |
|---|---|---|---|
| Generic Baseline | 70% | $150 | $38,325 |
| Adjusted Realistic | 62% | $165 | $37,347 |
| High Season Focus | 55% | $180 | $36,165 |
| Premium Property | 65% | $195 | $46,151 |
Using these adjusted inputs ensures your ROI calculation reflects the actual financial potential of your investment, rather than an optimistic average.
Calculate net operating income and ROI
Gross revenue tells you what the property earns, but net operating income (NOI) tells you what you keep. To get an accurate ROI, you must subtract all operating expenses from the gross income. This step separates a profitable investment from one that looks good on paper but bleeds cash.
Start by listing every recurring cost. These typically include property management fees (usually 15–25% of revenue), cleaning fees paid to vendors, utilities, internet, insurance, property taxes, and maintenance reserves. Some calculators also allow you to input mortgage payments, but NOI strictly excludes debt service. The formula is simple:
NOI = Gross Revenue – Operating Expenses
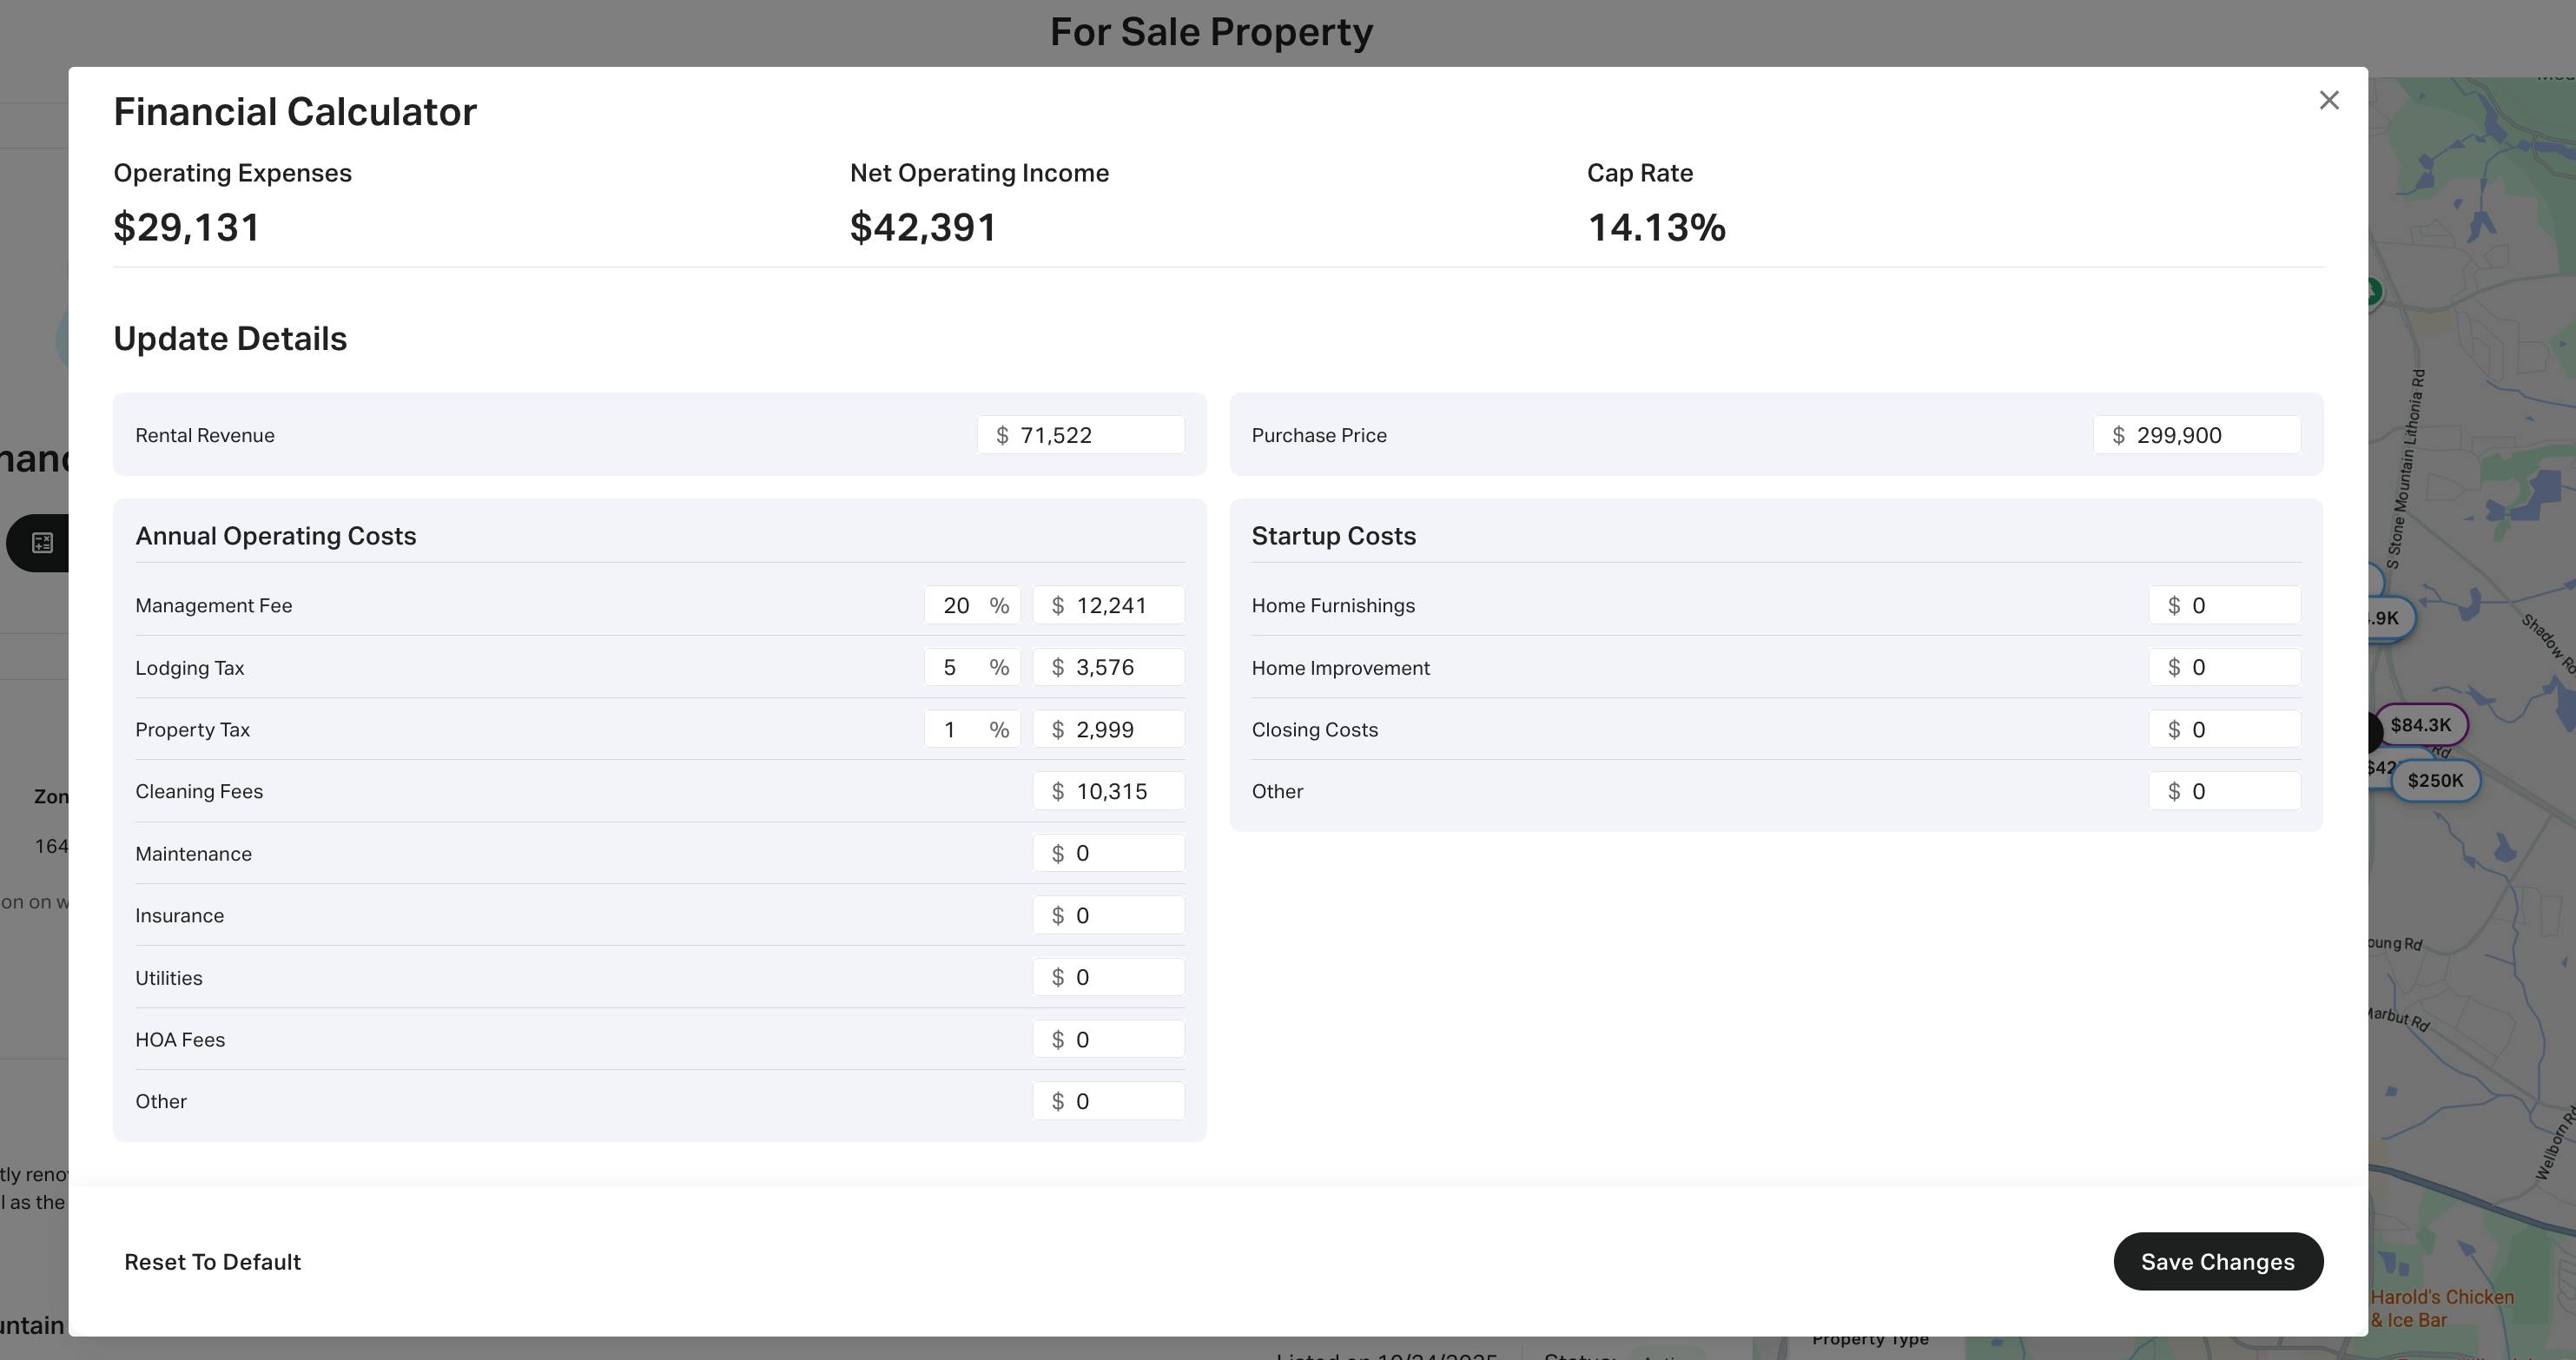
Once you have the NOI, you can determine the Cap Rate and cash-on-cash return. The Cap Rate measures the property’s yield independent of financing:
Cap Rate = NOI / Property Value
For example, if a property generates $50,000 in gross revenue and has $20,000 in annual expenses, the NOI is $30,000. If the property is valued at $500,000, the Cap Rate is 6%. This metric allows you to compare this short-term rental against other real estate assets.
Subtracting expenses from gross revenue
Most beginners forget to account for variable costs that scale with occupancy. Cleaning fees, guest supplies, and platform commissions (Airbnb/Vrbo host fees) eat into margins. If your occupancy drops, fixed costs like taxes and insurance remain, squeezing your profit margin. Use a tool like BNBCalc or AirROI to model these variables automatically. These platforms pull data from millions of listings to estimate realistic expense ratios for your specific market.
Determining true cash flow and Cap Rate
After calculating NOI, subtract your annual debt service (mortgage payments) to find your pre-tax cash flow. This is the actual money left in your pocket. A positive cash flow is essential for long-term sustainability. If the numbers are tight, consider increasing the nightly rate or reducing vacancy periods. Remember, a high Cap Rate does not always mean a good deal; it may reflect higher risk or lower growth potential in that specific market.
-
Property management fees (15-25%)
-
Cleaning and laundry services
-
Utilities (electric, water, gas)
-
Internet and cable subscriptions
-
Insurance premiums
-
Property taxes
-
Maintenance and repair reserves
-
Platform commissions (Airbnb/Vrbo fees)
-
Supplies and amenities
Validate Results Against Local Market Data
Calculator outputs are projections, not guarantees. To ensure your ROI estimate is realistic, you must cross-reference the numbers with actual performance data from the specific neighborhood where the property is located.
Compare With Active Comp Listings
Pull data from at least five active short-term rental listings within a one-mile radius. Look for properties similar in size, amenities, and condition. Focus on three key metrics:
- Average Daily Rate (ADR): What are similar properties actually charging?
- Occupancy Rate: What percentage of nights are booked?
- Revenue per Available Room (RevPAR): This combines rate and occupancy for a true performance snapshot.
If your calculator suggests an ADR of $200 but comparable listings in the area are averaging $150, your projection is likely inflated. Adjust your inputs downward to reflect market reality.
Check Seasonality Variations
Most calculators provide an annual average. However, short-term rental markets are rarely flat. Identify the peak and shoulder seasons for your target location. If your property relies heavily on summer tourism, a high annual average might mask low winter occupancy. Ensure your calculator allows you to adjust rates and occupancy by month to capture these fluctuations.
Use Third-Party Validation Tools
Don't rely solely on the platform's built-in calculator. Use independent tools like AirDNA or RedAwning to verify your assumptions. These platforms aggregate real booking data from thousands of hosts, providing a broader view of market trends. If your initial ROI calculation differs significantly from these third-party estimates, revisit your input variables for errors or unrealistic optimism.
No comments yet. Be the first to share your thoughts!