
Run the numbers on any property
An Airbnb revenue calculator turns guesswork into data. It uses real short-term rental comp data to project your potential income, helping you decide if a property is worth buying or renovating. Without these projections, you’re relying on intuition rather than market reality.
Follow these steps to generate accurate baseline projections for any address.
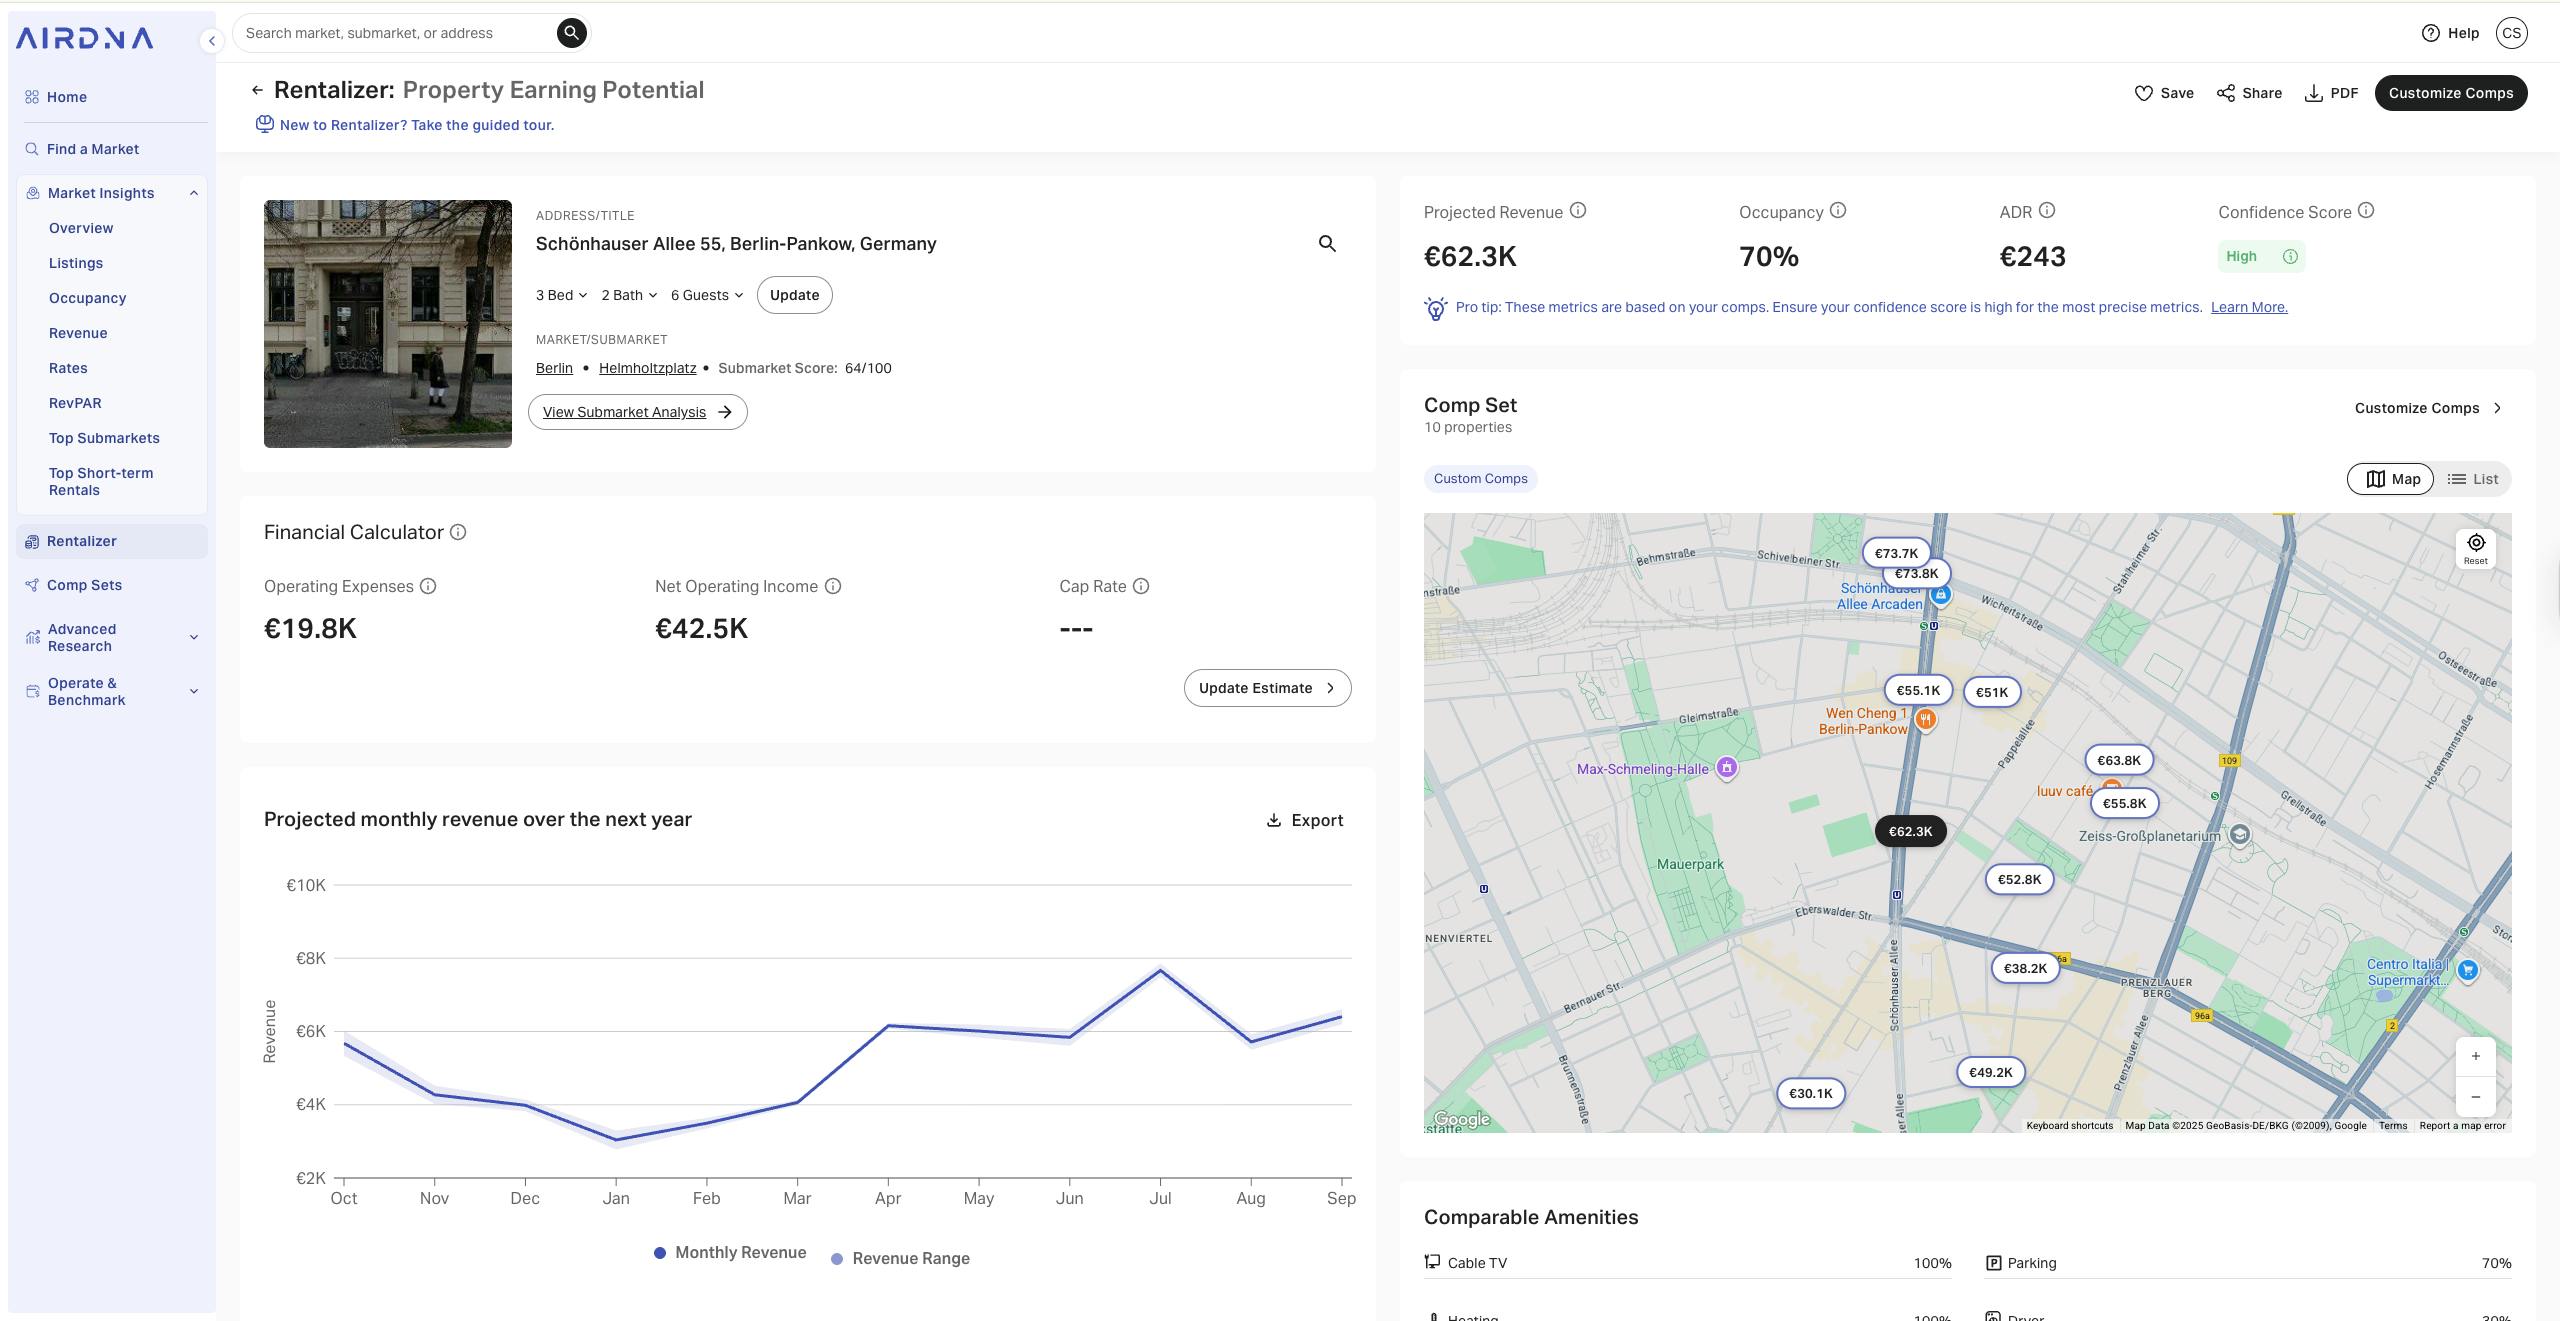
Start by choosing a trusted tool like AirDNA or BNBCalc. These platforms pull from actual booking data, giving you a realistic view of what similar properties earn in your target area. Avoid generic online tools that use broad national averages.
Type in the full address of the property you’re evaluating. The more specific the location, the more accurate the comparable listings will be. Even a few streets away can significantly change occupancy rates and nightly rates.

Choose whether you’re analyzing an entire home, a private room, or a shared space. This distinction matters because entire homes typically command higher average daily rates (ADR) but may have different occupancy patterns than single rooms.
Examine the projected revenue, ADR, and occupancy rates based on similar listings in the area. Look for consistency in the data. If the numbers seem too good to be true, cross-reference with a second calculator or check recent local market reports.
Using these tools is your first line of defense against bad investments. They don’t guarantee success, but they remove the blindfold. Always double-check the inputs and consider seasonal variations before making a final decision.
Adjust occupancy and daily rate inputs
Most calculators start with generic defaults that can skew your results by thousands of dollars. To get an accurate ROI, you need to replace those broad estimates with data specific to your property and location. Think of the default settings as a starting line, not the finish line.
Set your Average Daily Rate (ADR)
The Average Daily Rate (ADR) is what you charge per night on average. Instead of guessing, look at the nightly rates of similar listings in your neighborhood on Airbnb and Vrbo. Focus on properties with comparable amenities, square footage, and guest capacity.
If your property is a cozy studio in a high-demand area, your ADR might be lower than a luxury three-bedroom home, but the occupancy rate could be higher. Adjust this number to reflect your actual pricing strategy, including any discounts you plan to offer for weekly or monthly stays.
Refine the occupancy percentage
Occupancy percentage is the portion of days your property is booked. A common mistake is assuming 100% occupancy or relying on a generic national average. Seasonality plays a huge role here. A beach house might hit 90% occupancy in summer but drop to 30% in winter.
Use the "year-round occupancy rate" method for a more realistic projection. Multiply your estimated ADR by your expected occupancy rate, then by 365 days. This gives you a gross revenue figure that accounts for the inevitable slow periods. Tools like Rabbu or Airbtics allow you to input local market data, which helps adjust for these seasonal fluctuations automatically.
Account for local seasonality
Don't ignore the calendar. If you're in a ski town, your peak season is December through March. If you're in a business district, weekdays might outperform weekends. Inputting a flat occupancy rate ignores these cycles and can lead to overestimating your income.
Some advanced calculators let you input monthly occupancy rates. If yours doesn't, manually adjust your annual estimate. For example, if you expect 80% occupancy overall but only 50% in winter, weight your calculations accordingly. This step is critical for high-stakes financial planning, as it prevents you from relying on revenue that only exists for part of the year.
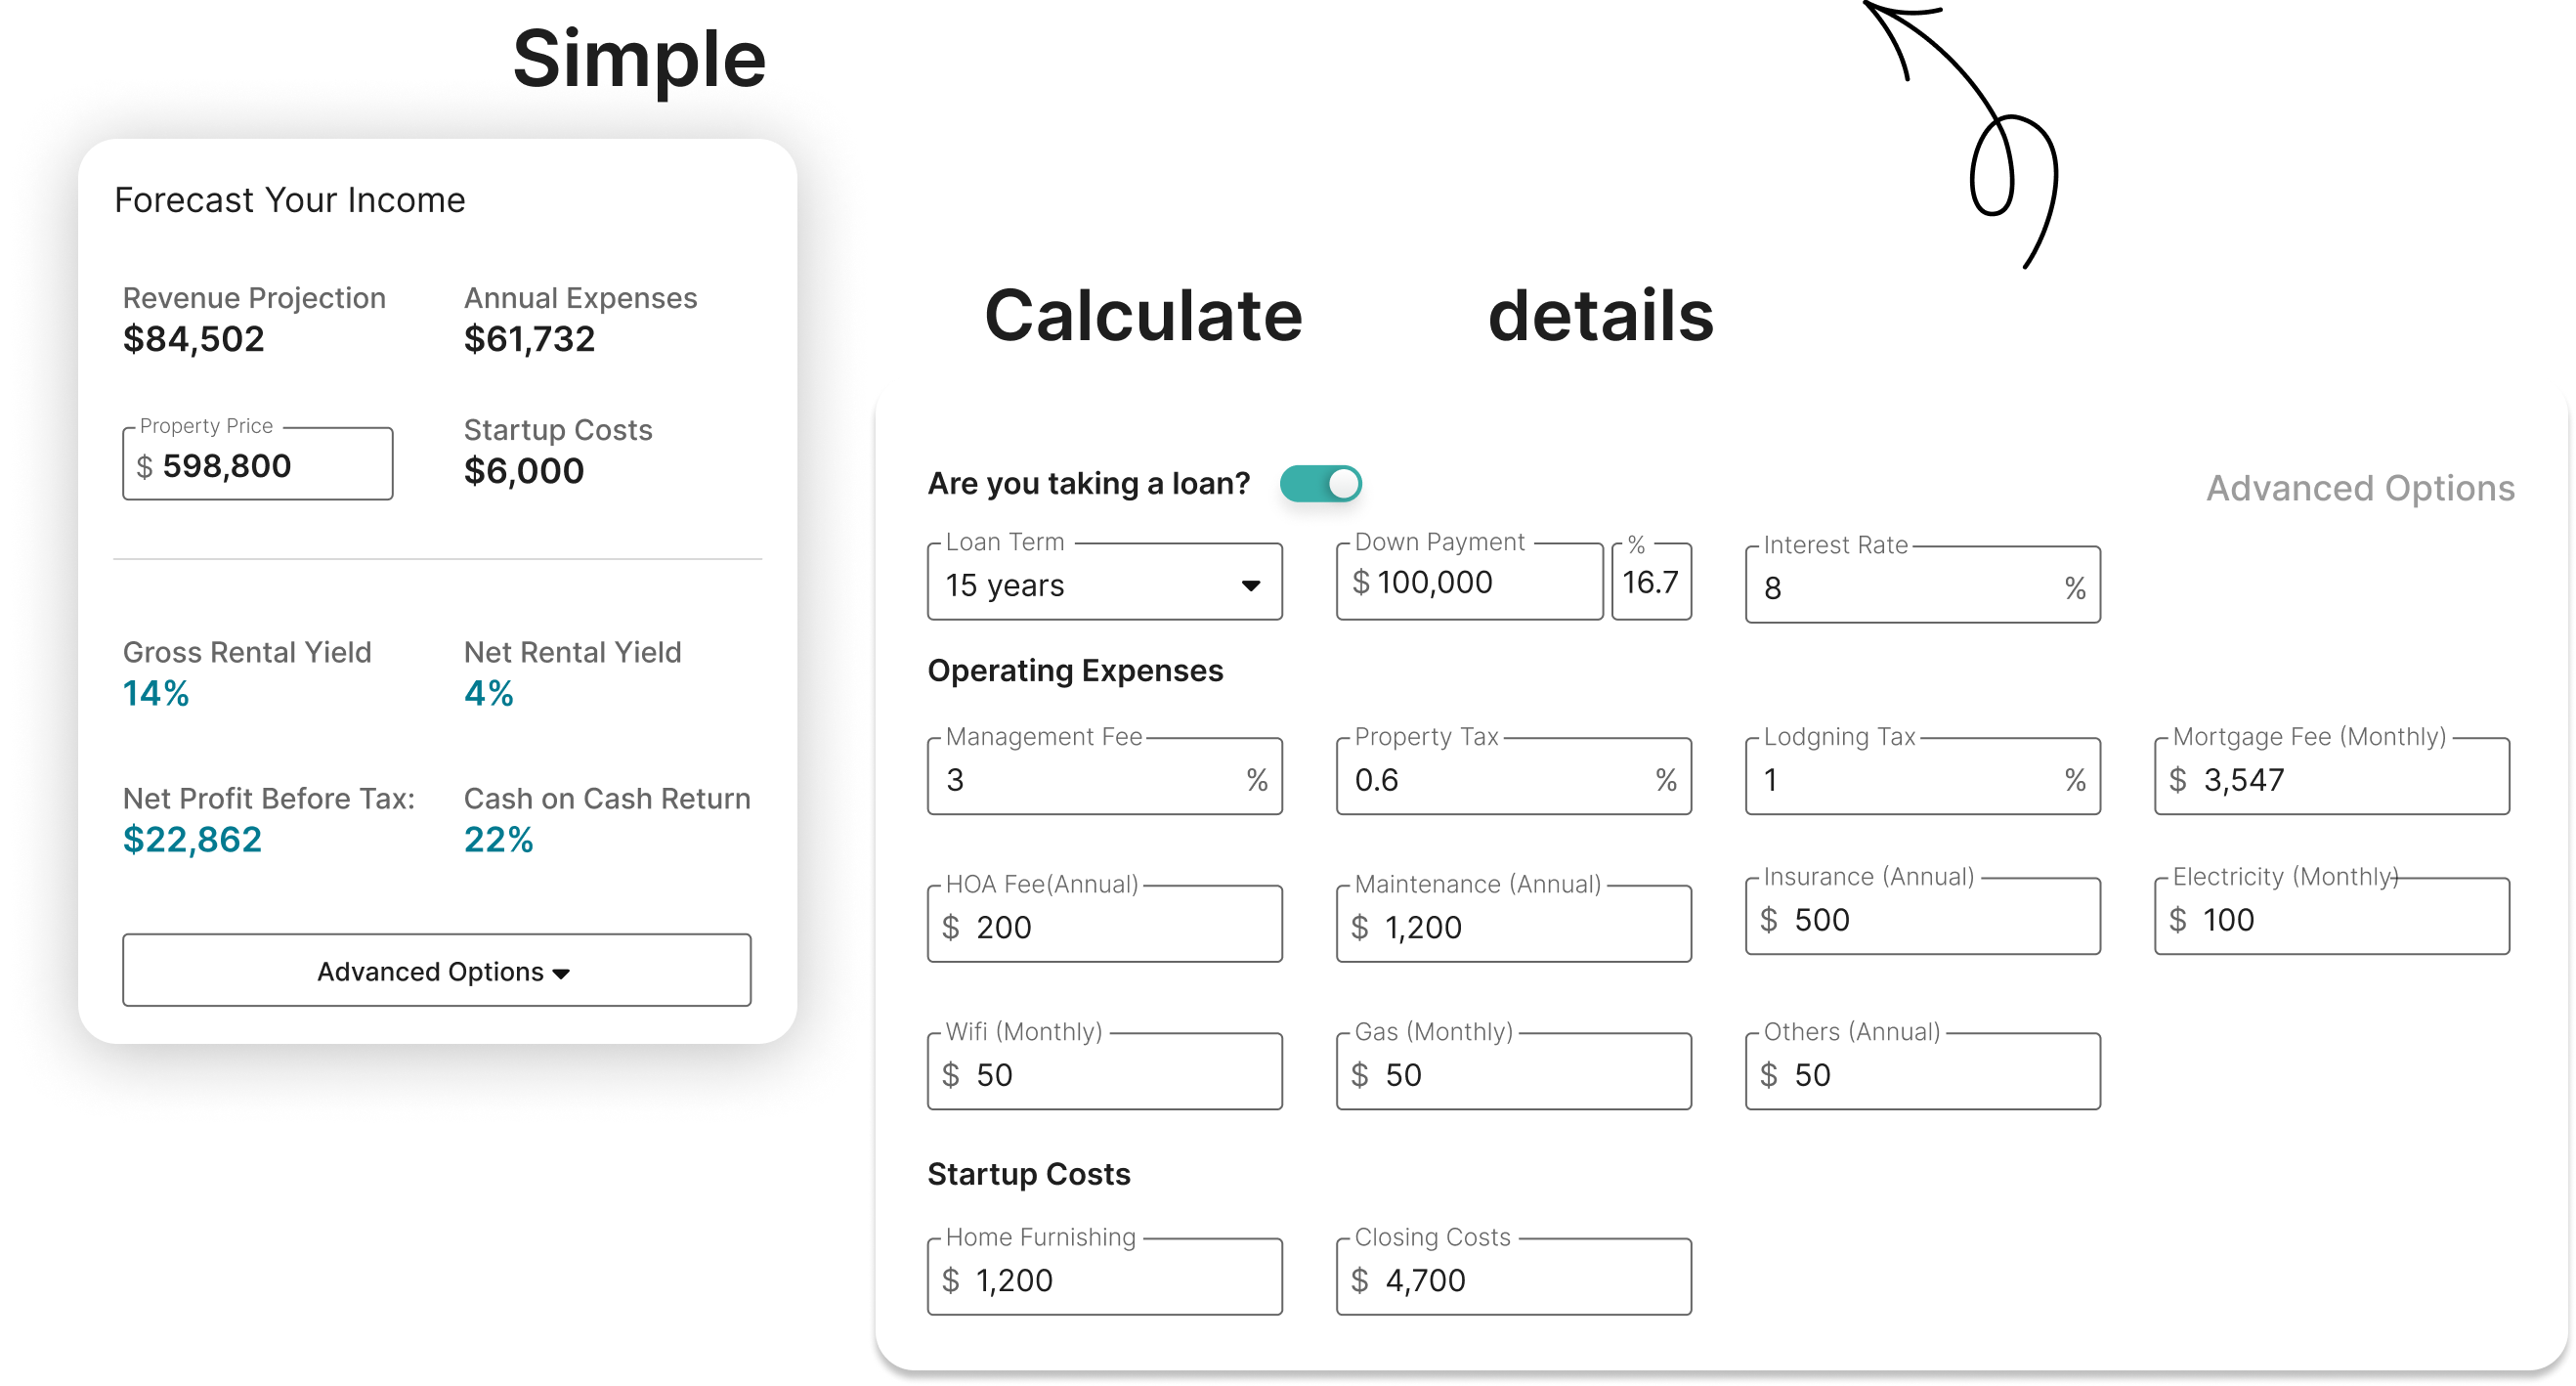
Subtract operating expenses from gross revenue
Gross revenue is just the starting line. To find your true net profit, you must subtract every cost associated with running the property. Many free Airbnb revenue calculators only show the top-line number, which can be dangerously misleading for high-stakes investment decisions. Always ensure your tool accounts for the 15-25% platform fee and variable operating costs to find true net income.
Airbnb charges a service fee to hosts, typically around 3% of the booking total, though this varies by region and listing type. Some platforms charge a separate guest fee, but that doesn’t come out of your pocket. However, you must also account for payment processing fees if you accept direct bookings outside the platform. These small percentages compound quickly over hundreds of bookings.
Cleaning is often the largest variable expense. While you can charge guests a separate cleaning fee, the actual cost of laundry, supplies, and professional cleaners comes out of your gross revenue. If you manage the property yourself, factor in the value of your time or the cost of supplies. Inaccurate cleaning estimates are a common reason investors overestimate their ROI.
Unlike long-term rentals, short-term stays usually include electricity, water, gas, and high-speed internet in the rent. These costs spike during peak seasons when guests use AC or heating heavily. Use your local utility bills from the past year to average these costs. If your property is in a high-tourism area, expect a 20-30% higher utility load than a standard residential home.
Things break. Towels wear out, appliances fail, and paint fades under constant guest turnover. Set aside 5-10% of your gross revenue for routine maintenance and repairs. This fund covers everything from lightbulb replacements to major HVAC servicing. Treating maintenance as an afterthought is the fastest way to erode your profit margin.
If you hire a property manager, they typically charge 20-30% of the gross rental income. This covers guest communication, check-in coordination, and emergency response. Even if you self-manage, consider the opportunity cost of your time. If your hourly wage is $25 and you spend 5 hours a week on Airbnb tasks, that’s a significant hidden expense.
By subtracting these specific line items, you move from a theoretical gross number to a realistic net profit projection. Tools like PriceLabs or AirROI help automate this by pulling data from comparable properties to estimate these expenses accurately. This shift from gross to net is where the real investment insight lies.
Compare short-term rental ROI against long-term leases
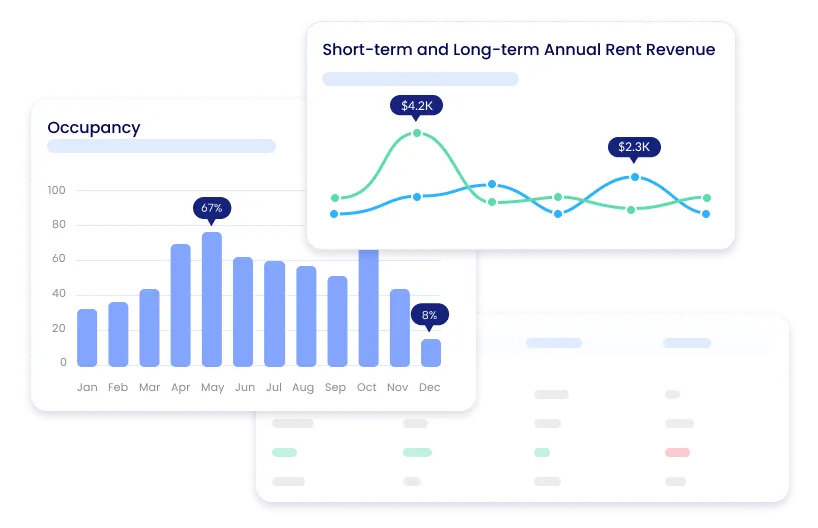
Running an Airbnb is not just a different way to collect rent; it is a fundamentally different business model. While a long-term lease offers predictable cash flow, a short-term rental (STR) demands active management, higher operating costs, and constant attention to guest experience. To determine if the extra effort is justified, you need to look past gross revenue and compare the net profitability of both strategies side-by-side.
The most effective way to visualize this trade-off is through a direct comparison of key financial and operational metrics. The table below breaks down the typical differences between an STR and a traditional 12-month lease. Use these figures to stress-test your Airbnb revenue calculator results against the stability of long-term renting.
| Metric | Short-Term Rental | Long-Term Lease | Risk Profile |
|---|---|---|---|
| Occupancy Rate | 60–75% | 95–98% | High variability |
| Management Effort | High (daily tasks) | Low (monthly tasks) | Time-intensive |
| Operating Costs | 15–25% of revenue | 5–10% of revenue | Higher expenses |
| Cash Flow Stability | Variable | Predictable | Income fluctuation |
| Regulatory Risk | High | Low | Policy changes |
Notice the disparity in operating costs and management effort. STRs typically consume 15–25% of their revenue in cleaning, supplies, and platform fees, whereas long-term leases often stay under 10%. However, the upside potential for an STR can be significantly higher if you maintain strong occupancy and dynamic pricing. This is where your Airbnb revenue calculator becomes essential—it helps you quantify whether the higher gross income actually translates to more net profit after accounting for these added expenses.
-
Net Airbnb income > Long-term rent?
-
Local STR regulations allow this use?
-
Do I have a property manager?
-
Is the Cap Rate above 5%
If the numbers in your calculator show a modest difference, consider whether you have the bandwidth to handle the "high variability" and "time-intensive" nature of STRs. If the profit margin is substantial and local regulations are favorable, the active management may be worth the risk. Otherwise, a long-term lease might offer a better risk-adjusted return for your specific situation.
Common questions about rental income estimation
Getting the numbers right matters because inaccurate projections can turn a promising investment into a money-losing asset. Below are the most frequent questions hosts ask when trying to forecast their returns.
No comments yet. Be the first to share your thoughts!