
Why manual estimates fail
Relying on mental math or rough rules of thumb to project Airbnb returns introduces significant financial risk. The margin of error in manual estimates often spans 20% to 30%, a gap that can turn a profitable investment into a liability. When you calculate revenue by simply multiplying a guessed nightly rate by 365 days, you ignore the reality of seasonal fluctuations, local occupancy caps, and the compounding effect of operational expenses.
Most investors fall into the trap of using static averages. A common heuristic is aiming for 20% of the purchase price in yearly revenue, but this metric fails to account for property-specific nuances like location desirability or property condition. Without a structured Airbnb revenue calculator, you are essentially guessing your break-even point. Precision requires data, not intuition.
To secure accurate ROI projections, you must move beyond rough estimates. The next section outlines the exact steps to input your data into a reliable calculator, ensuring your financial model reflects actual market conditions rather than optimistic assumptions.
Choose the right data source
Your Airbnb revenue calculator is only as good as the data feeding it. If the platform relies on stale listings or limited market coverage, your projected cash flow will be inaccurate, leading to poor investment decisions. To get precise ROI estimates, you need a tool that pulls from active, verified short-term rental (STR) transactions rather than generic long-term rental data.
When evaluating platforms, prioritize those that offer weekly data updates and granular market coverage. The three most reliable options for detailed financial modeling are AirDNA, BNBCalc, and Rabbu. Each serves a slightly different analytical need, but all provide the foundational metrics—Average Daily Rate (ADR), occupancy, and revenue—required for accurate forecasting.
| Feature | AirDNA | BNBCalc | Rabbu |
|---|---|---|---|
| Primary Data Source | Real STR comp data | 40+ comparable listings | Weekly-updated market data |
| Key Output Metrics | Projected Revenue, ADR | Cash Flow, ROI, Revenue | Occupancy, ADR, Profit Potential |
| Market Coverage | Global | U.S. Focus | U.S. Focus |
| Cost | Free to start | Free | Free |
AirDNA is widely considered the industry standard for rentalizer data, offering a robust free tier that provides projected revenue and ADR based on real comp data AirDNA. BNBCalc stands out for investors needing deeper financial granularity, projecting cash flow and ROI alongside 40+ comparable properties BNBCalc. Rabbu offers a streamlined alternative with weekly-updated data specifically tailored for U.S. markets, focusing on profit potential and occupancy rates Rabbu.
Select the tool that aligns with your analysis depth. If you need broad market trends and ADR benchmarks, AirDNA is the strongest choice. If your focus is on strict cash flow and ROI calculations, BNBCalc provides the necessary financial outputs. For a quick, data-driven profit estimate in U.S. markets, Rabbu offers a clean, efficient interface.
Enter property and market inputs
An Airbnb revenue calculator is only as accurate as the data you feed it. The algorithm relies on specific geographic and structural details to model potential monthly host earnings. If the inputs are vague, the output will be a guess rather than a financial projection. Follow this sequence to ensure the tool has valid data to process.
Start by entering the exact street address. Geographic precision is critical because short-term rental demand fluctuates significantly by neighborhood, not just city. Airbnb’s own interactive tools compute estimated income by factoring in prior booking data specific to that immediate area. A broad city-wide search will dilute the accuracy of your local market metrics.

Define the listing type, such as an entire home, private room, or shared room. Also, specify the number of bedrooms and bathrooms. The calculator uses these structural details to compare your property against similar inventory in the area. For example, a three-bedroom house will have different seasonal demand patterns and pricing power than a studio apartment in the same zip code.
List the amenities that drive booking conversions, such as Wi-Fi, parking, a kitchen, or a pool. These features directly influence the nightly rate and occupancy probability. While basic amenities are expected, premium features often justify higher price points. Ensure you select only the amenities your property actually offers to avoid inflating the projected revenue unrealistically.
Before finalizing your input, check local short-term rental regulations. Some cities impose strict zoning laws or require specific permits that can limit your ability to host. If the calculator offers a toggle for regulatory restrictions, enable it to reflect potential compliance costs or hosting limitations. Ignoring local laws can render your ROI calculation irrelevant if the property cannot legally operate as a rental.
Read occupancy and ADR results
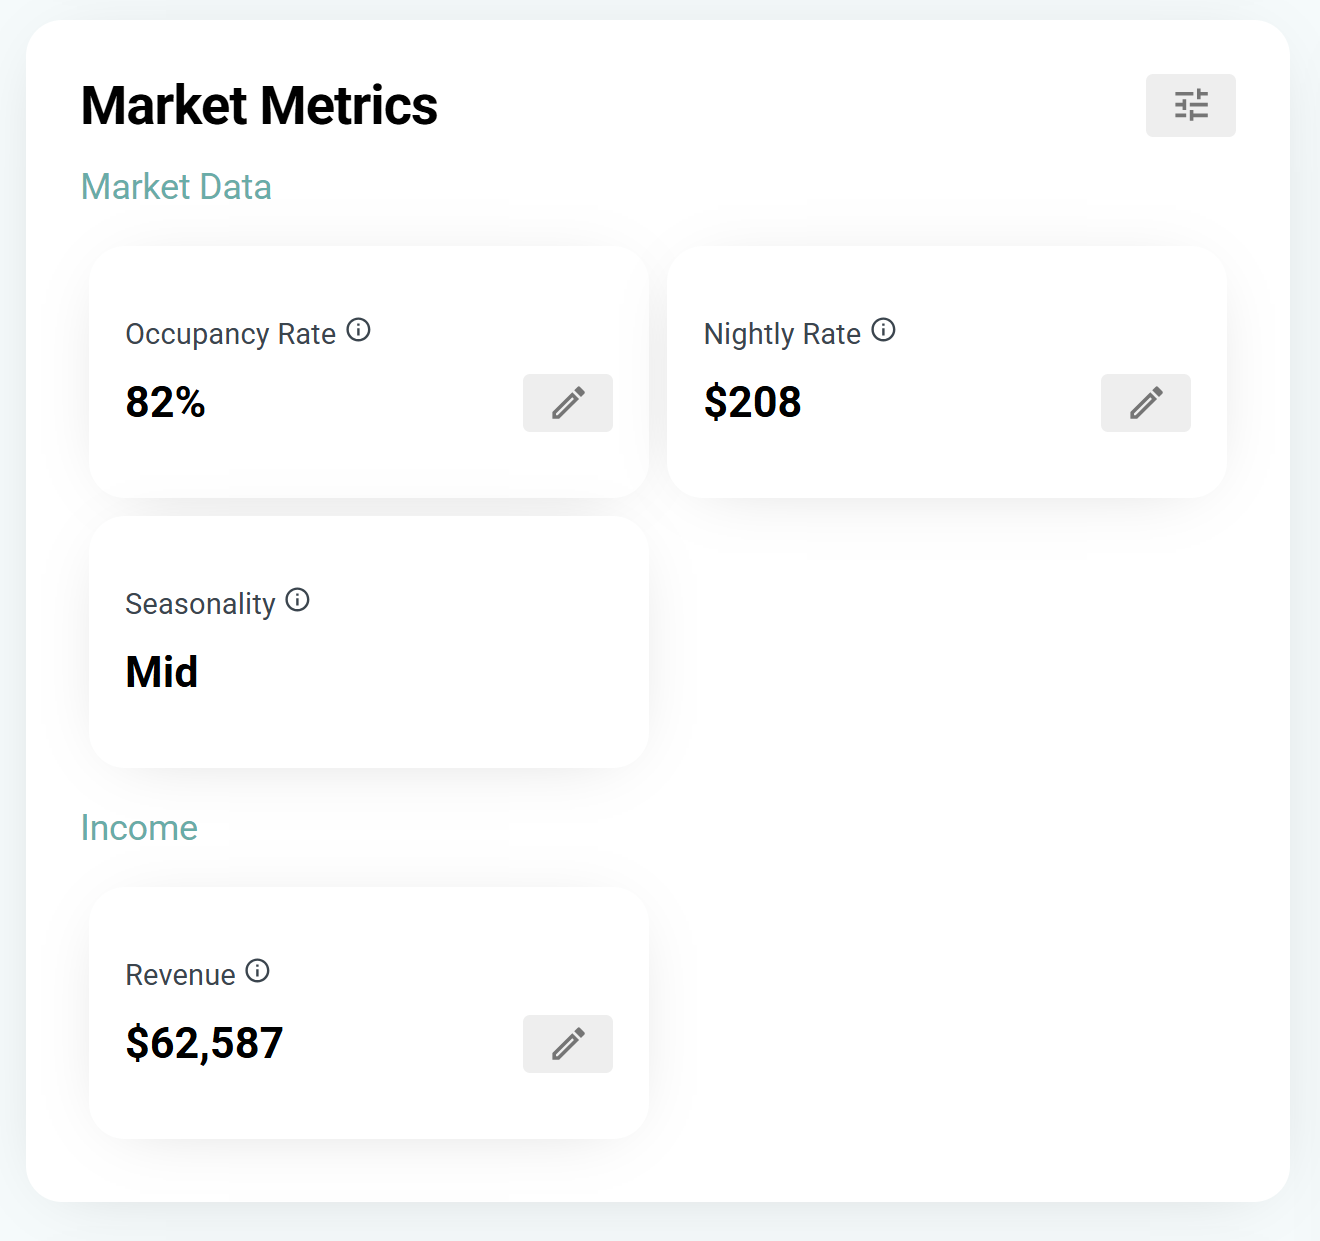
The Airbnb revenue calculator provides two primary metrics that drive your estimated income: Average Daily Rate (ADR) and Occupancy Rate. Understanding how to interpret these figures is essential for accurate ROI projections. ADR represents the average price you earn per booked night, while Occupancy Rate shows the percentage of available nights you are likely to rent out. Together, they form the foundation of your revenue forecast.
Interpreting Average Daily Rate (ADR)
ADR is calculated by dividing your total room revenue by the number of occupied rooms over a specific period. In the context of an Airbnb revenue calculator, this figure reflects your pricing strategy's effectiveness. If your estimated ADR is significantly lower than comparable listings in your area, you may be underpricing your property. Conversely, a high ADR with low occupancy suggests your price point may be too steep for the current market.
Use the calculator to test different nightly rates. Adjust the ADR input to see how changes in pricing impact your gross revenue. This helps you find the sweet spot where demand remains strong without leaving money on the table. Remember that ADR does not include cleaning fees, extra guest fees, or other ancillary income, so it represents only the core rental income.
Analyzing Occupancy Rate
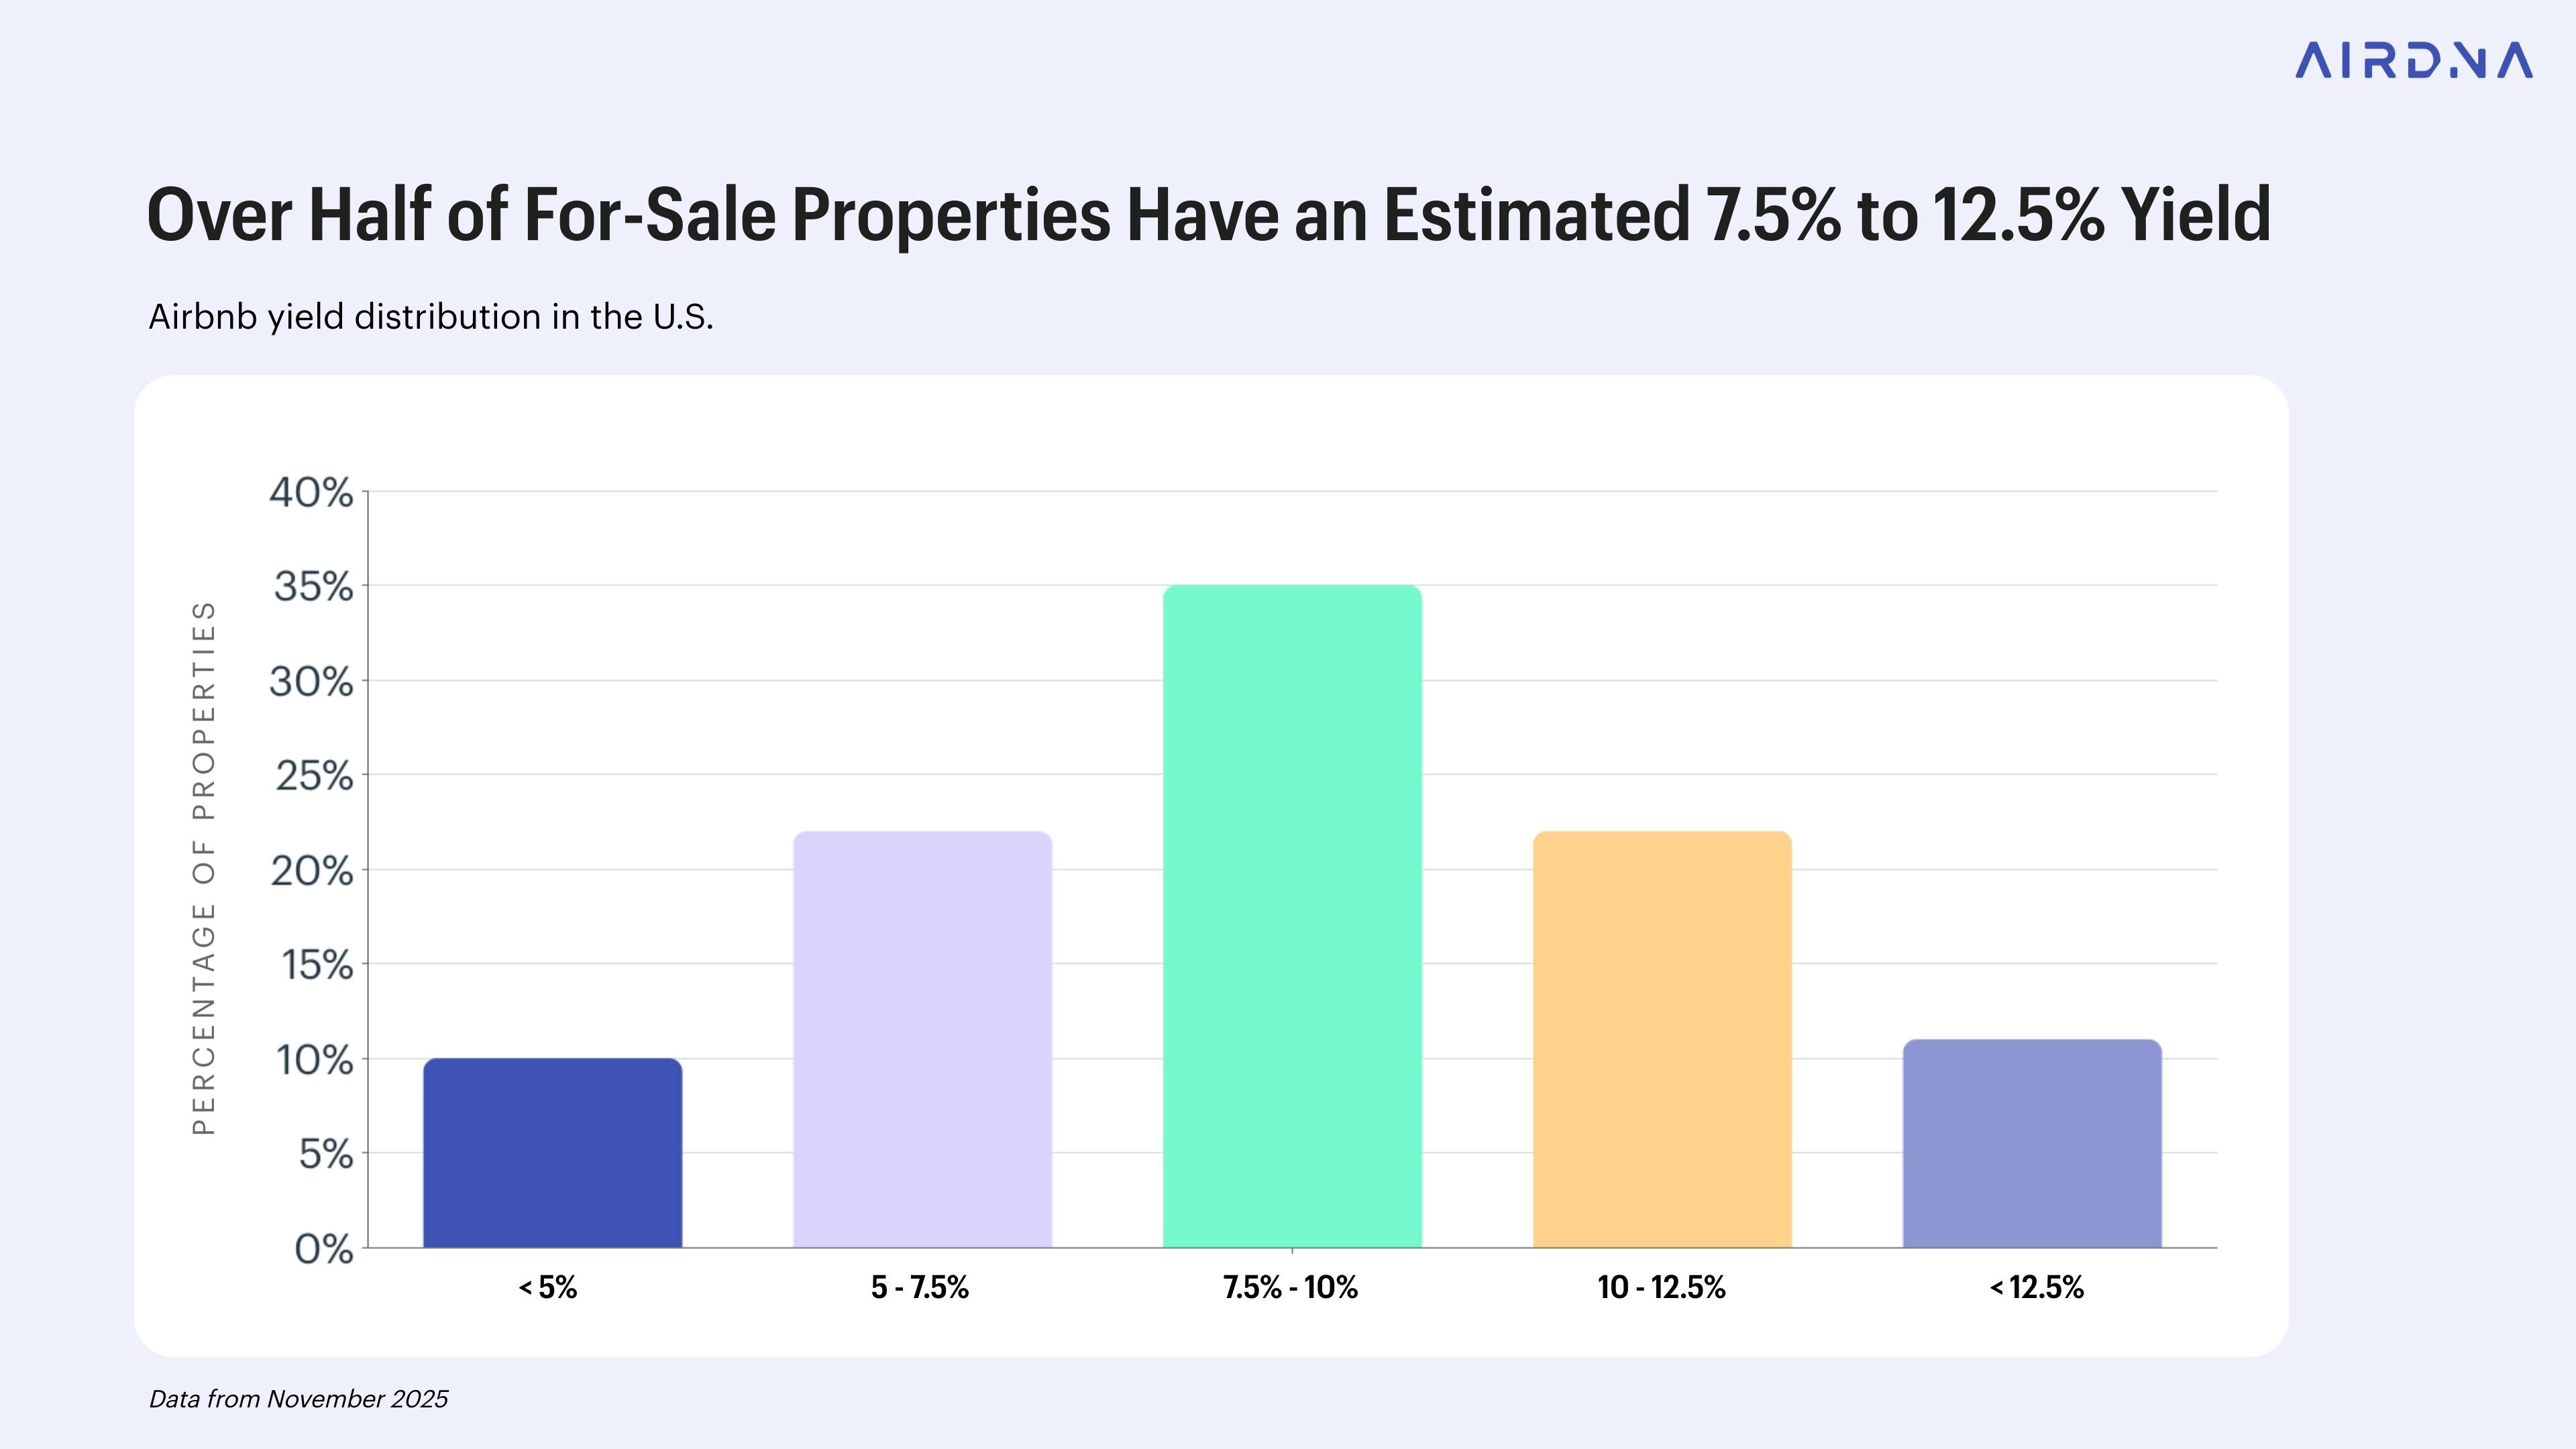
Occupancy Rate measures the percentage of time your listing is booked. It is a critical indicator of market demand and seasonal trends. Most Airbnb revenue calculators use historical data from your local market to estimate this percentage. If the tool projects a 70% occupancy rate, it means you can expect your property to be booked 70% of the nights in a year, or roughly 255 nights.
Keep in mind that occupancy rates fluctuate based on seasonality, local events, and market saturation. A high ADR is less valuable if the occupancy rate is low. The calculator helps you balance these two variables. For instance, lowering your nightly rate might increase occupancy, potentially leading to higher total revenue. Use the output to simulate these scenarios and understand the trade-offs.
Combining ADR and Occupancy for Revenue
The basic formula for estimating gross revenue is straightforward: multiply your estimated ADR by your projected occupancy days. As noted by industry tools, this simple multiplication provides a quick estimate of your year-round potential. However, this figure is gross revenue, not profit. To get a true ROI, you must subtract expenses such as cleaning fees, utilities, maintenance, and platform commissions from this total.
Review the calculator's final output carefully. If the projected revenue does not meet your financial goals, revisit the ADR and Occupancy inputs. Adjusting these variables allows you to model different scenarios and set realistic expectations for your hosting business.
Calculate net operating income
Gross revenue is only the starting line. To find the true return on your Airbnb investment, you must subtract every operational expense to determine the Net Operating Income (NOI). This figure represents the cash flow generated by the property before debt service, giving you a clear picture of profitability.
Start by entering your estimated gross income into the Airbnb revenue calculator. Then, systematically deduct the costs of running the listing. These expenses fall into two categories: variable costs that change with occupancy, and fixed costs that remain constant regardless of bookings.
-
Cleaning fees per stay
-
Property management fees (typically 15-25% of revenue)
-
Utilities (electricity, water, gas, internet)
-
Insurance (short-term rental specific)
-
Local taxes and licensing fees
-
Maintenance and repairs
-
Supplies and amenities
Most calculators allow you to input these values as fixed monthly amounts or as percentages of revenue. Property management fees, for instance, are often a percentage of the booking total, while cleaning fees are fixed per stay. Accuracy here is critical; underestimating maintenance or management costs can make a profitable property look like a money loser.
Once you have subtracted all operating expenses from the gross revenue, the result is your NOI. This number is the foundation for calculating your Cap Rate and cash-on-cash return. It tells you exactly how much cash the business generates, independent of how you financed the purchase.
Common calculation mistakes
Even with a robust Airbnb revenue calculator, input errors can distort your ROI projections. The most frequent pitfall is overestimating occupancy rates. Many hosts assume 80% to 90% utilization from day one, but new listings typically start lower as they build reviews and search ranking. If you project peak-season occupancy across the entire year, your cash flow estimates will be artificially inflated.
Seasonal fluctuations also skew results when treated as static averages. A monthly average obscures the sharp revenue drops in shoulder seasons. Enter specific monthly occupancy targets rather than a single annual percentage. This forces the calculator to account for vacancy periods and helps you identify the true break-even point for your property.
Ignoring hidden operating costs is another critical error. Standard calculators often focus on gross revenue, leaving out cleaning fees, maintenance reserves, and platform service fees. Ensure your tool includes these deductions in the net profit calculation. Without them, you might mistake gross income for actual cash flow, leading to poor investment decisions.
Finally, verify that the calculator uses recent, local comparable data. Generic national averages fail to capture neighborhood-specific trends or new supply entering the market. Use tools that pull real-time comp data, such as AirDNA or BNBCalc, to ensure your projections reflect current market conditions rather than historical highs.
No comments yet. Be the first to share your thoughts!