
Pick a reliable revenue calculator
Generic estimates often mask the true profitability of a short-term rental. To make sound investment decisions, you need a tool that pulls from real, updated market data rather than static averages. The foundation of your analysis depends on the accuracy of the underlying comp data.
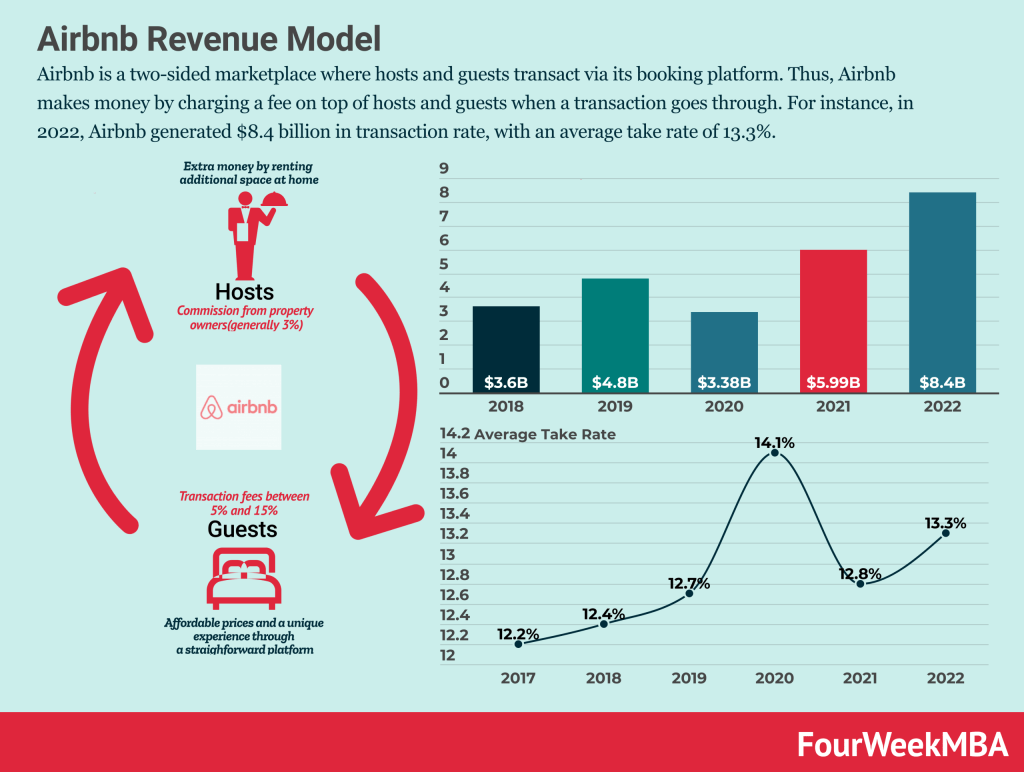
When selecting a calculator, prioritize platforms that offer weekly or daily data updates. This ensures your projections reflect current seasonal trends and local supply shifts. Look for tools that specifically integrate data from major platforms like Airbnb and Vrbo to provide a comprehensive view of the market.
Below is a comparison of four prominent calculators. This table highlights key differences in data freshness, cost structures, and integration capabilities to help you choose the right tool for your analysis.
| Tool | Data Freshness | Cost | Integrations |
|---|---|---|---|
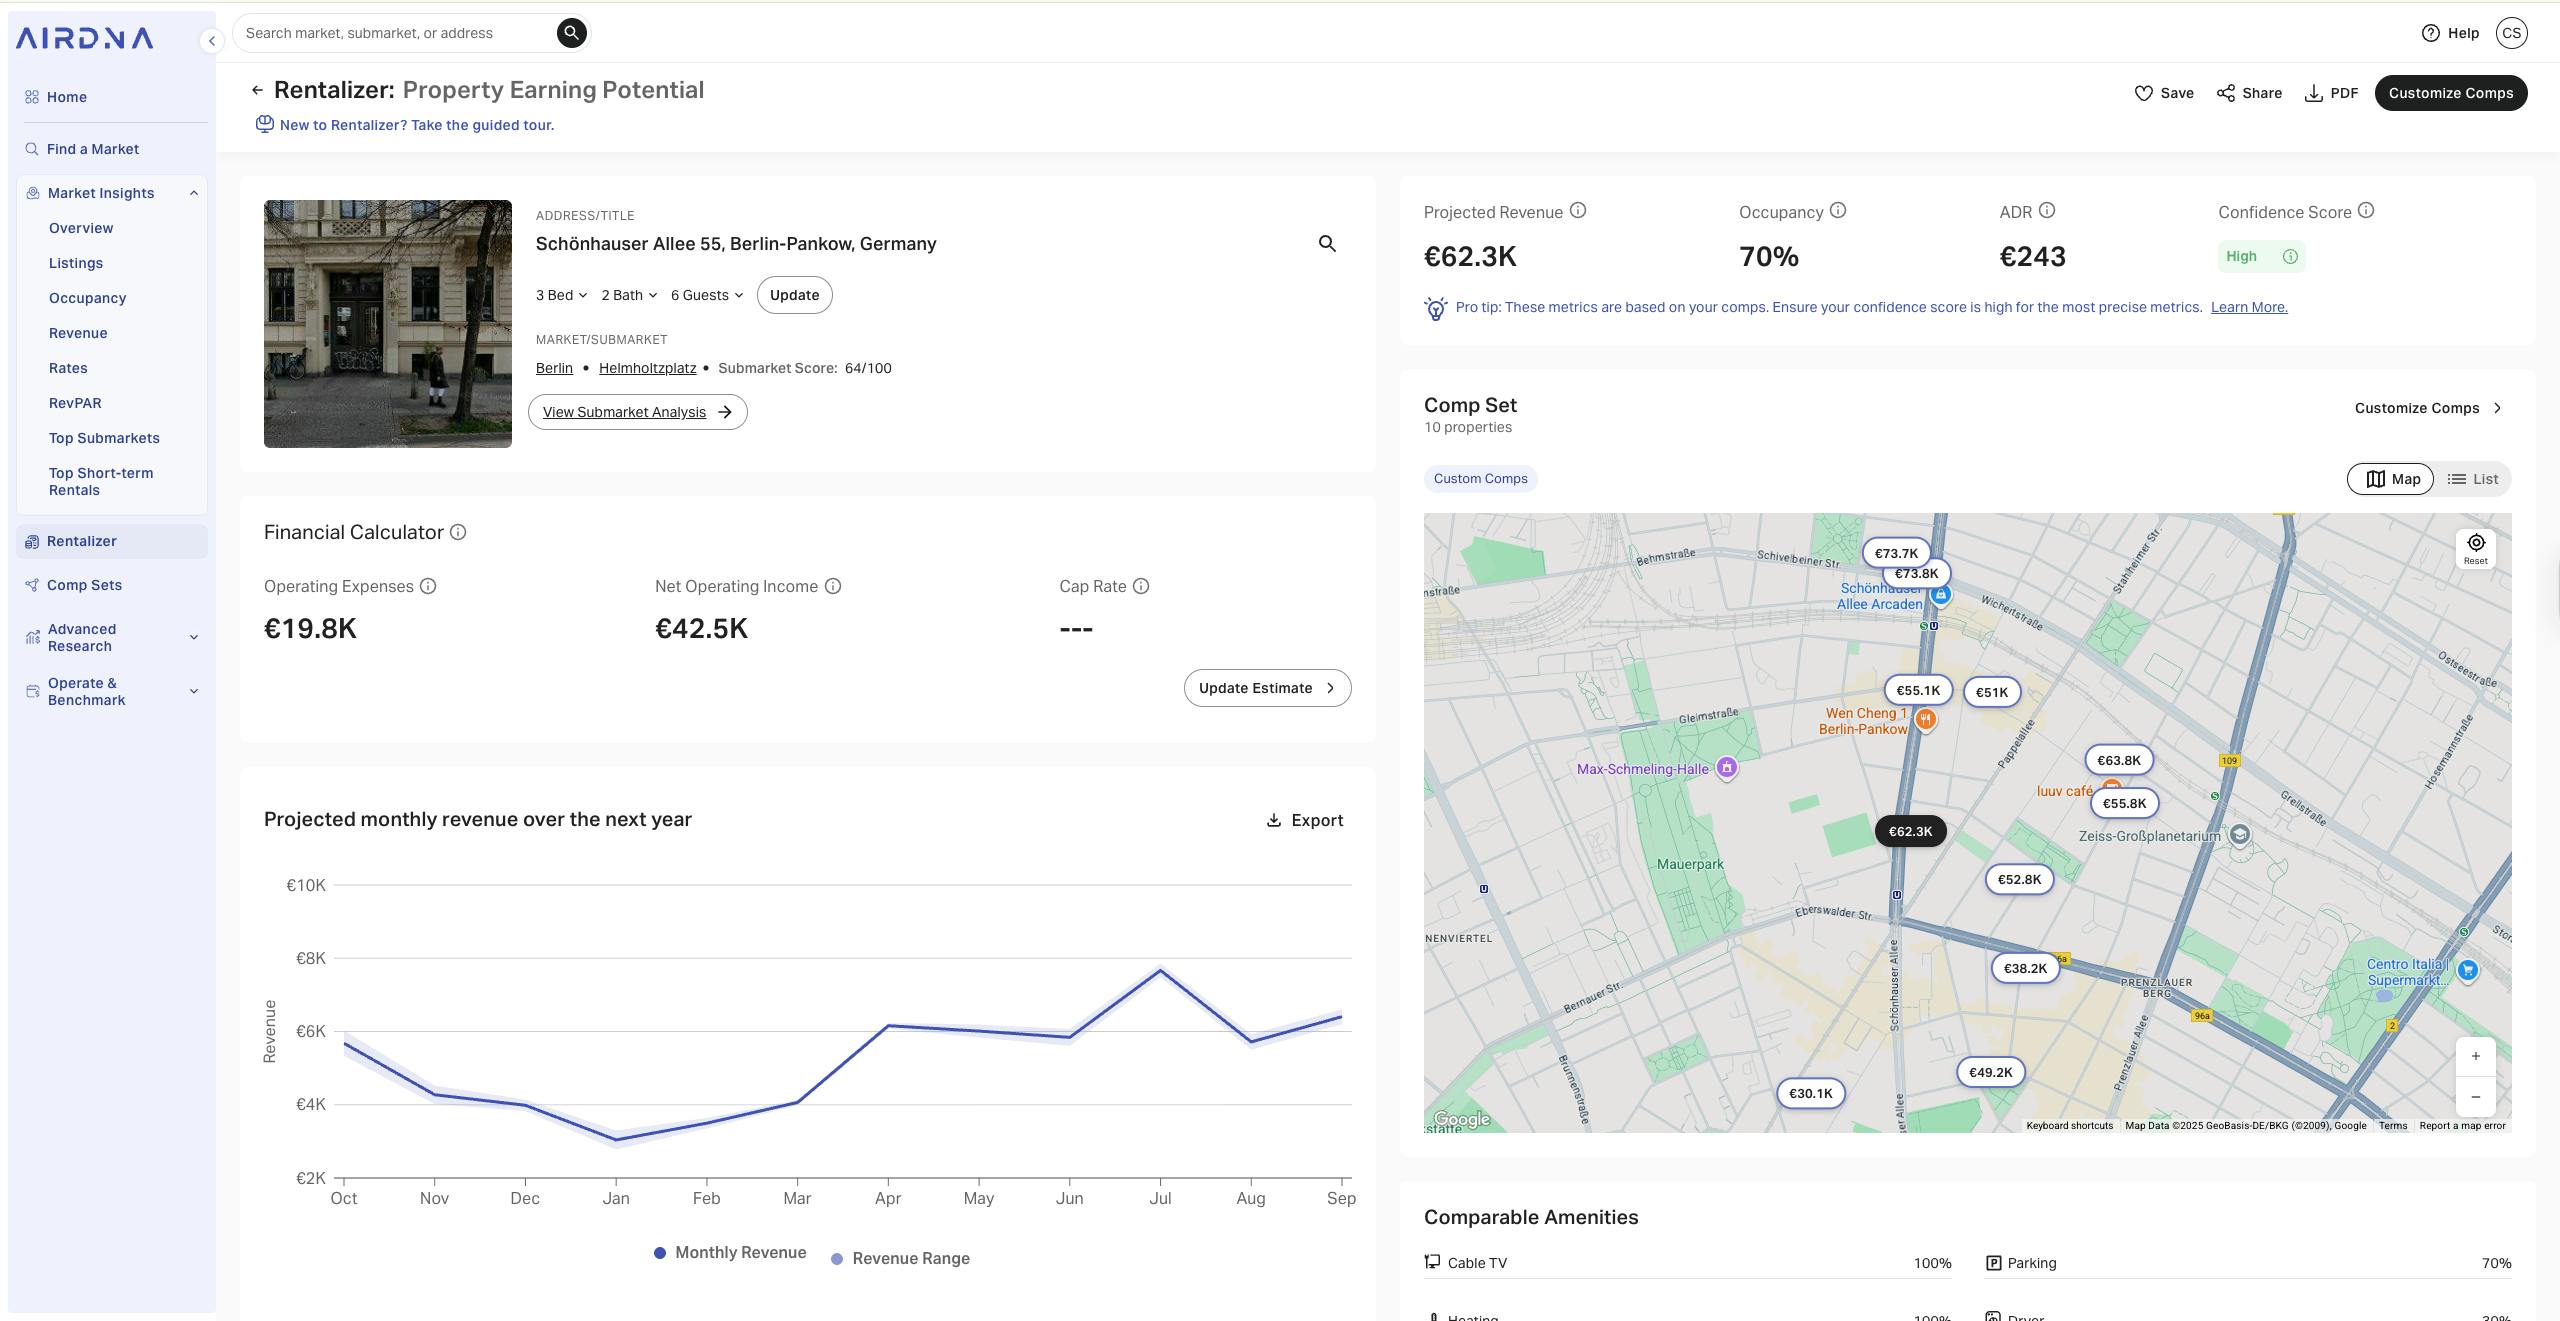
| AirDNA Rentalizer | Daily/Weekly | Free to start | Airbnb, Vrbo |
| Rabbu | Weekly | Free | U.S. Markets |
| BNBCalc | Real-time | Free/Paid | Airbnb, Vrbo |
| PriceLabs | Daily | Free | STR Platforms |
Enter property details and location
The accuracy of your Airbnb revenue projection depends entirely on the granularity of the data you input. Broad city-level estimates often mask significant neighborhood-level variations in demand and pricing power. To ensure financial precision, you must provide specific location data that reflects the actual market dynamics of the asset.
Input the full street address rather than a general city or zip code. Airbnb’s estimation tools rely on hyper-local booking data to calculate potential income. A specific address allows the algorithm to access granular metrics for that immediate neighborhood, ensuring the revenue model reflects the true competitive landscape. According to Airbnb, the interactive tool computes estimated income by factoring in prior booking data specific to the area defined by the address.
Identify whether the listing is an entire home, a private room, or a shared space. This selection is critical because it determines the baseline occupancy rates and average daily rates (ADR) the calculator uses. Entire homes typically command higher nightly rates but may face different seasonal demand curves compared to single rooms. Choosing the correct property type aligns the financial model with the actual inventory class you are analyzing.
Specify the number of bedrooms, bathrooms, and total square footage. These physical constraints directly influence the maximum capacity of the listing and, consequently, the pricing ceiling. The calculator uses these details to estimate how many guests the space can accommodate, which is a primary driver of gross revenue potential. Accurate spatial data prevents overestimating income from a property that physically cannot support the assumed guest volume.
List key amenities such as Wi-Fi, parking, kitchens, and outdoor spaces. While basic amenities are expected, premium features like pools, hot tubs, or dedicated workspaces can significantly boost nightly rates. The calculator adjusts the revenue projection based on the presence of these value-adds, which are proven to increase booking conversion rates in competitive markets.
By providing precise inputs for location, property type, and amenities, you transform a generic estimate into a reliable financial tool. This level of detail ensures that your revenue projections are grounded in the specific realities of the asset, allowing for more confident investment decisions.
Adjust occupancy and daily rate assumptions
Default algorithmic projections often rely on broad market averages that do not reflect the specific dynamics of your property’s neighborhood. To generate a realistic revenue forecast, you must replace these generic inputs with data derived from direct local competition. This process ensures your financial model accounts for saturation, seasonality, and hyper-local demand fluctuations.
1. Audit your average daily rate (ADR)
The average daily rate is the baseline price you charge per night. Most calculators default to a city-wide or county-wide mean, which can be misleading if your property differs in quality or amenities. Instead, identify 10–15 active listings within a one-mile radius that match your property’s bedroom count, bed type, and amenity profile (e.g., pool, parking, workspace).
Calculate the median nightly rate of these comparable properties during your peak season months. If your property offers premium amenities like a hot tub or dedicated office, you may justify a 10–15% premium over this median. Conversely, if your unit lacks parking or has older finishes, adjust downward. This granular approach prevents the common error of pricing based on luxury outliers or distressed inventory in your area.
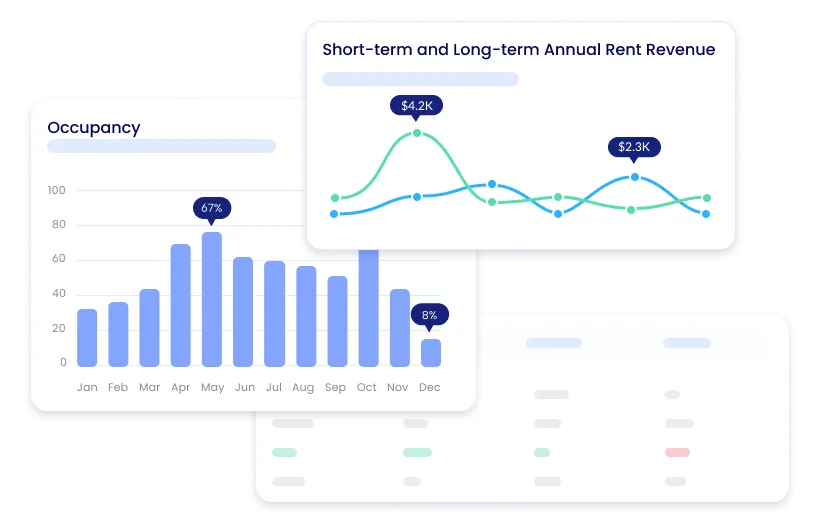
2. Refine occupancy percentages by season
Occupancy rates are rarely uniform throughout the year. A static annual average masks the volatility of short-term rental demand. Break your projection into quarterly or monthly segments to account for seasonal shifts. For example, a beachfront property may see 80% occupancy in summer but drop to 40% in winter, while a business-trip-focused urban loft might peak during weekdays and drop on weekends.
Use local event calendars and tourism board data to identify high-demand periods. If your city hosts a major annual conference or festival, model a temporary spike in both rate and occupancy for those specific dates. Conversely, identify off-peak months where demand naturally contracts. Weight these seasonal rates by the number of days in each month to derive a more accurate annual occupancy figure than a simple annual average would provide.
3. Validate against local comp tools
Cross-reference your manual adjustments with data from established property management platforms. Tools like Airbtics or RedAwning aggregate data from thousands of managed properties, offering insights into how similar units perform in your specific zip code. Compare your manually derived ADR and occupancy against their reported medians for your property type.
If your assumptions diverge significantly from these aggregated benchmarks, investigate the discrepancy. You may have overlooked a key local constraint, such as a new competitor opening nearby or a regulatory change limiting rental days. Aligning your inputs with these primary data sources ensures your revenue calculator reflects market reality rather than optimistic speculation.
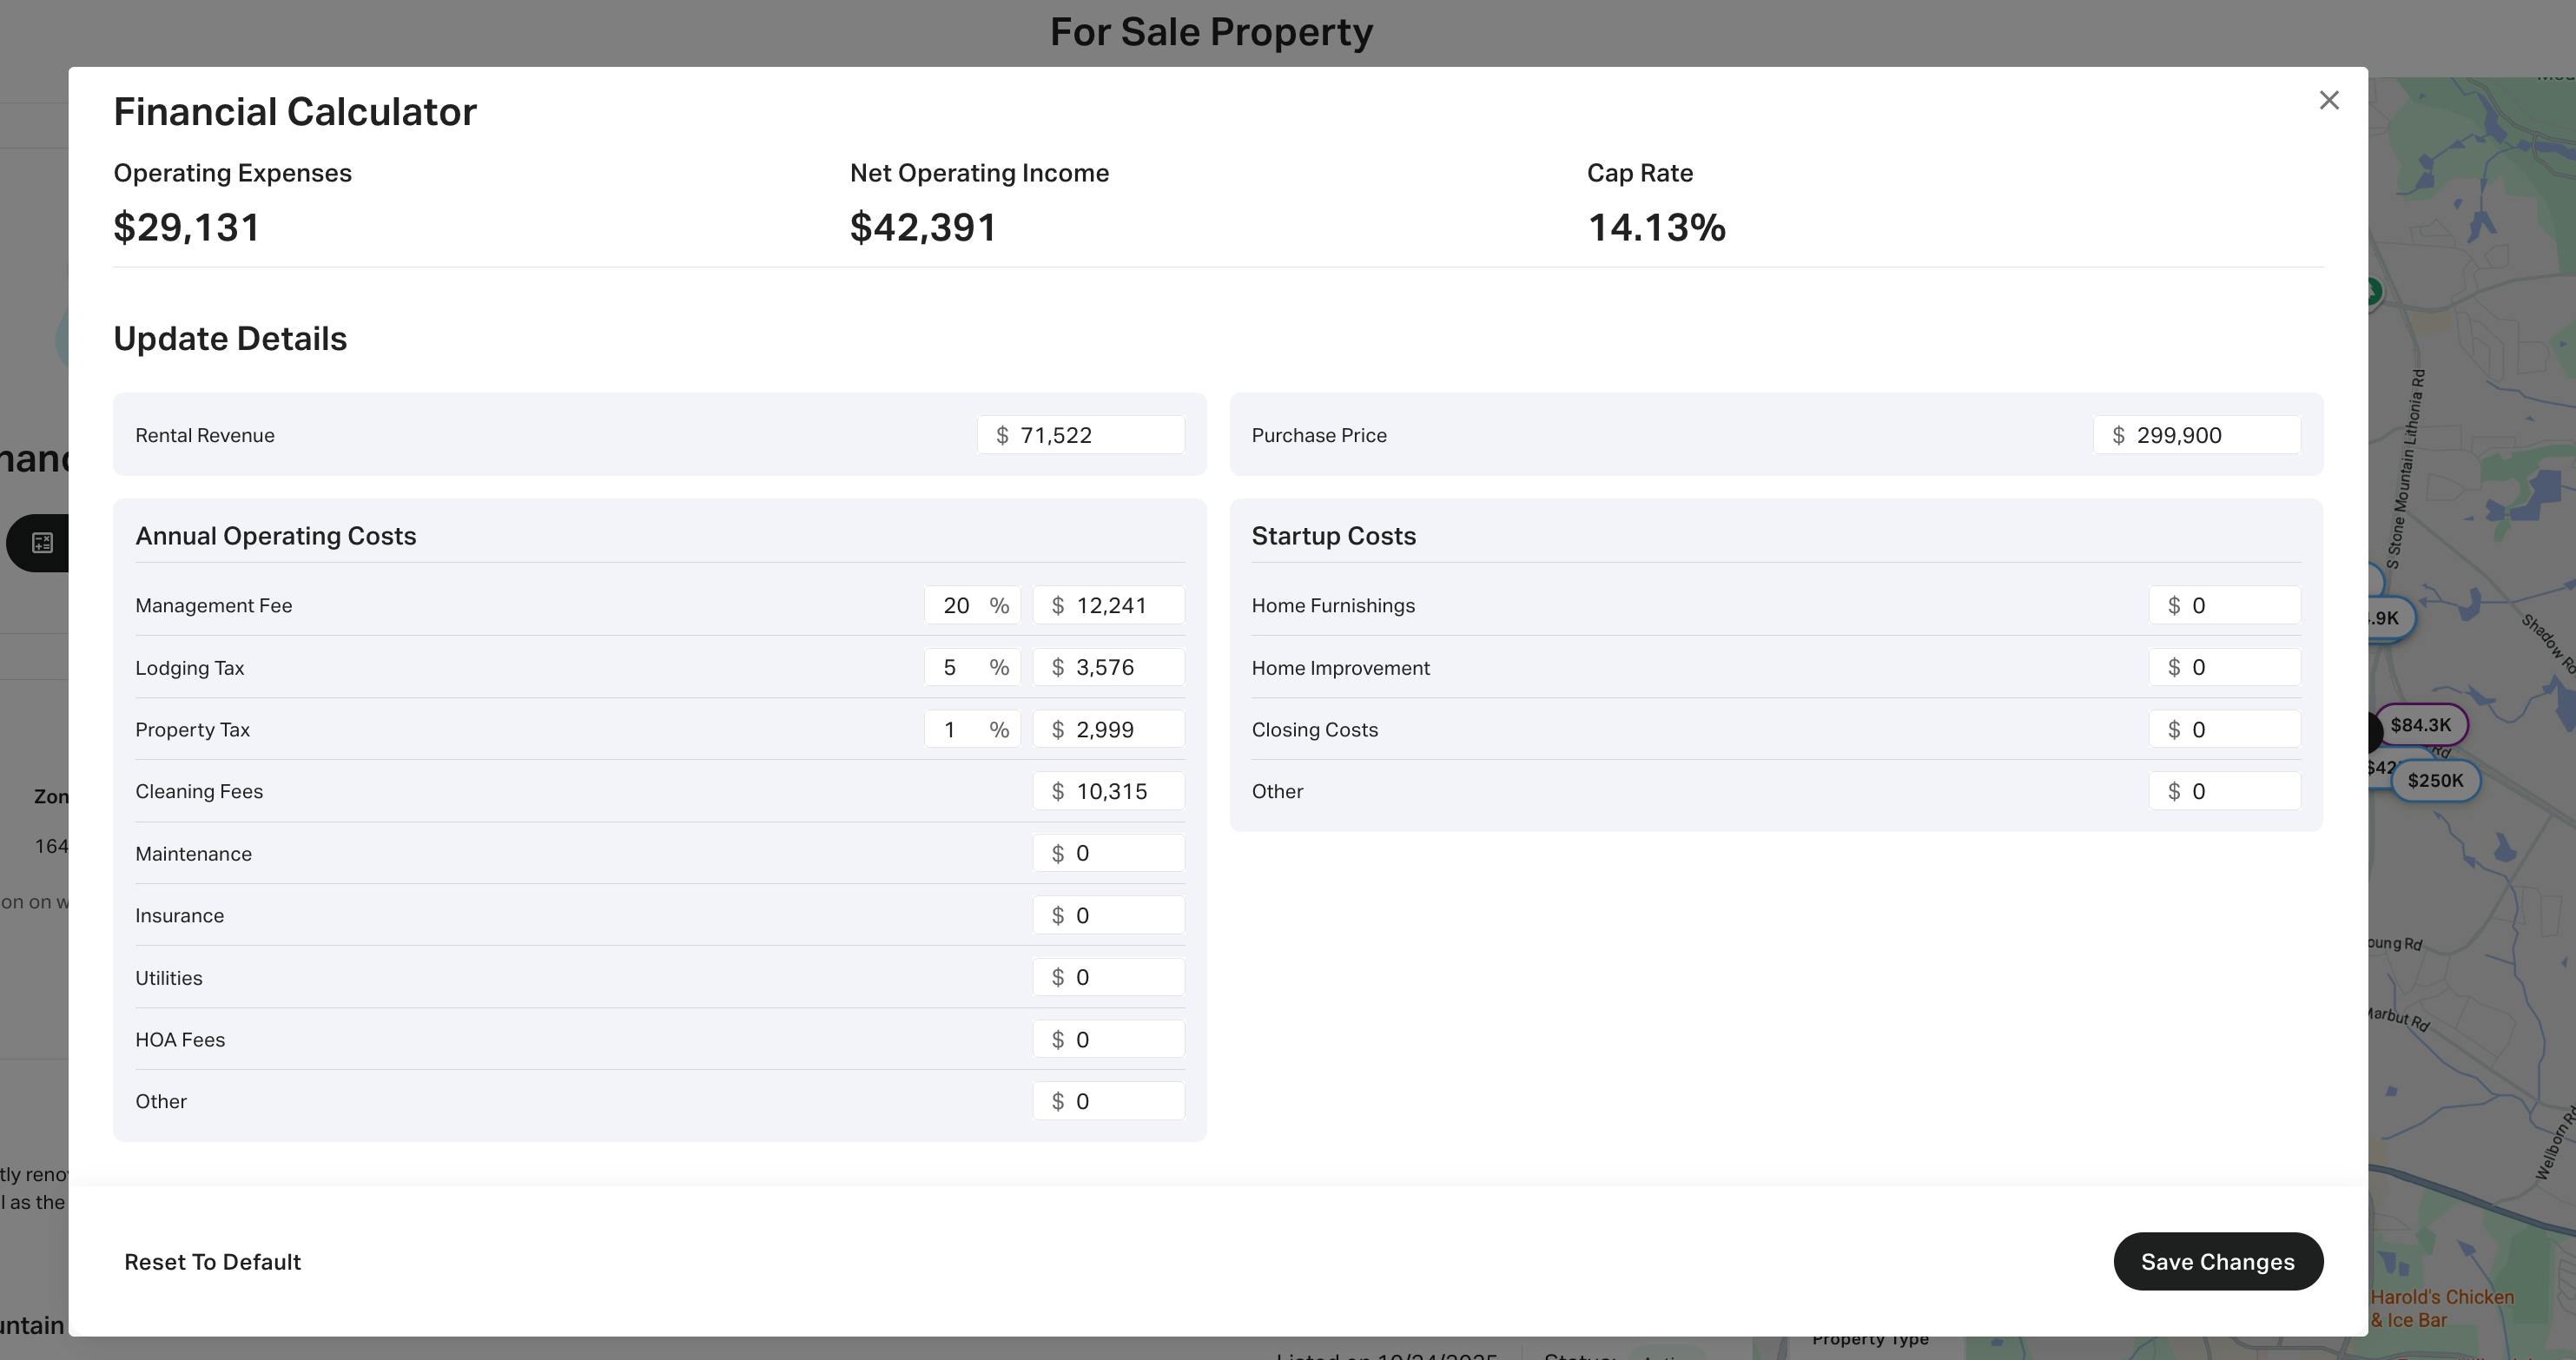
Calculate Net Operating Income and ROI
Gross revenue tells you what the market pays; net operating income (NOI) tells you what you keep. To move from the projected revenue in your Airbnb revenue calculator to a viable investment, you must subtract every operating expense from the gross income. This process strips away the noise of occupancy fluctuations and reveals the property's true cash-generating potential.
Start by listing all variable and fixed costs associated with the short-term rental (STR) operation. Unlike long-term rentals, STRs carry higher turnover costs, including cleaning fees, guest supplies, and dynamic pricing software subscriptions. Fixed costs such as property management fees (typically 20–25% of gross revenue), insurance, and property taxes remain constant regardless of occupancy. Subtract these total expenses from your gross revenue to determine the NOI.
Once you have the NOI, calculate the Return on Investment (ROI) to assess capital efficiency. Divide the annual NOI by the total cash invested, which includes the down payment, closing costs, and any immediate renovation or furnishing expenses. This percentage indicates how effectively your capital is working. A higher ROI suggests a stronger investment, but it must be compared against alternative investments like the S&P 500 or local long-term rental yields to contextualize the risk.
- Cleaning fees and laundry services
- Guest supplies (toilet paper, coffee, shampoo)
- Property management fees (20–25%)
- Utilities (electric, water, gas, internet)
- STR-specific insurance and licenses
- Furniture replacement reserves
- Maintenance and repair fund
Validate Results Against Local Market Data
Calculator outputs are theoretical until cross-referenced with active listings. Without this sanity check, your revenue projections remain estimates rather than actionable financial data. This step ensures the inputs you entered reflect current supply and demand dynamics.
Start by identifying 5–10 comparable listings in your target neighborhood. Filter for properties with similar bedroom counts, amenities, and guest capacity. Record their nightly rates, occupancy percentages, and review scores. These metrics provide the baseline for validating your assumed Average Daily Rate (ADR) and occupancy assumptions.
Compare your calculator’s projected ADR against the median nightly rate of these comparable properties. If your input assumes $200 per night but the market median is $150, adjust your model downward. Similarly, verify your occupancy rate. A common error is assuming 80% occupancy in a seasonal market where actual performance hovers around 60%.
Use tools like Rabbu to access verified rental income data for specific markets. These platforms aggregate real booking data, offering a more accurate reflection of local performance than generic industry averages. Cross-checking your manual inputs against this verified data prevents overestimation and protects your investment thesis from optimistic bias.
Frequently asked questions about revenue calculators
Airbnb revenue calculators rely on historical data from major platforms to generate projections. While these tools provide a useful baseline, they do not guarantee actual income. Understanding how the underlying data works helps you interpret the results with the necessary financial precision.
These answers clarify the limitations and strengths of automated projections. Use them to refine your input parameters and build a more robust financial model for your investment.
No comments yet. Be the first to share your thoughts!