
The 2026 ROI outlook
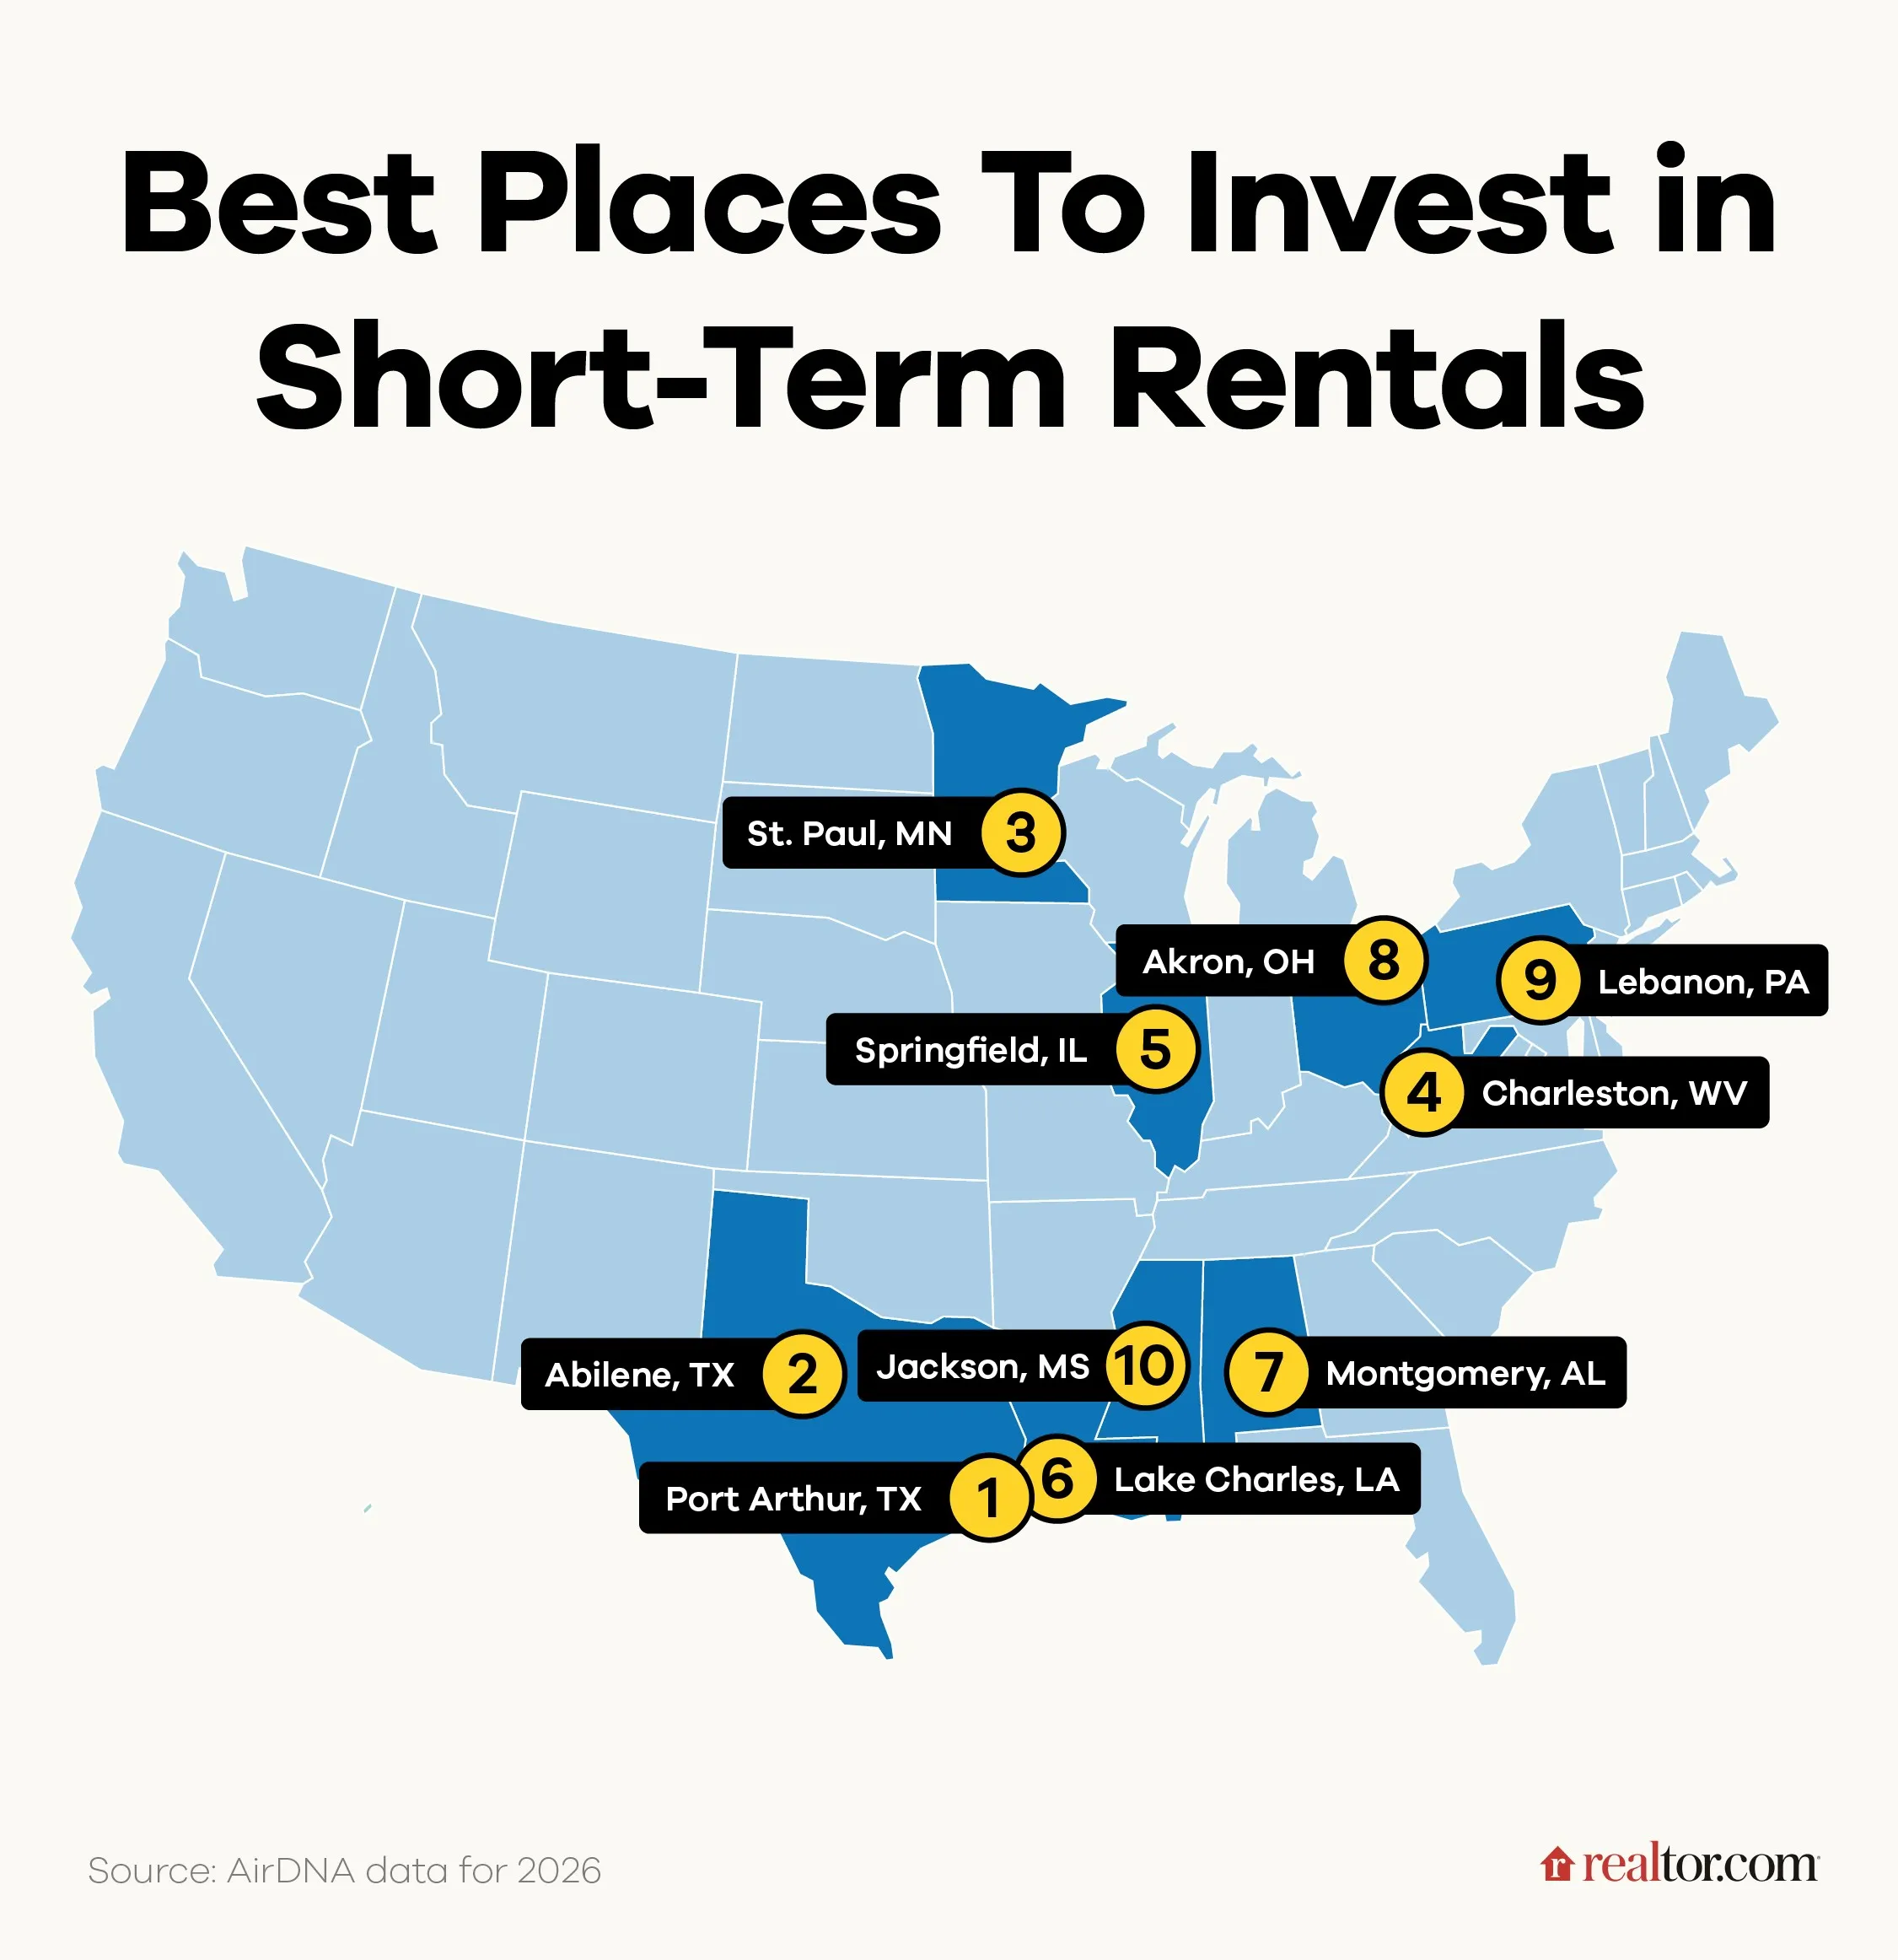
We analyzed AirDNA and Mashvisor data to find cities where 2026 returns are likely to top 20%. These aren't just the usual vacation spots. We looked for markets where tourism is rebounding and work-from-anywhere trends are actually sticking, creating a gap between high demand and low housing supply.
The short-term rental market has proven remarkably resilient, even in the face of economic uncertainty. The shift towards remote work has broadened the pool of potential renters, while a renewed appetite for travel is driving up demand in established vacation hotspots. However, it’s important to acknowledge that a 20% ROI is a significant benchmark, and achieving it requires diligent research and a nuanced understanding of local market dynamics. Projections are based on current trends and available data, but are not guarantees. External factors, like unexpected economic downturns or shifts in travel preferences, can influence outcomes.
We've focused on markets demonstrating consistent growth in occupancy rates and average daily rates (ADR). Using data aggregated through late 2024 and early 2025, we’ve projected forward, accounting for anticipated changes in supply and demand. This isn’t about chasing hype; it's about identifying sustainable opportunities where data supports a strong investment case. The cities listed below aren’t just performing well now, they're positioned to continue that performance into 2026 and beyond. Understanding the underlying drivers of this success is crucial for making informed investment decisions.
15 cities to watch
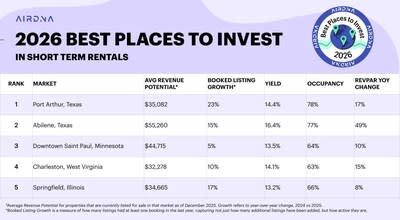
These 15 cities show the highest projected returns for 2026 based on February 2025 data. These are estimates, as local laws or economic shifts can change the math quickly.
1. Nashville, Tennessee (24.5% ROI): Nashville’s music scene and vibrant nightlife continue to attract visitors. The ADR averages $285 with an occupancy rate of 78%. Demand is driven by concerts, bachelor/bachelorette parties, and a growing business sector. However, increasing regulation regarding short-term rentals is a risk to monitor.
2. Miami, Florida (23.8% ROI): Miami’s allure as a luxury destination and cultural hub remains strong. ADR is around $350, with an occupancy rate of 75%. Major events, international business, and a thriving arts scene fuel demand. Coastal property is susceptible to hurricane damage and rising insurance costs.
3. Phoenix, Arizona (22.9% ROI): Phoenix benefits from a warm climate and affordability compared to other major cities. ADR averages $210 with an occupancy rate of 72%. Demand is boosted by spring training, outdoor activities, and a growing tech industry. Water scarcity is a long-term concern.
4. Austin, Texas (22.5% ROI): Austin’s status as a tech hub and cultural center continues to attract a diverse range of visitors. ADR is approximately $260 with an occupancy rate of 70%. Major festivals, conferences, and a thriving music scene drive demand. Rapid growth is straining infrastructure.
5. Charleston, South Carolina (21.8% ROI): Charleston’s historic charm and culinary scene make it a popular tourist destination. ADR averages $275 with an occupancy rate of 73%. Demand is driven by history buffs, foodies, and couples seeking a romantic getaway. Strict regulations on short-term rentals are present in some areas.
6. Savannah, Georgia (21.5% ROI): Savannah’s unique atmosphere and architectural beauty attract a steady stream of visitors. ADR is around $240 with an occupancy rate of 71%. Demand is fueled by history tours, ghost tours, and a vibrant arts scene. Seasonal tourism can lead to occupancy fluctuations.
7. Tampa, Florida (21.2% ROI): Tampa offers a mix of beaches, theme parks, and cultural attractions. ADR averages $230 with an occupancy rate of 74%. Demand is driven by family vacations, sporting events, and a growing cruise industry. Hurricane risk is a concern.
8. New Orleans, Louisiana (20.9% ROI): New Orleans's unique culture and lively atmosphere draw tourists year-round. ADR is approximately $250 with an occupancy rate of 69%. The French Quarter and major festivals are key demand drivers. Potential for flooding and damage from hurricanes exists.
9. Dallas, Texas (20.7% ROI): Dallas is a major business and transportation hub, attracting both corporate and leisure travelers. ADR averages $200 with an occupancy rate of 76%. Conferences, events, and a thriving arts scene drive demand. Competition is increasing.
10. Oklahoma City, Oklahoma (20.6% ROI): Oklahoma City is experiencing a revitalization, with a growing economy and a burgeoning arts scene. ADR is around $175 with an occupancy rate of 78%. Demand is driven by business travelers and tourists exploring the city's attractions. Limited brand recognition compared to other markets.
11. San Antonio, Texas (20.4% ROI): San Antonio’s rich history and cultural attractions make it a popular destination. ADR averages $190 with an occupancy rate of 75%. The River Walk and Alamo are major demand drivers. Summer heat can impact occupancy.
12. Myrtle Beach, South Carolina (20.3% ROI): Myrtle Beach is a classic family vacation destination with miles of beaches. ADR is approximately $180 with an occupancy rate of 72%. Demand is driven by beachgoers and families. Highly seasonal tourism.
13. Huntsville, Alabama (20.2% ROI): Huntsville benefits from a strong aerospace industry and a growing tech sector. ADR is around $160 with an occupancy rate of 80%. Demand is driven by business travelers and visitors to the U.S. Space & Rocket Center. Limited tourist attractions beyond space-related activities.
14. Pittsburgh, Pennsylvania (20.1% ROI): Pittsburgh’s transformation into a tech and healthcare hub is attracting a new wave of visitors. ADR averages $170 with an occupancy rate of 74%. Demand is driven by business travelers, students, and tourists exploring the city’s cultural attractions. Cold winters can impact tourism.
15. Kansas City, Missouri (20.0% ROI): Kansas City offers a vibrant arts scene, delicious barbecue, and affordable prices. ADR is around $150 with an occupancy rate of 79%. Demand is driven by events, conventions, and food tourism. Limited national recognition as a travel destination.
Short Term Rental Investment Hotspots 2026: Projected Performance
| City | State | Projected ROI (2026) | Average Daily Rate (ADR) | Occupancy Rate | Key Demand Drivers | Potential Risks |
|---|---|---|---|---|---|---|
| Nashville | Tennessee | 24.5% | Approximately $210 | 78% | Strong tourism, music industry events, growing population | Increasing regulation, potential for market saturation |
| Phoenix | Arizona | 22.1% | Around $185 | 72% | Warm climate, outdoor recreation, business travel | Seasonal demand fluctuations, water resource concerns |
| Houston | Texas | 21.8% | Approximately $160 | 75% | Energy sector, medical center, diverse economy | Susceptibility to natural disasters, economic sensitivity to oil prices |
| Atlanta | Georgia | 20.9% | Around $190 | 70% | Film industry, major airport, corporate headquarters | Traffic congestion, potential for increased property taxes |
| Charlotte | North Carolina | 20.5% | Approximately $175 | 68% | Financial services, growing job market, quality of life | Increasing competition, potential for stricter rental regulations |
| Raleigh | North Carolina | 20.3% | Around $180 | 65% | Research Triangle Park, technology sector, university presence | Limited inventory in desirable areas, potential for rising property values |
| San Antonio | Texas | 20.1% | Approximately $150 | 73% | Historical attractions, River Walk, military bases | Seasonal temperature extremes, potential for increased tourism-related costs |
| Jacksonville | Florida | 20.0% | Around $170 | 69% | Military presence, beaches, affordable housing (relative to other Florida cities) | Hurricane risk, potential for coastal erosion |
Illustrative comparison based on the article research brief. Verify current pricing, limits, and product details in the official docs before relying on it.
The math behind the numbers
Understanding the key metrics is fundamental to accurately assessing the potential of a short-term rental investment. The interplay between Average Daily Rate (ADR), Occupancy Rate, Revenue Per Available Rental (RevPAR), and expenses dictates the ultimate ROI. Each metric tells a piece of the story, and investors must learn to interpret them collectively.
ADR represents the average revenue generated per night for a rental property. A higher ADR doesn’t automatically translate to higher profits; it must be balanced against occupancy. Occupancy Rate signifies the percentage of nights a property is booked over a given period. A high occupancy rate with a low ADR might yield similar revenue to a low occupancy rate with a high ADR, but the associated costs will differ.
RevPAR, calculated by multiplying ADR by Occupancy Rate, provides a more comprehensive view of revenue performance. It allows for comparison between properties of different sizes or locations. However, RevPAR doesn’t account for expenses. A seemingly high RevPAR can be eroded by substantial operating costs – mortgage payments, property taxes, insurance, management fees, and maintenance expenses all play a role. A rental property roi calculator is essential for accurate projections.
It’s crucial to remember that these metrics are not static. They fluctuate based on seasonality, local events, and broader economic trends. Relying solely on these numbers without considering local market knowledge – understanding neighborhood dynamics, competitor pricing, and upcoming developments – is a recipe for miscalculation. Local knowledge is as important as the data itself.
Local laws and risks
The regulatory environment surrounding short-term rentals is evolving rapidly. What was permissible a year ago may be restricted today, and investors must stay informed about local laws to avoid costly penalties or operational disruptions. A growing number of cities are enacting regulations to address concerns about housing affordability, neighborhood disruption, and tax revenue.
Common regulations include permit requirements, zoning restrictions, occupancy limits, and outright bans on short-term rentals in certain areas. Some cities require owners to live on-site, while others impose strict limits on the number of nights a property can be rented annually. Violations can result in fines, legal action, and even the revocation of permits.
Cities like New York City and San Francisco have particularly stringent regulations, making it challenging to operate short-term rentals legally. Other cities, like Nashville and New Orleans, are actively debating and revising their rules. It's essential to research the specific regulations in each target market before making any investment decisions. Ignoring these rules isn’t an option.
Resources for researching local laws include city websites, planning departments, and legal professionals specializing in real estate. Websites like the American Short-Term Vacation Rental Association (ASTVR) offer information and advocacy on behalf of the industry. Be proactive in understanding the legal landscape— it’s a major factor impacting your ROI.
- Check city and county websites for rental rules.
- Contact the local planning department for clarification.
- Consult with a real estate attorney specializing in short-term rentals.
- Review homeowner association (HOA) rules, if applicable.
- Stay updated on any proposed changes to local laws.
Beyond the Top 15: Emerging Markets
While the top 15 cities offer established opportunities, several emerging markets are showing promising signs for short-term rental investment. These locations often present lower entry costs and less competition, offering the potential for significant growth.
Boise, Idaho: Benefiting from an influx of residents from more expensive cities, Boise offers outdoor recreation and a growing economy. Demand is driven by adventure travelers and remote workers.
Chattanooga, Tennessee: Chattanooga’s revitalized downtown and outdoor amenities are attracting tourists and young professionals. The city is becoming a hub for outdoor adventure and technology.
Raleigh-Durham, North Carolina: The Research Triangle Park area is a major economic driver, attracting business travelers and students. The region offers a high quality of life and a growing arts scene.
Albuquerque, New Mexico: Albuquerque’s unique culture, hot air ballooning, and proximity to outdoor attractions are attracting a growing number of visitors. It offers a relatively affordable entry point.
Fort Lauderdale, Florida: Often overshadowed by Miami, Fort Lauderdale offers beautiful beaches, a vibrant nightlife, and a more relaxed atmosphere. It's attracting a growing number of tourists and remote workers.
Richmond, Virginia: Richmond’s rich history, craft beer scene, and affordable prices are attracting a growing number of visitors. The city is undergoing a revitalization.
Investors exploring these emerging markets should focus on identifying properties in desirable locations with strong growth potential. Thorough due diligence and local market research are essential.
Financing & Investment Strategies
Securing financing for short-term rental investments requires careful planning. Traditional mortgages can be challenging to obtain, as lenders may view short-term rentals as riskier than long-term rentals. However, several alternative financing options are available.
DSCR (Debt Service Coverage Ratio) loans are specifically designed for investors purchasing properties based on their potential rental income. These loans typically require a lower down payment and focus on the property's ability to generate sufficient cash flow to cover the mortgage payment. Private lending and hard money loans are also options, but they typically come with higher interest rates and fees.
Different investment strategies can be employed to maximize returns. Buying properties outright offers the greatest control but requires significant capital. Partnering with other investors allows for shared risk and rewards. Utilizing property management companies can streamline operations and reduce the burden on owners.
Due diligence is paramount. Thoroughly research the local market, assess potential expenses, and understand the regulatory environment before making any investment. Risk management is also crucial. Consider factors like vacancy rates, property damage, and potential legal liabilities. A solid understanding of airbnb market data is essential for making informed decisions.
Short-Term Rental ROI Price Prediction 2026
Bull / Base / Bear scenario analysis
| Timeframe | Bull Case | Base Case | Bear Case | Key Driver |
|---|---|---|---|---|
| 1 Month | 22.5% | 20.8% | 18.2% | Peak winter booking season and travel demand surge |
| 3 Months | 24.1% | 21.6% | 17.9% | Spring break and early summer reservation patterns |
| 6 Months | 26.3% | 22.7% | 16.8% | Summer peak season performance and supply constraints |
| 1 Year | 28.9% | 23.4% | 15.2% | Full seasonal cycle completion and regulatory stabilization |
Price Prediction Summary
STR ROI is expected to maintain strong performance above 20% in base case scenarios, driven by continued travel recovery and supply-demand imbalances in key markets. Bull case scenarios anticipate significant yield expansion through premium market positioning, while bear case reflects potential regulatory headwinds and market saturation risks.
Key Factors Affecting Short-Term Rental ROI Stock Price
- Seasonal booking patterns and occupancy rate fluctuations
- Local regulatory changes and zoning restrictions
- Tourism recovery trends and business travel normalization
- New supply additions and market saturation levels
Disclaimer: Predictions are speculative and not financial advice. Stock price predictions are based on current market analysis and may vary significantly due to market volatility, economic conditions, and other unpredictable factors. Always do your own research before making investment decisions.


No comments yet. Be the first to share your thoughts!